MUSCLE W49 : A Multi-Scale Continuum and Line Exploration of the Most Luminous Star Formation Region in the Milky Way. I. Data and The Mass Structure of the Giant Molecular Cloud.
Abstract
The Multi-Scale Continuum and Line Exploration of W49 (MUSCLE W49) is a comprehensive gas and dust survey of the giant molecular cloud (GMC) of W49A, the most luminous star-formation region in the Milky Way. The project covers, for the first time, the entire GMC at different scales and angular resolutions. In this paper we present: 1) an all-configuration SMA mosaic in the 230-GHz (1.3-mm) band covering the central ( pc, known as W49N), where most of the embedded massive stars reside; and 2) PMO 14m telescope observations in the 90-GHz band, covering the entire GMC with maps of up to in size, or pc. We also make use of archival data from the VLA, JCMT-SCUBA, IRAM 30m, and the CSO BOLOCAM Galactic Plane Survey. We derive the basic physical parameters of the GMC at all scales. Our main findings are as follows: 1) The W49 GMC is one of the most massive in the Galaxy, with a total mass M⊙ within a radius of 60 pc. Within a radius of 6 pc, the total gas mass is M⊙. At these scales only of the material is photoionized. The mass reservoir is sufficient to form several young massive clusters (YMCs) as massive as a globular cluster. 2) The mass of the GMC is distributed in a hierarchical network of filaments. At scales pc, a triple, centrally condensed structure peaks toward the ring of HC HII regions in W49N. This structure extends to scales from to 100 pc through filaments that radially converge toward W49N and its less prominent neighbor W49S. The W49A starburst most likely formed from global gravitational contraction with localized collapse in a ”hub-filament” geometry. 3) Currently, feedback from the central YMCs (with a present mass M⊙) is still not enough to entirely disrupt the GMC, but further stellar mass growth could be enough to allow radiation pressure to clear the cloud and halt star formation. 4) The resulting stellar content will probably remain as a gravitationally bound massive star cluster, or a small system of bound clusters.
Subject headings:
Hii regions – ISM: individual objects (W49A,W49N,W49S,W49SW) – stars: formation – stars: massive – open clusters and associations: general – ISM: clouds – galaxies: starburst – galaxies: star clusters1. Introduction
Young massive clusters (YMCs) have stellar masses M⊙, sizescales of a few pc, and are younger than a few crossing times (a few Myr). They probably represent the young end of the so-called super star clusters (SSCs) commonly found in starbursting galaxies through high-resolution imaging with the Hubble Space Telescope (e.g., Whitmore et al., 1993; Meurer et al., 1995; Ho, 1997). It is also possible that some of them are young analogues of globular clusters (GCs), provided that they remain gravitationally bound for timescales comparable to the Hubble time. Recent reviews are those of Turner (2009) and Portegies Zwart et al. (2010).
Understanding how YMCs form is not only an interesting problem on itself, but is key to understand the properties of star forming galaxies elsewhere. In recent years there have been several studies of deeply embedded YMCs in nearby galaxies that address this problem. Some studies have targeted the progenitor giant molecular clouds (GMCs) (e.g., Keto et al., 2005; Santangelo et al., 2009; Wei et al., 2012). Johnson et al. (2001) suggested that the radio continuum sources embedded in some of these extragalactic GMCs trace the massive star content, making them analogues to ensembles of ultra compact (UC) and hypercompact (HC) HII regions embedded in the GMCs that harbor the most luminous star formation regions in the Milky Way (e.g., Ho & Haschick, 1981; Kurtz et al., 1994). However, even in nearby galaxies within 10 Mpc, subarcsecond resolution studies have physical resolutions not better than pc.
An alternative approach is to look for embedded YMCs in our Galaxy, which can be well resolved, with the disadvantage that there are only a few of them (e.g., Nguyen Luong et al., 2011; Liu et al., 2012a; Nguyen Luong et al., 2013; Fukui et al., 2013). Deeply embedded, very luminous ( L⊙) star formation regions stand out as the obvious candidates to be active YMC forming sites. W49A at Galactic coordinates , is the most luminous star formation region in the Milky Way ( L⊙, Sievers et al., 1991), embedded in one of the most massive giant molecular clouds (GMCs), M⊙ (Simon et al., 2001; Miyawaki et al., 2009). The GMC has an extent of pc, but all the prominent star formation resides in the central pc. This inner region contains the well known massive star formation regions W49 north (W49N), W49 south (W49S, southeast of W49N), and W49 southwest (W49SW, southwest of W49N). The most prominent by far is W49N, hosting the well known ring of HC and UCHIIs (Welch et al., 1987; De Pree et al., 1997) within a radius of a few pc. Part of the stellar population in W49N is already visible in the near-IR and its mass has been estimated at M⊙ (Homeier & Alves, 2005), whereas the part associated with the most compact HII regions is not even visible in the mid-IR (Smith et al., 2009a). W49N also hosts the most luminous water maser in the Galaxy (Gwinn et al., 1992). Those authors determined a direct parallax distance from Earth of kpc. This measurement has been recently improved to (Zhang et al., 2013). We use the latter value through this paper.
Several possible ideas have been given to explain the prodigious star formation in W49A. Welch et al. (1987) proposed that the double-peaked profile seen in most molecular lines toward the center of W49N is due to large-scale collapse toward the central ring of HC HII regions. On the other hand, Miyawaki et al. (1986), Serabyn et al. (1993), and Buckley & Ward-Thompson (1996) interpreted it as a cloud-cloud collision. Peng et al. (2010) showed evidence for expanding shells in the center of W49N, and proposed that these are the triggering factor for star formation in the whole region.
In this paper we introduce our Multiscale Continuum and Line Exploration of W49 (MUSCLE W49), a project aimed at mapping the W49 GMC from its full scale ( pc) down to the scales of individual star-forming cores ( pc). Multiple molecular and hydrogen recombination lines (RLs) are observed, as well as dust and free-free continuum. When we refer to ”W49” or the ”W49 GMC” we mean the full W49 giant molecular cloud, when we use ”W49A” we refer to the central part of the GMC that is actively forming YMCs. When necessary, we refer individually to the common labeling of the subcomponents of W49A: W49N, W49S, and W49SW. This paper presents the bulk of the data set and derives the mass structure of the cloud at all scales. Upcoming papers will deal with further scientific analysis: a multi-scale analysis of the dynamics, a comparison of hot cores and hypercompact HII regions using the subarcsecond resolution mosaics of W49N, and a quantitative comparison with extragalactic star formation. Section 2 and Appendix A describe the observations. Section 3 presents the data. In Section 4 we derive the mass structure of the GMC, and in Section 5 we discuss on the GMC and cluster disruption. We list our conclusions in Section 6. Appendices B and C show the rest of the line maps from the PMO and SMA observations, respectively. Appendix D describes our method to obtain the gas surface density maps using CO and its isotopologues, and to derive gas masses from the dust continuum.
2. Observations
2.1. PMO 14m
Mapping observations were made from March 2011 to July 2011 with the 14-m telescope of Purple Mountain Observatory111http://www.dlh.pmo.cas.cn/ (hereafter PMO 14m), located at Delingha, Qinghai, China. The CO and its isotopologues were observed in the 1–0 transition, as well as several other molecular lines. The observations were performed with a nine pixel SIS receiver, which was configured with dual sideband (2SB) mixers for each pixel (Shan et al., 2010). For each sideband and each pixel, fast fourier transform (FFT) spectrometers produce a bandwidth of 1 GHz and 16384 channels, resulting in a velocity resolution of 0.16 km s-1 and a velocity coverage of 2700 km s-1 at 110 GHz.
The mapping observations were carried out in on-the-fly (OTF, e.g., Mangum et al., 2007) scan mode. A position of 120′ to the north of the centre of W49A was taken as sky reference. All maps are done with uniform Nyquist sampling, except for 2 around the edges. The rms pointing uncertainty is estimated to be better than . Typical system temperatures during the runs were 140 K at 110 GHz and 270 K at 115 GHz.
All the PMO spectral line data were reduced with the CLASS/GILDAS222http://www.iram.fr/IRAMFR/GILDAS package developed by IRAM. We classify the spectral quality of each spectrum by the baseline flatness and system temperature levels. About 5% of the spectra are discarded due to poor baselines. Linear baselines are subtracted for each individual spectrum. All spectra are then co-added and re-grided.
We converted the antenna temperature () to the main beam brightness temperature () scale using , where the ratio of the main beam efficiency to the forward hemisphere efficiency is 0.46.
For each molecular line, we combined all the calibrated spectra and re-gridded them to construct datacubes with weightings proportional to 1/, where is the rms noise. This routine convolves the gridded data with a Gaussian kernel of 1/3 the telescope beamsize, yielding a final angular resolution slightly coarser than the original beam size. The HPBW at the CO frequency is 58.0″ (3.4 pc).
2.2. SMA
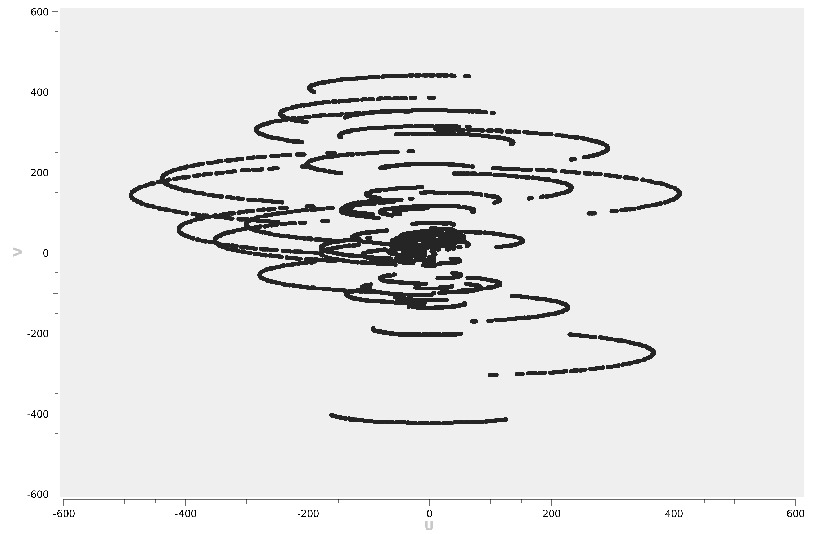
We observed the central cluster of W49A (W49N) with the Submillimeter Array333The Submillimeter Array is a joint project between the Smithsonian Astrophysical Observatory and the Academia Sinica Institute of Astronomy and Astrophysics and is funded by the Smithsonian Institution and the Academia Sinica. (Ho et al., 2004) in the 1.3-mm (230-GHz) band using the four different array configurations: subcompact, compact, extended, and very extended, one track for each. This multi-configuration approach images both small and large scales. The data set covers baseline lengths between 8 k (corresponding to scales of 31″) and 480 k (0.5″). Figure A1 (appendix A) shows the coverage of the combined data set.
The upgraded SMA correlator capabilities were used, covering GHz in each of the two sidebands. The lower sideband (LSB) covered the sky frequency ranges from 218.29 to 220.27 GHz in spectral windows 48 to 25, and from 220.29 to 222.27 GHz in spectral windows 24 to 1. The upper sideband (USB) covered from 230.29 to 232.27 GHz in spectral windows 1 to 24, and from 232.29 to 234.27 GHz in spectral windows 25 to 48. The spectral resolution of the raw data set is km s-1.
The visibilities of each track were separately calibrated using the SMA’s data calibration program, MIR444https://www.cfa.harvard.edu/ cqi/mircook.html. The phase, bandpass, and flux calibrators for each track are listed in Table 1. Imaging and basic analysis were done in CASA versions 3.3 and 3.4.
The continuum emission was subtracted in the domain by fitting a baseline across the passband using line-free channels as input. The continuum and line data of each configuration were then combined into a single data set and imaged. The concatenated continuum data was self-calibrated, then imaged with different weights, checking that the flux recovered at different resolutions was the same within a few percent. The continuum map presented in this paper is the result of the combination of the SMA mosaic with the CSO BOLOCAM GPS archival map (Ginsburg et al., 2013). The combination procedure is based on converting the single-dish map to the Fourier space, and then jointly inverting and cleaning the combined single-dish and interferometer visibilities. The 13CO and C18O SMA mosaics were also combined with single dish maps to fill the short spacings. We used the IRAM 30m maps presented in (Peng et al., 2010, 2013). The combining procedure is described in more detail by Liu et al. (2013).
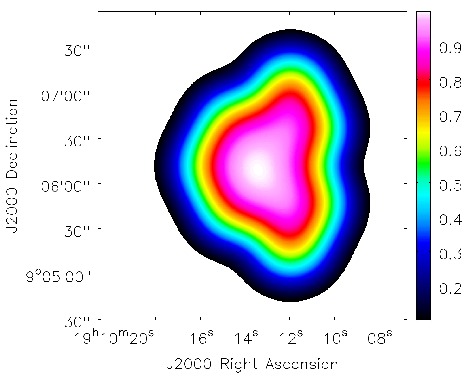
The 11-pointing SMA mosaic is Nyquist sampled and covers all of the HC HII regions detected in the cm by De Pree et al. (1997, 2004). All the presented SMA mosaics have been corrected for primary-beam attenuation. Figure A1 (appendix A) shows the primary-beam response of the mosaic used to correct for attenuation in the final images.
Archival maps from JCMT-SCUBA555The James Clerk Maxwell Telescope is operated by the Joint Astronomy Centre on behalf of the Science and Technology Facilities Council of the United Kingdom, the Netherlands Organisation for Scientific Research, and the National Research Council of Canada. at 678 GHz (project code M97Bu89) and the Very Large Array666 The National Radio Astronomy Observatory is a facility of the National Science Foundation operated under cooperative agreement by Associated Universities, Inc. at 8.5 GHz (project code AD324) are also used in this paper. We refer the reader to Di Francesco et al. (2008) and De Pree et al. (1997) for the respective observational details.
3. Presentation of the data
We present the data zooming in from large to small scales.
3.1. The W49 Giant Molecular Cloud
3.1.1 CO 1–0 and isotopologues
The largest-scale maps are those obtained with the PMO 14m telescope in CO and its isotopologues 13CO and C18O. These maps cover the entire W49 GMC with up to 37′ (119 pc) per dimension. Figure 1 shows the velocity-integrated (moment 0) CO emission maps. This emission covers the LSR velocity range from km s-1 to km s-1. Outside this range (up to km s-1) there are more CO spikes. Their line profiles are narrow and their emission cover the entire mapped area without matching the features from the W49 GMC. We infer that they are clouds in the line of sight not associated with W49.
The CO maps show the well-known central gas clump in the inner 3′, known as W49 North (W49N). It is in this region where the central embedded cluster with dozens of massive stars as traced by radio-continuum hypercompact (HC) and ultracompact (UC) HII regions reside (De Pree et al., 1997, 2004). The central W49N clump appears connected to the W49 GMC via a series of filamentary extensions (see Fig. 1). These filaments are hinted in previous observations where they appear as protuberances out of W49N toward the southwest, the east-southeast, and the north (see, e.g., fig. 2 of Nagy et al. 2012, or fig. 6 of Matthews et al. 2009). The southeast filament connects W49N to W49 South (W49S) located 2′ apart, and which hosts a cometary HII region (Dickel & Goss, 1990).
The spectrum from the W49 GMC has towards its position centroid two prominent velocity features. Figure 2 shows the CO spectra toward the moment 0 peak. The optically thick 12CO is too complex to be fitted with a small number of Gaussians. The isotopologues are well fit by a sum of three Gaussian components. The kinematics of the full GMC and its relation to smaller scales will be the topic of a following paper.
3.1.2 Other molecules and hydrogen
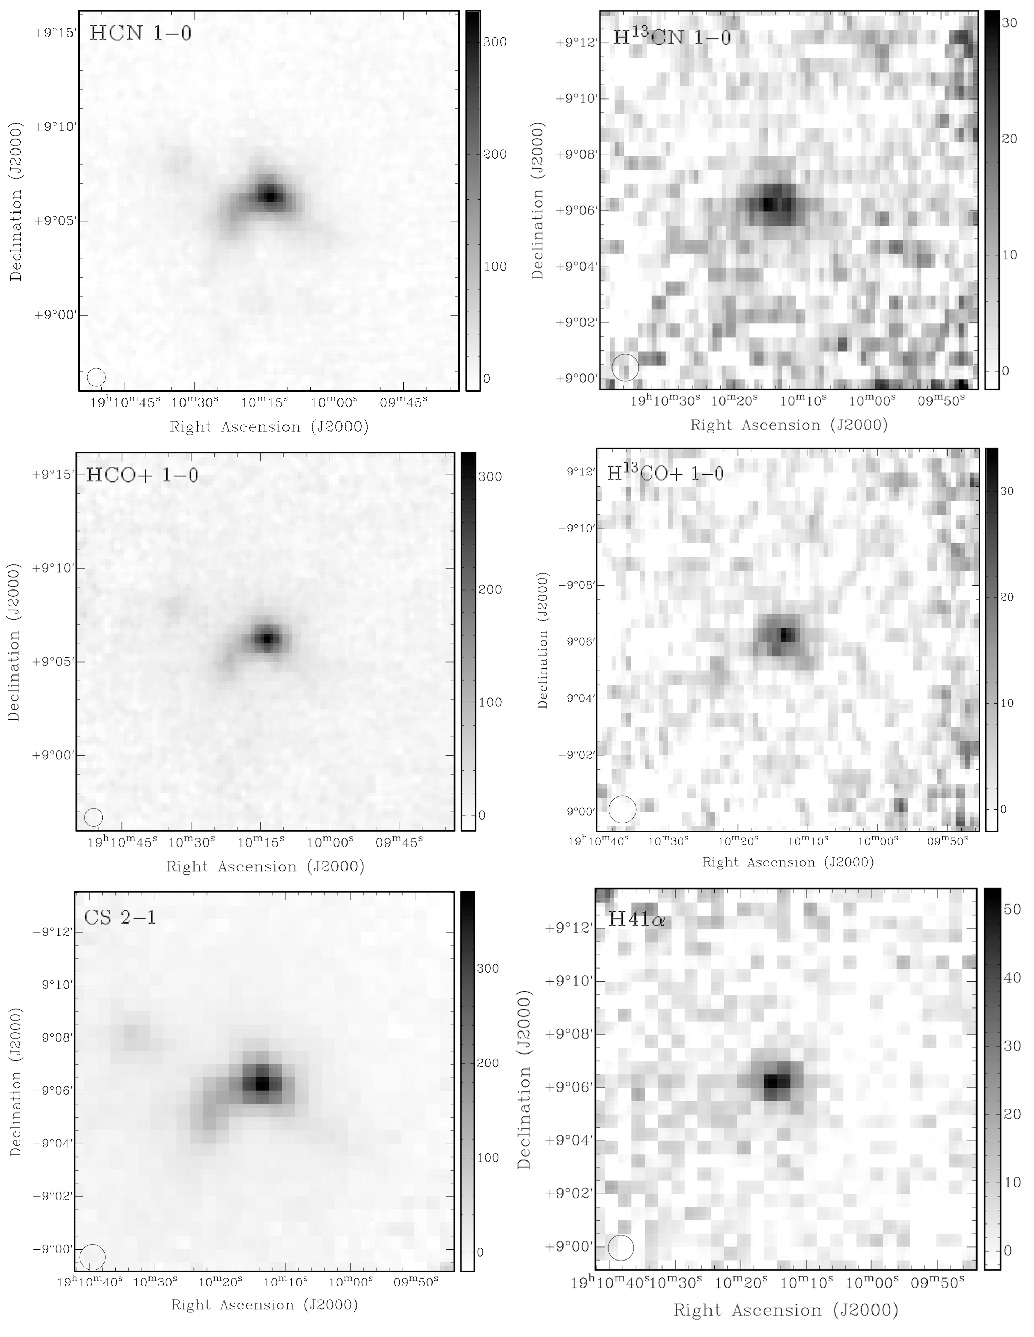
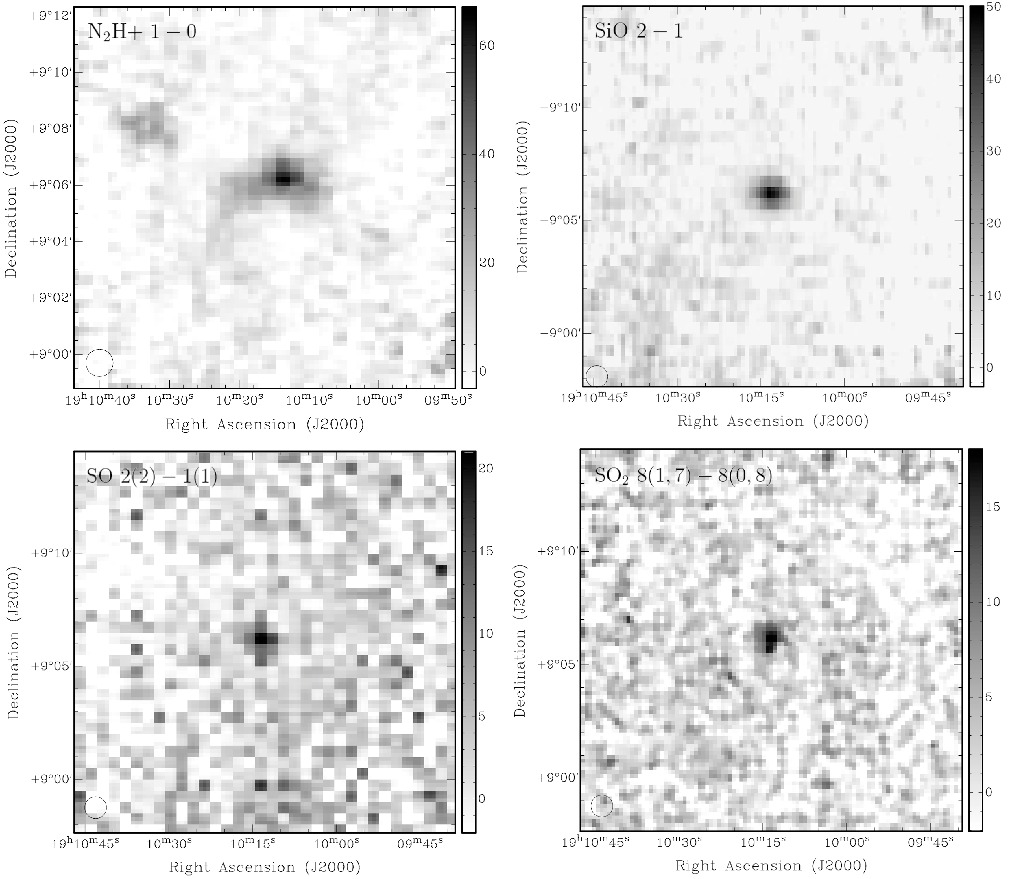
Figures B1 and B2 in Appendix B show the moment 0 (integrated from km s-1 to km s-1) of the rest of the molecules clearly detected in the PMO 14m observations, as well as of the hydrogen recombination line (RL) 41. Figures 3 and 4 show their respective spectra at the integrated-emission peak. All the transitions peak at the same position within a few arcseconds, a fraction of the beam. Table 2 lists all the lines detected with PMO and their velocity-integrated fluxes spatially integrated over the projected area of the GMC. The intensity conversion factor at the rest frequency of the CO 1–0 is 0.027 K per Jy beam-1.
Table 3 gives the parameters obtained from Gaussian fitting to the cloud components for the different line tracers. The bright (peak amplitude K) lines of HCN 1–0 and CS 2–1 follow the CO isotopologues in having at least two clear velocity features peaked at km s-1 and km s-1 (the first peak of the CO-isotopologues is at km s-1). The bright HCO+ 1–0 appears to have its two components slightly blueshifted to 2 and 11 km s-1 respectively. The faint isotopologues H13CN 1–0 and H13CO+ 1–0, as well as the N2H+ 1–0, also have two components but their parameters have larger uncertainties. The SiO 2–1, SO 2(2)–1(1), and SO2 8(1,7)–8(0,8) were best fit by a single Gaussian. The signal-to-noise in the latter two is too low to distinguish two Gaussians. The ionized hydrogen as traced by the H RL appears single peaked at km s-1. As expected, this line is far broader than the molecular lines (FWHM km s-1).
Although we use several Gaussians to quantify the line features, we do not interpret them as evidence for separate clouds. From the CO spectra it is clear that most of the double-peaked feature is caused by self absorption due to the very high column densities in the line of sight to the cloud center and around km s-1. This is confirmed by our calculations to create the surface density maps of Section 4.1. However, there is also a velocity gradient across W49N that contributes to create the line asymmetry.
3.2. The Scale of the Central Clusters: W49N and W49S
At the center of the W49 GMC lies the well known massive star formation region W49A, the most luminous in the Milky Way. W49A has two main clusters separated by ( pc): W49N (the most prominent with dozens of deeply embedded (possibly still forming) O-stars as traced by UC and HC HII regions De Pree et al., 1997), and W49S (to the southeast). These scales are mapped at subarcsecond angular resolution, but with sensitivity to scales as large as with the all-configuration SMA mosaic covering the inner . The continuum mosaic, as well as the 13CO and C18O 2–1 mosaics are combined with single-dish maps to recover the missing extended emission. Archival single-dish (sub)mm maps, as well as Very Large Array (VLA) cm maps that cover both W49N and W49S are also used.
3.2.1 The Continuum Emission
Figure 5 top shows the archival CSO BOLOCAM Galactic Plane Survey image (Aguirre et al., 2011; Ginsburg et al., 2013) at 1.1 mm of the central pc of the W49 GMC. It covers W49N, W49S and filamentary extensions in between and toward them. The total flux in the BOLOCAM image is 101.0 Jy.
It is known that HC and UC HII regions can have rising spectral indices (, where the flux ) in their free-free emission from cm- all the way up to mm wavelengths, with values . This is due to their high densities and non-zero optical depths (Keto et al., 2008; Galván-Madrid et al., 2009; Peters et al., 2010b). Therefore, to obtain dust masses when young HII regions are present it is necessary to subtract the free-free contribution to the mm flux. We use the 3.5-cm (8.5 GHz) and 7-mm (45.5 GHz) VLA data presented by De Pree et al. (1997, 2004) to separate the total ionized-gas emission from the total dust emission. The 3.5-cm map covers both W49N and W49S and matches the BOLOCAM map. The 7-mm map covers only W49N where most of the HC sources reside. The total free-free flux at 8.5 GHz is 29.7 Jy. The compact sources have an effective , and contribute with 4.4 Jy of flux at 7 mm and 3.2 Jy at 3.5 cm, only 11% of the total flux at the larger wavelength. We take an effective for the free-free flux from 3.5 cm to 1 mm. Therefore the contributions at 1 mm are free-free, and dust (71.3 Jy in the BOLOCAM map). Feasible values of the effective of the compact+extended emission are limited between -0.1 (optically thin emission) and 0.1 (a few compact sources may be outside W49N), then the limits to the dust contribution at 1 mm are 58% to 79%.
We now proceed to estimate the total gas mass in the central clusters (W49N+W49S) from the dust emission. For this we use equation D6 of Appendix D and a gas-to-dust mass ratio of 100. Studies of the SED of W49N from the mid infrared to the millimeter have found dust temperatures from 20 K to 50 K (Ward-Thompson & Robson, 1990; Sievers et al., 1991). We assume an effective K. For in the extremes of the above mentionted range, the derived masses change by about and . However, the main uncertainty in deriving masses from dust emission comes from the assumed dust absorption coefficient . For high-mass star formation regions, values in the range from 0.1 to 0.5 cm2 g-1 (per unit mass of dust) at 1.1-mm are appropriate (Ossenkopf & Henning, 1994; Galván-Madrid et al., 2010; Beuther et al., 2011). The total gas mass that we obtain from 1-mm dust emission is to for K. The lower end of this estimation (higher dust opacity) agrees with the CO measurements presented in Section 4. The estimations are also within the range of values obtained by Nagy et al. (2012) and Peng et al. (2013).
Figure 6 shows an archival JCMT-SCUBA map at 678 GHz (0.4 mm) of the central clusters W49N+W49S. The angular resolution of this map is 8.1″, intermediate between the combined SMA+BOLOCAM and the BOLOCAM images. Because dust is so much brighter at higher frequencies, this map is sensitive enough to image the filamentary structures joining W49N to W49S, and extending to the southwest (sometimes called W49SW), southeast, and north. The magnetic field in W49 has been detected by Curran & Chrysostomou (2007) using polarized submillimeter dust continuum emission. The plane-of-the sky magnetic field is relatively weak (less than 0.1 mG) and well aligned along the filament joining W49N to W49S. In the rest of the paper we show that the filamentary structures are also seen in CO integrated intensity and column density maps, and that continue all the way up to the scale of the full GMC ( pc).
The dust mass can be independently derived from the 0.4 mm emission. Note that at 678 GHz and for K we are completely out of the Rayleigh-Jeans regime (), so we have to use the full Planck function as in equation D6. At this wavelength there is no significant contribution from free-free, and the values of the dust absorption coefficient at shorter wavelenghts are less sensitive to the properties of dust (e.g., see Fig. 5 in Ossenkopf & Henning, 1994). From Ossenkopf & Henning (1994), we consider the range of values for coagulated dust grains without thick ice mantles, 6.5 to 9.8 cm2 g-1. Then the flux in the 0.4-mm map Jy corresponds to a gas mass to M⊙.
We now describe the features of the high angular resolution SMA+BOLOCAM mosaic of W49N (figure 5 bottom, covering the region marked by contours in Figure 5 top). The combining procedure is based on creating a visibility data set from the single-dish map that then is combined with the interferometer visibilities, fourier-transformed back to the image plane, and jointly cleaned, as described in Liu et al. (2012b, 2013). The combined SMA+BOLOCAM map has an angular resolution of . The subarcsecond resolution dust maps from the SMA mosaic only, which do not recover the extended emission but are sharper will be discussed along with the subarcsecond resolution SMA line mosaics in a future article. In this paper we focus on the mass structure of the W49N cluster as a whole.
To quantify the structure in the SMA+BOLOCAM continuum map, we prefer to measure the total mass in the maps above a series of intensity (mass surface density) thresholds, rather than trying to extract sources using source-finding algorithms. The reason is that these algorithms tend to artificially fragment the emission (Pineda et al., 2009). If one acknowledges the fact that the ISM is hierarchical at all scales (except possibly at pc where structures will end up forming a single star/binary system), it follows that trying to count sources is not very meaningful. We created masked maps with intensities mJy beam-1 and 320 (the peak in the map is 3.302 Jy beam-1) and measured their total flux. The positive contour in Figure 5 bottom is at 25 mJy beam-1. Table 4 lists the results. The quoted values for surface densities and dust-derived masses correspond to cm2 g-1, and the errors to the results from varying from 0.1 to 0.5 cm2 g-1. As mentioned before, variations in introduce an extra uncertainty (see Appendix D for details). We have subtracted a free-free contribution of 101010As derived before, the total free-free contribution in the entire VLA map is . Within the area of the SMA+BOLOCAM map (W49N), an estimation of the free-free contribution under the same assumptions gives ..
3.2.2 The Line Emission
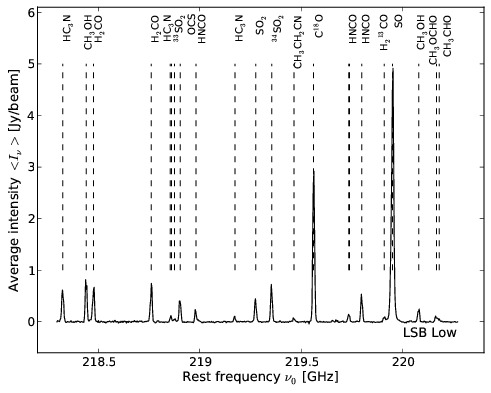
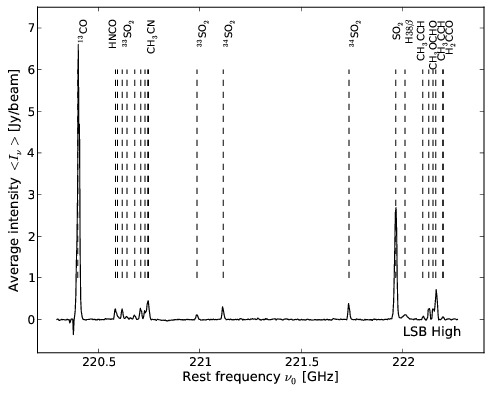
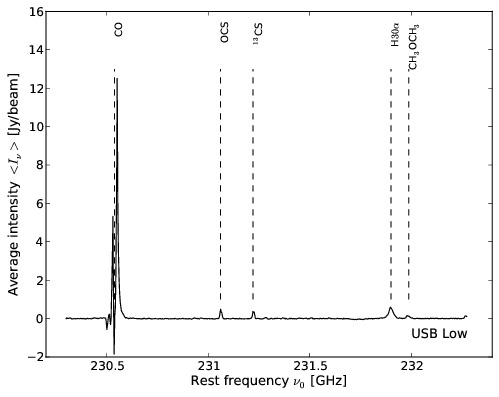
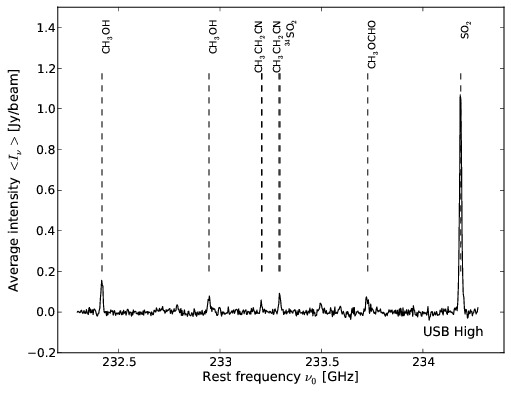
To identify the spectral features we first imaged the full bandwidth covered by the SMA using the subcompact array data only. Figure 7 shows these spectra spatially-averaged in a contour matching the 1.3-mm continuum shown in Figure 5, bottom. The molecules/atoms producing the line emission are labeled. The details on the species, transition, rest frequency, and upper-level energy are listed in Table 5. All the 57 lines that were clearly identified (including some blended features) above an intensity threshold of 50 mJy beam-1 are listed. Many of the detected lines are typical ’hot-core’ tracers characteristic of luminous star formation regions (e.g., Kurtz et al., 2000; Cesaroni et al., 2010; Beltrán et al., 2011), although W49A appears to be less line-rich than its cousin Sgr B2 near the Galactic Center (e.g., Nummelin et al., 1998; Belloche et al., 2013). We have unambigously identified 40 individual lines, plus 14 lines that are clearly identified but their profiles are blended (e.g., the CH3CN and lines whose centers are only separated by only 5.7 km s-1). Three more identified lines possibly have significant contamination (see Table 5).
W49A appears to be rich in SO2 and its isotopologues. Younger massive star formation regions devoid of ionization or with only faint HII regions tend to lack emission in these lines (e.g., Galván-Madrid et al., 2010; Liu et al., 2012a), whereas regions in which O-stars have already formed and with HC and UC HII regions tend to be brighter in the SO2 lines in this band (e.g., Galván-Madrid et al., 2009; Baobab Liu et al., 2010).
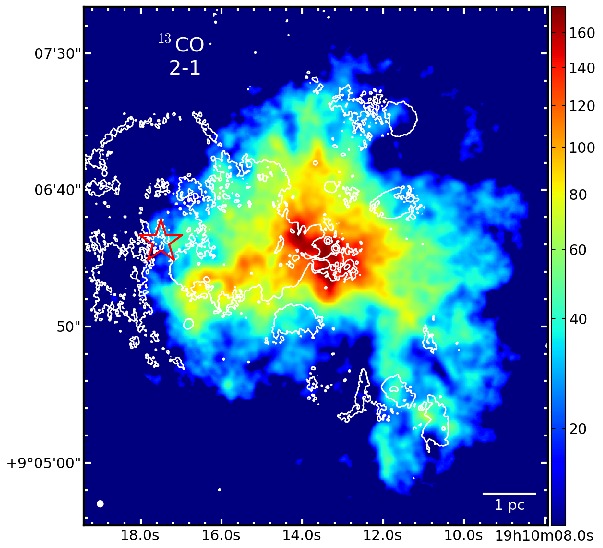
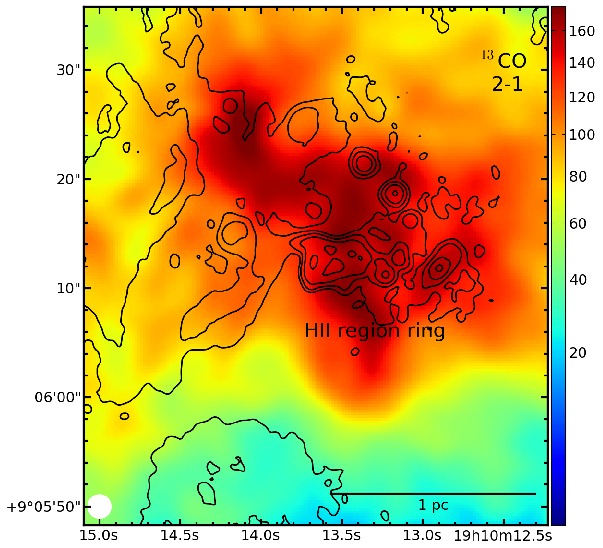
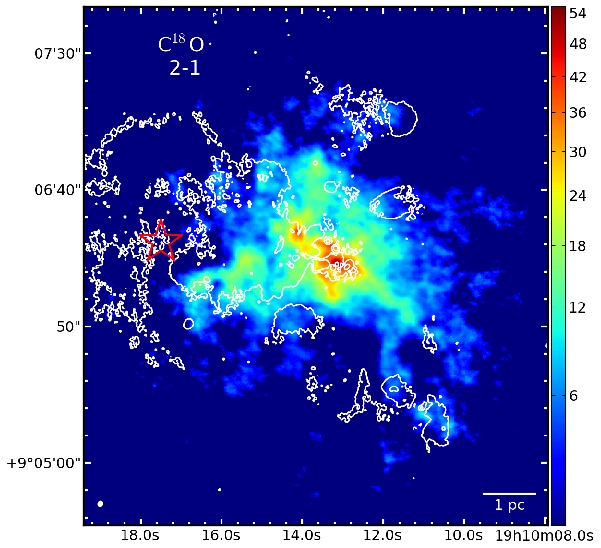
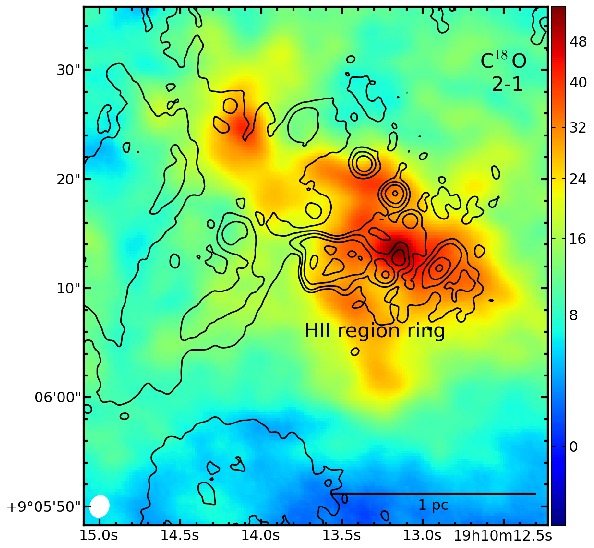
After line identification, individual line cubes with the all-configuration SMA data were created. The synthesized beam of these maps varies smoothly from , PA at the lowest frequency (36.4 K per Jy beam-1) to , PA at the highest (31.5 K per Jy beam-1). The resolution of the final maps was chosen such that nearly all of the flux of the subcompact-array maps is recovered but at the highest-possible angular resolution. The CO, however, is affected severely by missing flux in interferometric observations. We have therefore combined the multiconfiguration SMA maps with IRAM 30m maps for the 13CO 2–1 and C18O 2–1. Figure 8 shows the velocity-integrated (moment 0) of these two CO isotopologues. As with the larger-scale PMO data, the emission has been integrated in the LSR velocity range from km s-1 to km s-1. The angular resolution of the single-dish+interferometer maps is .
A striking feature of the SMA+IRAM30m maps is that the radially-converging, triple filametary structure seen at the full GMC scales (from to 100 pc) as traced by the PMO maps (section 3.1) is preserved all the way down to the inner few pc. In Section 4 we discuss in more detail the morphological matching between these structures and its physical interpretation. Their dynamics will be discussed on a following paper.
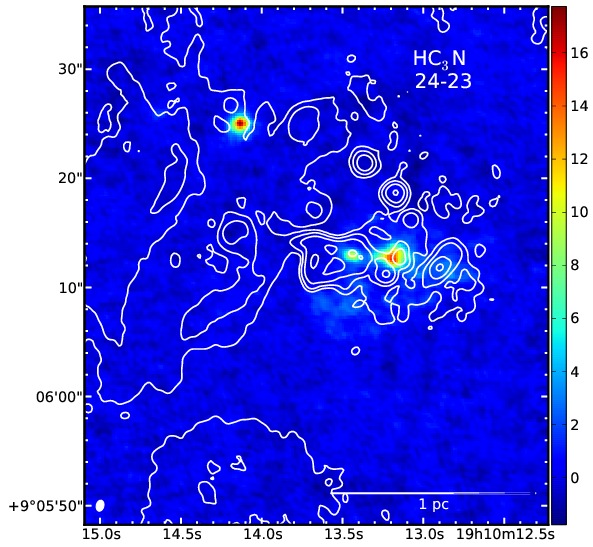
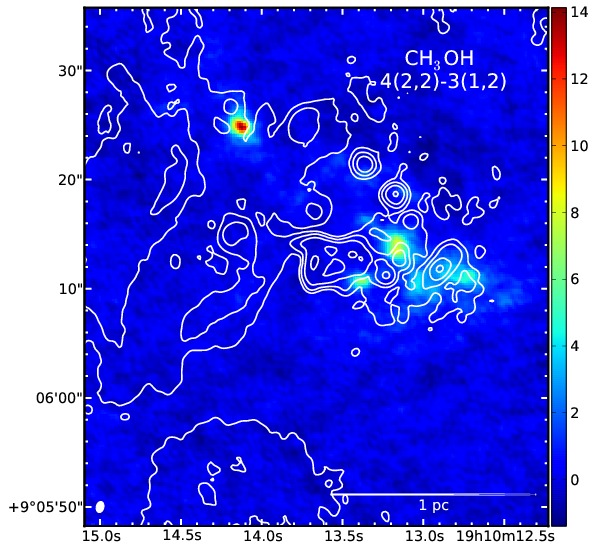
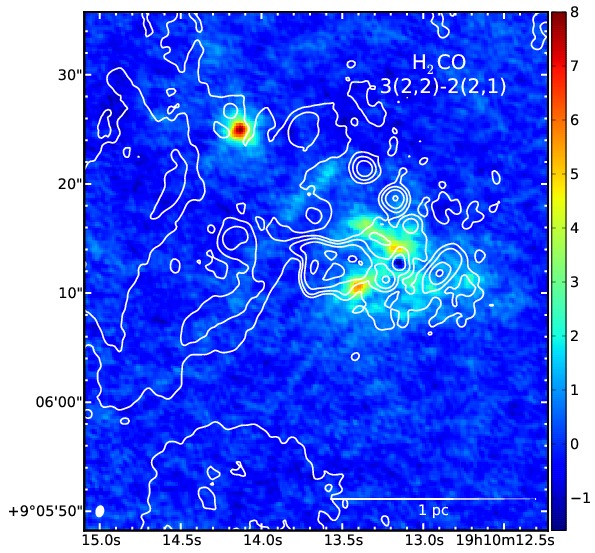
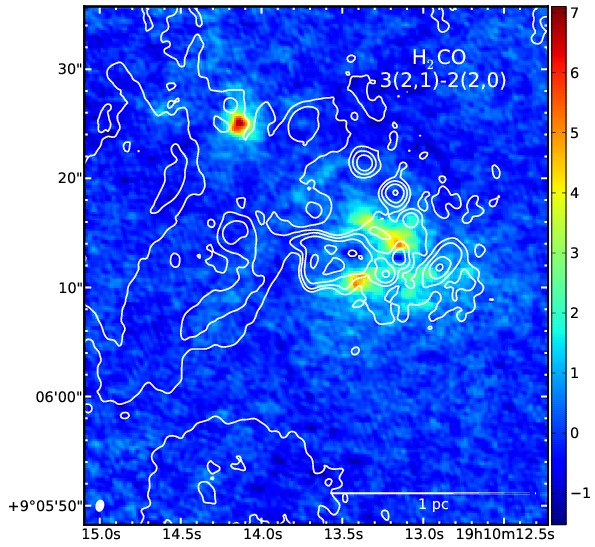
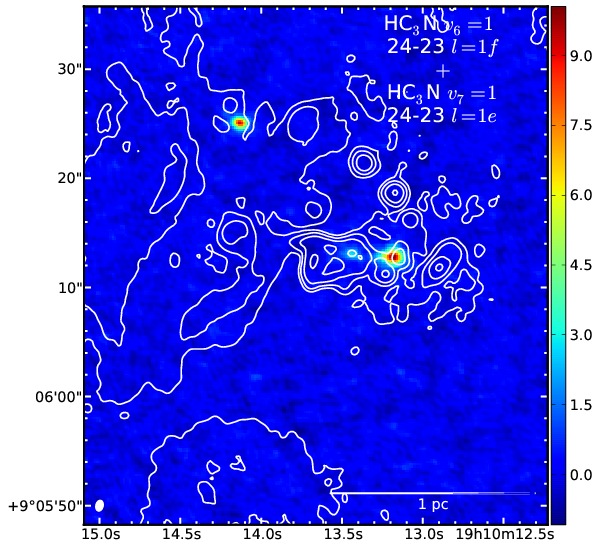
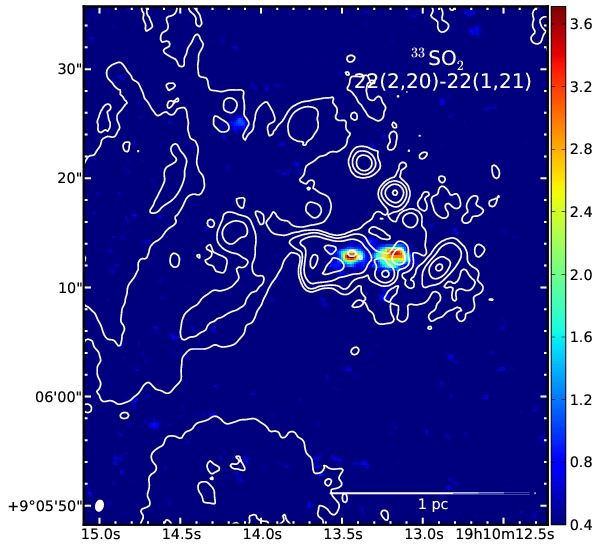
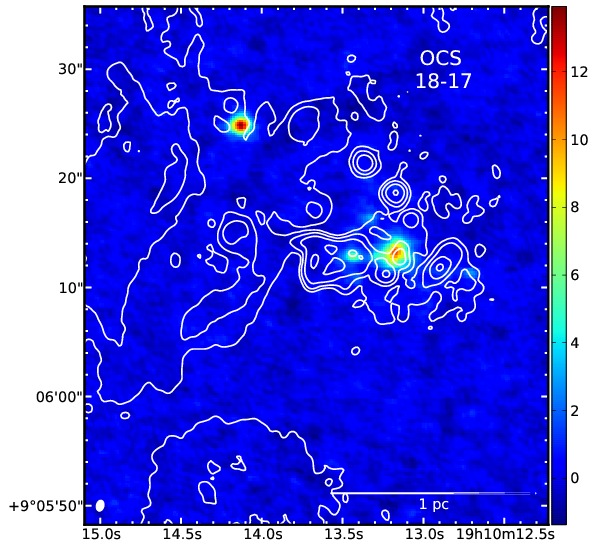
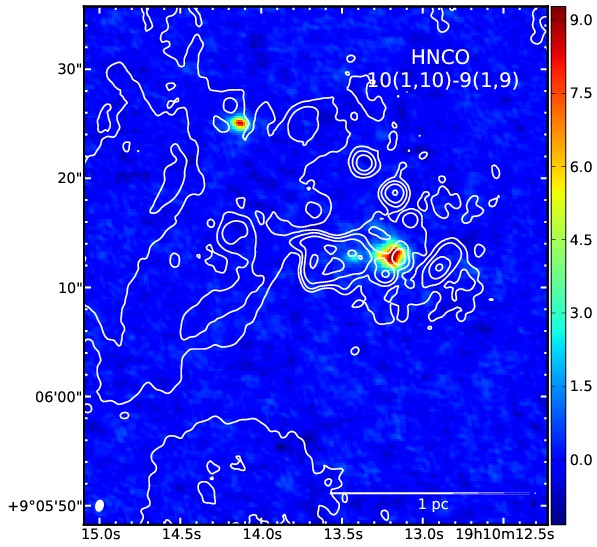
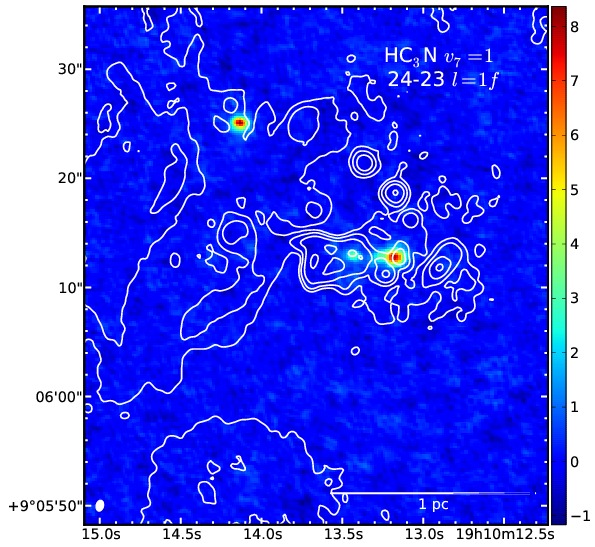
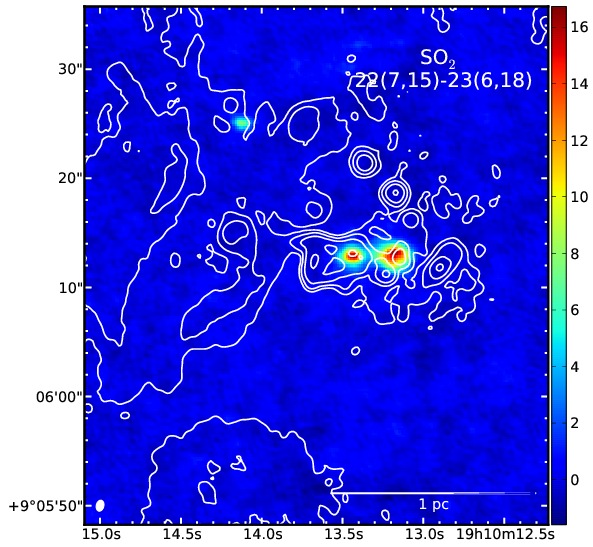
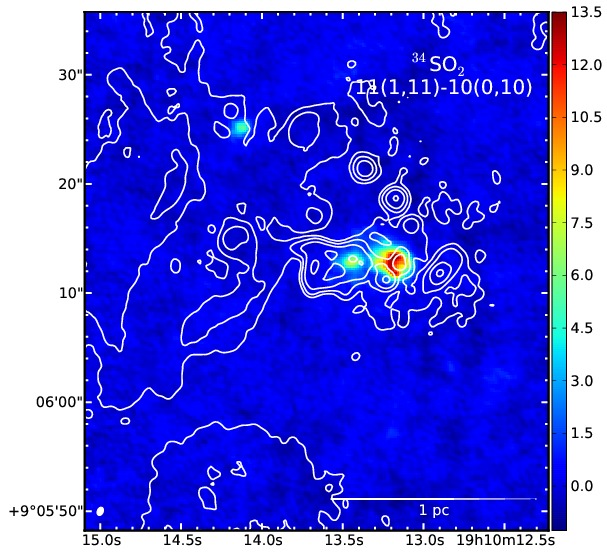
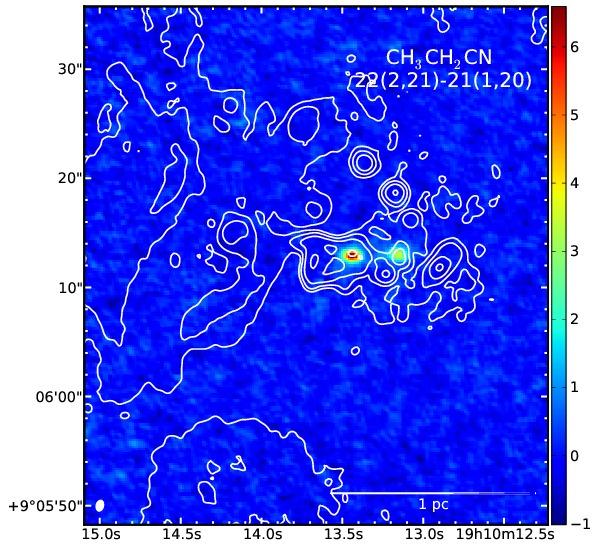
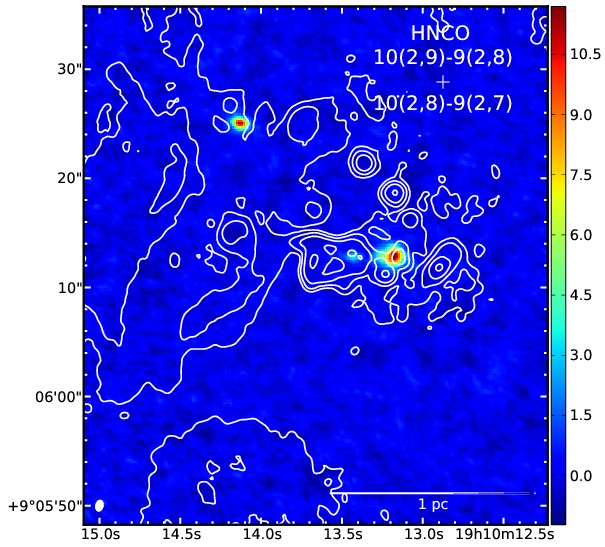
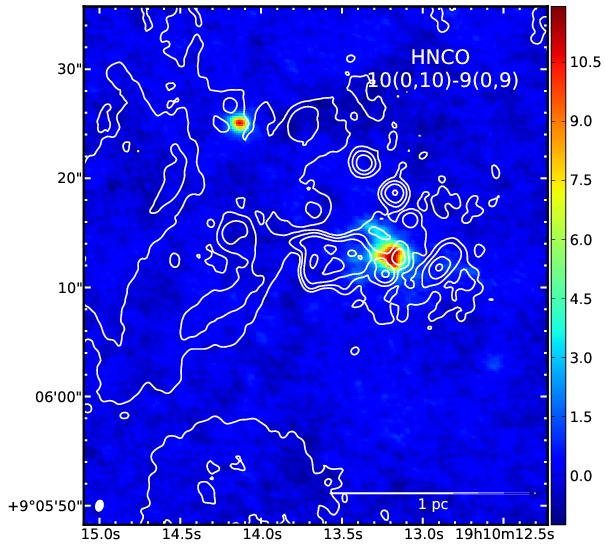
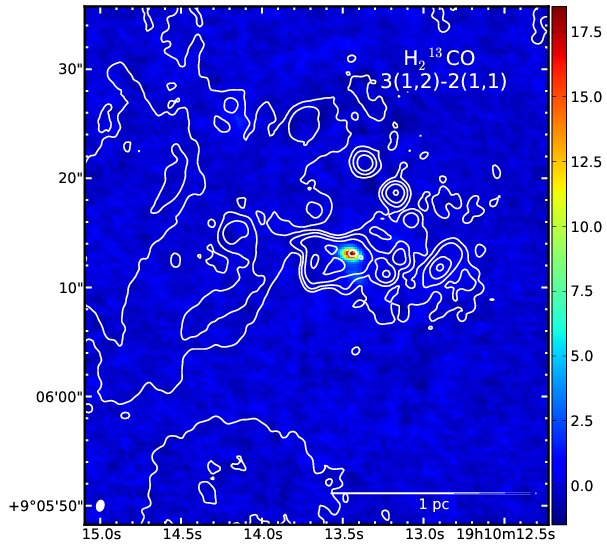
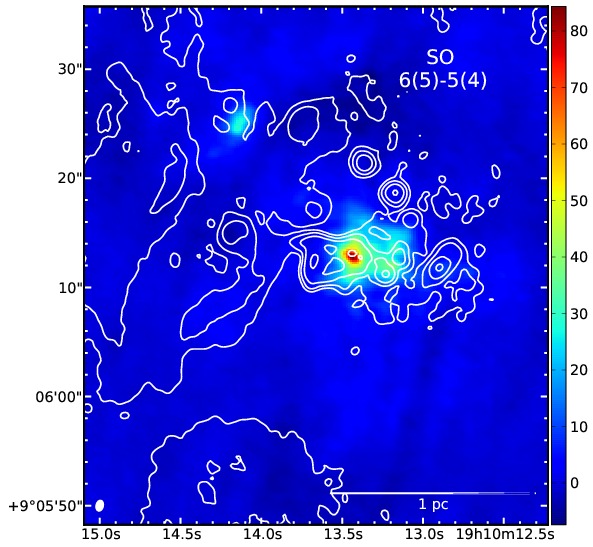
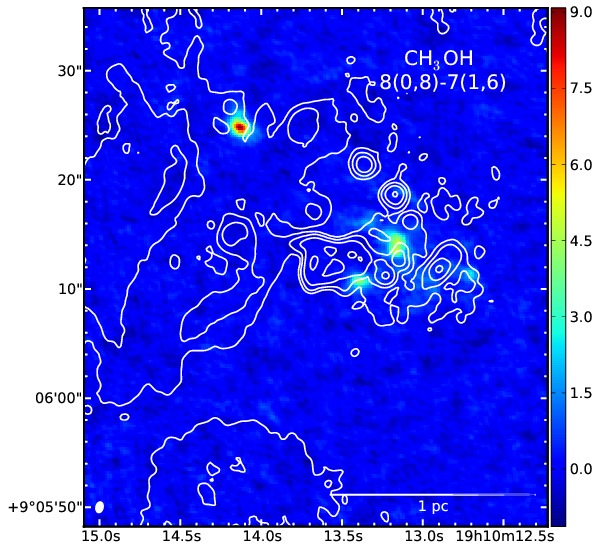
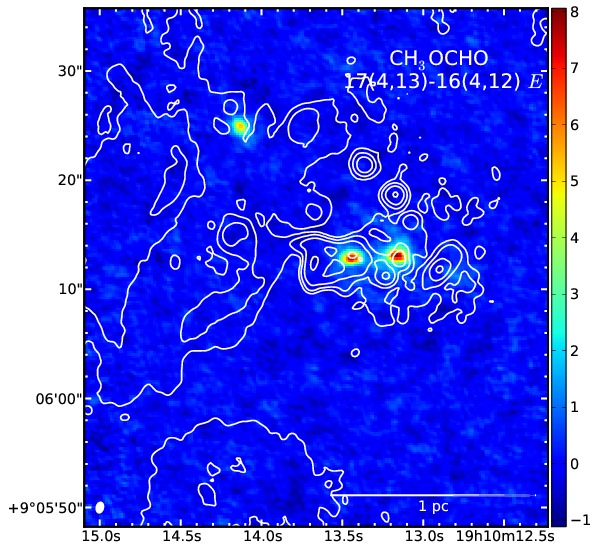
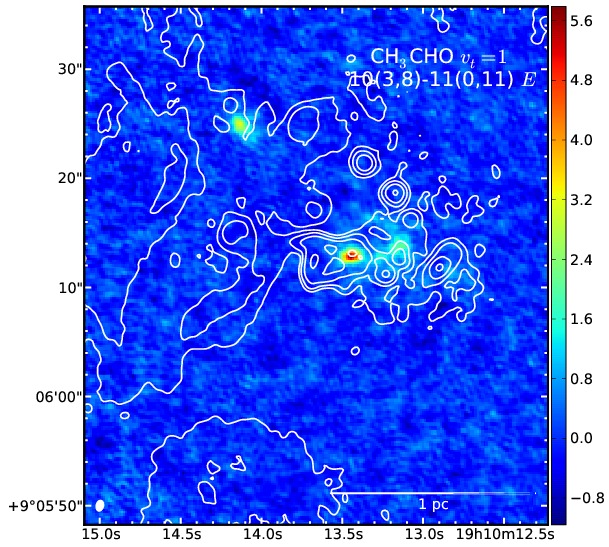
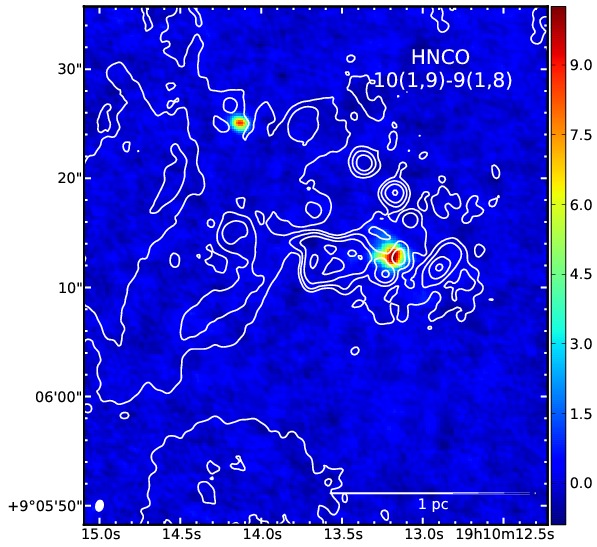
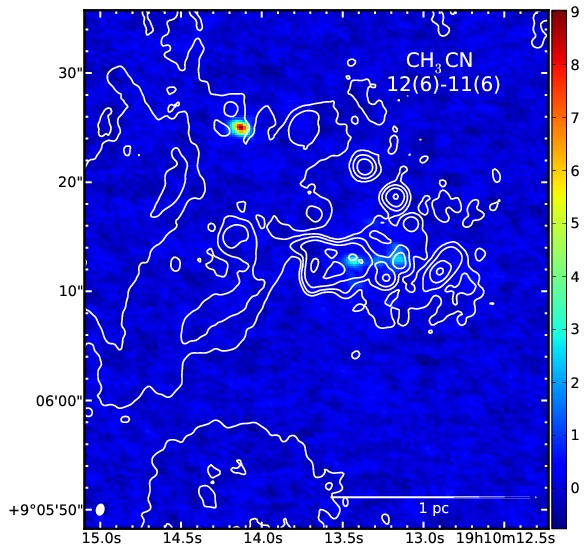
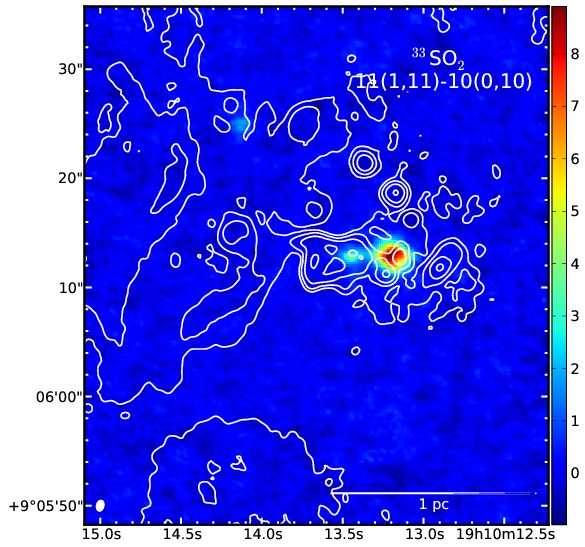
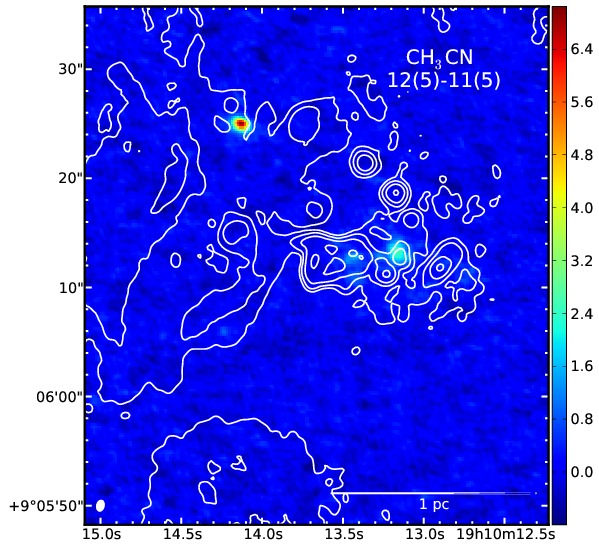
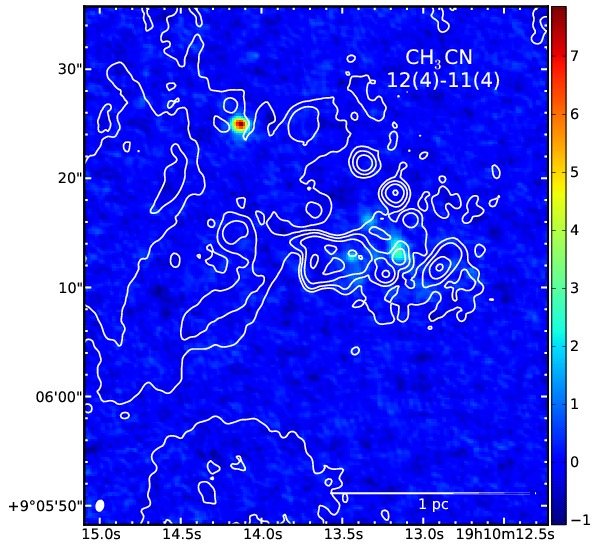
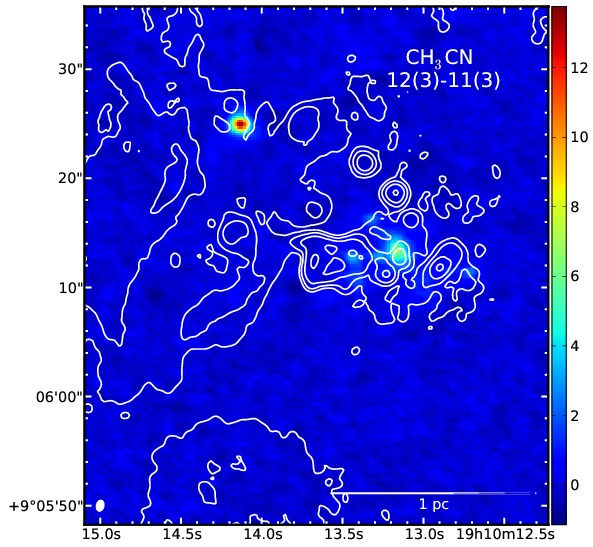
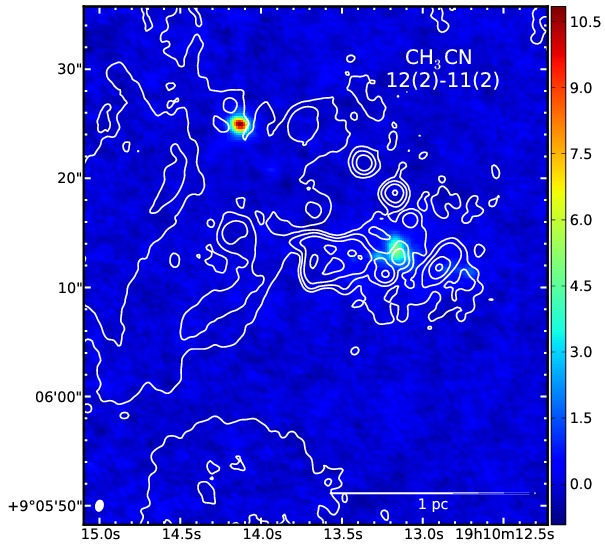
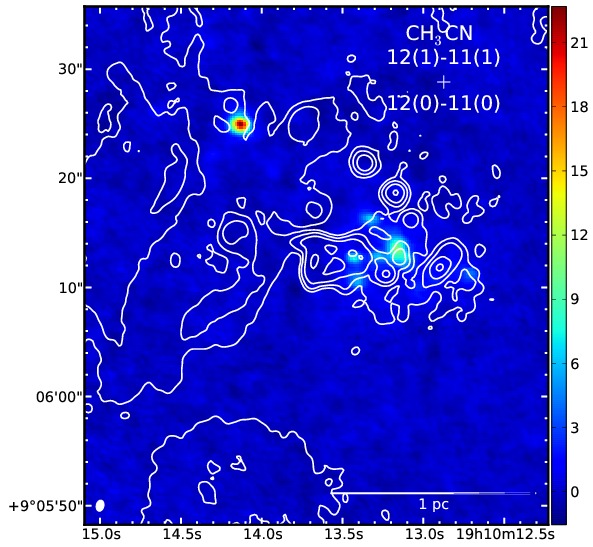
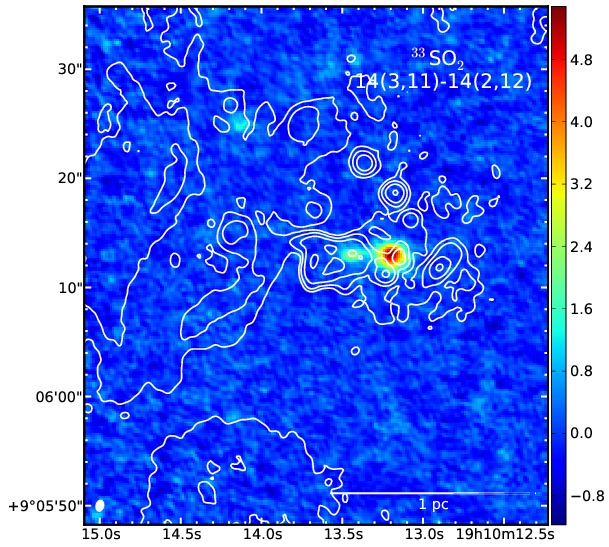
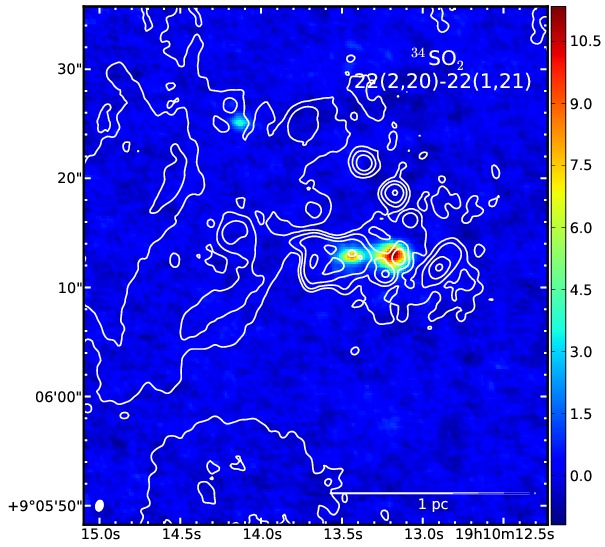
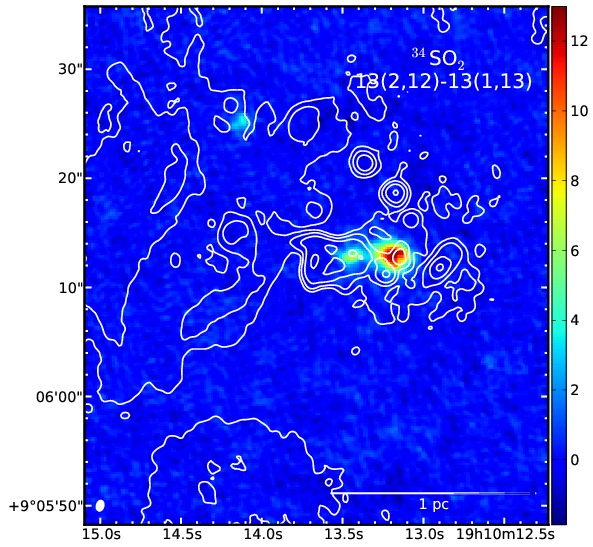
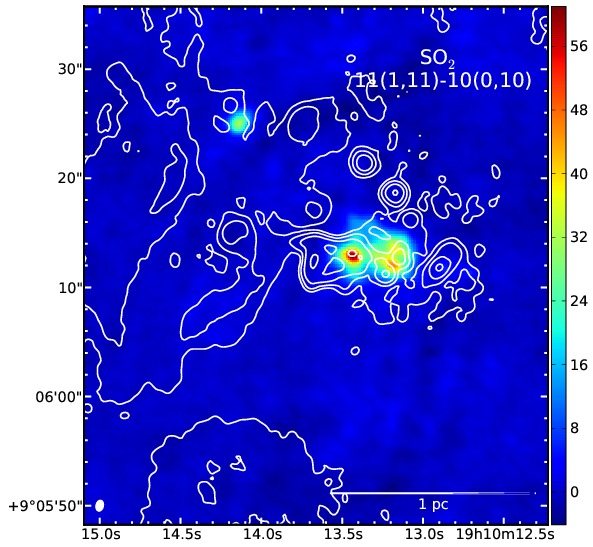
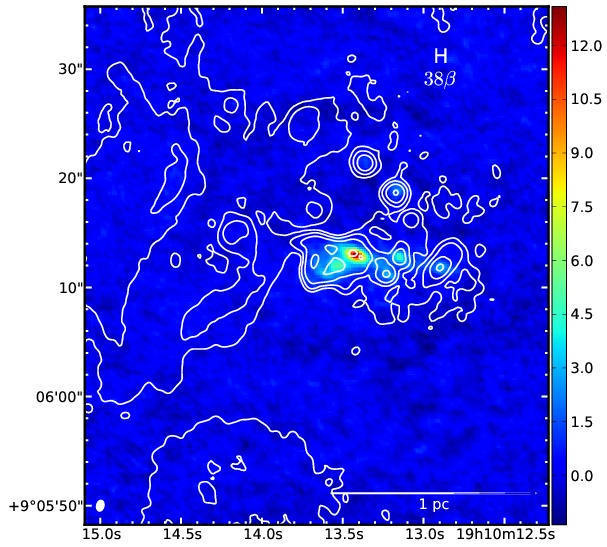
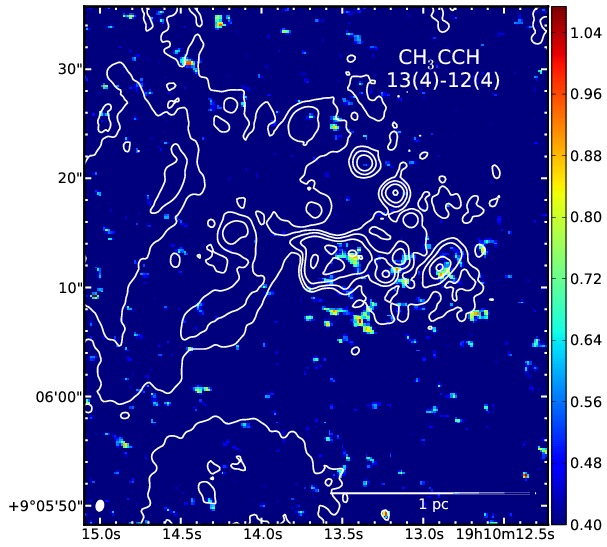
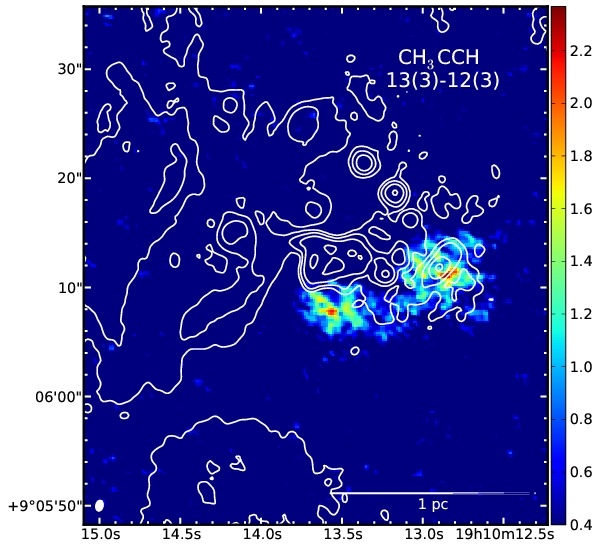
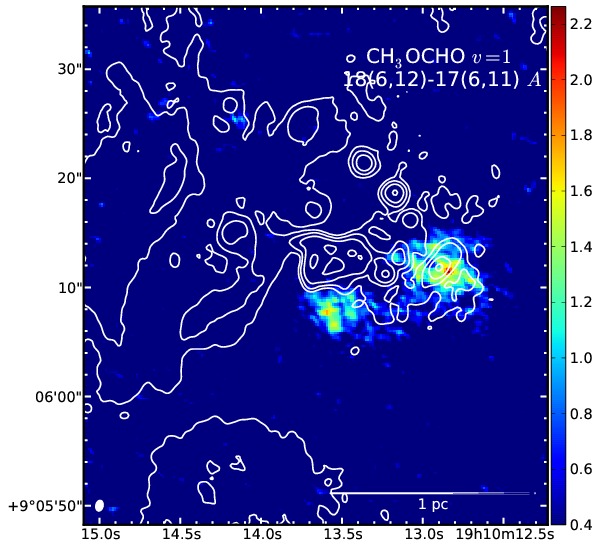
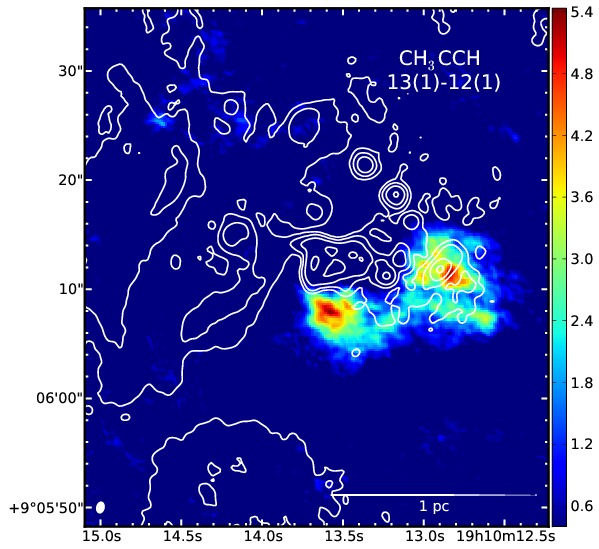
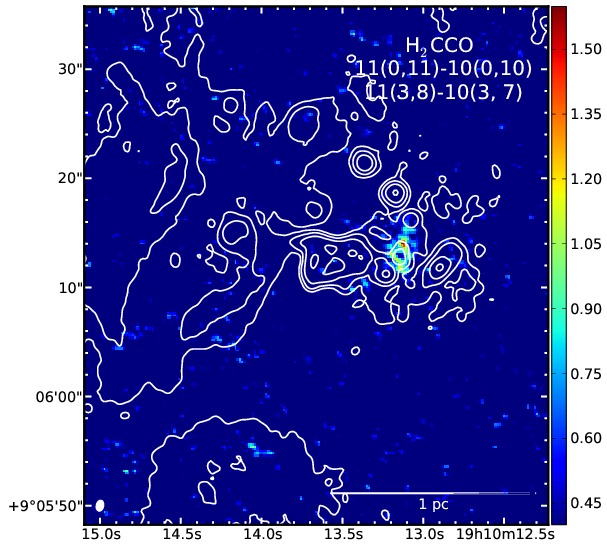
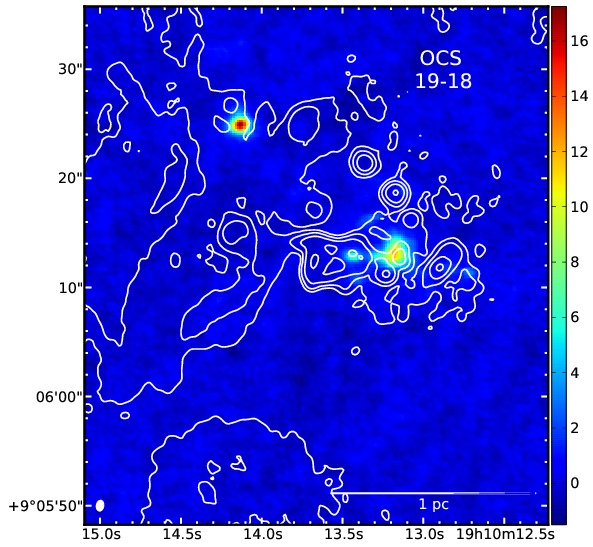
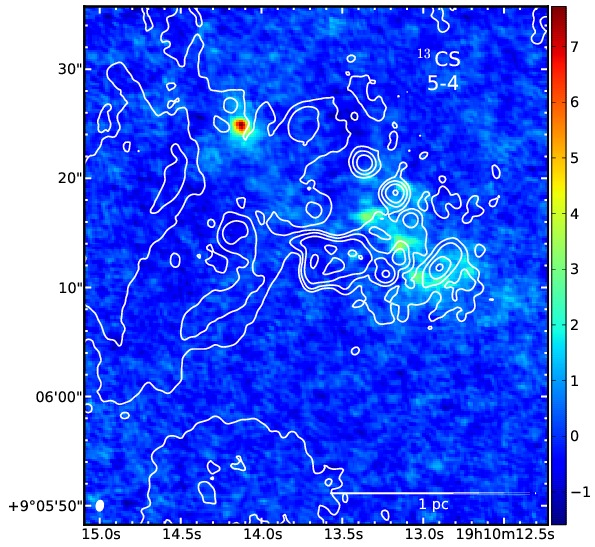
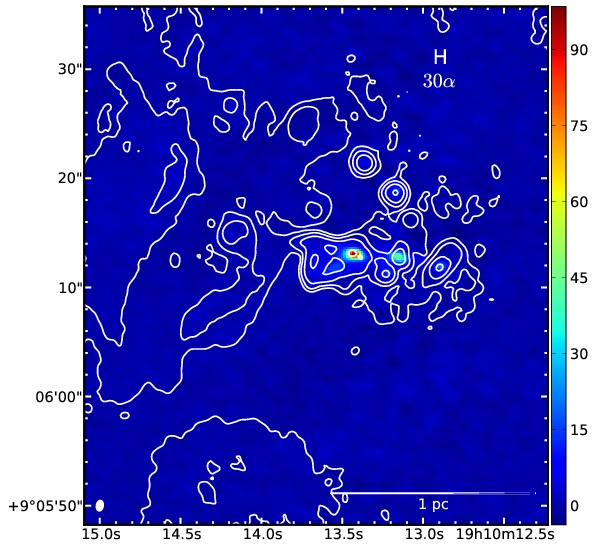
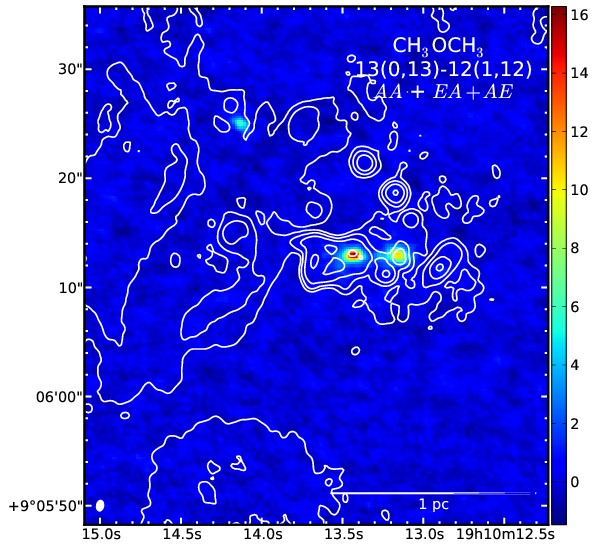
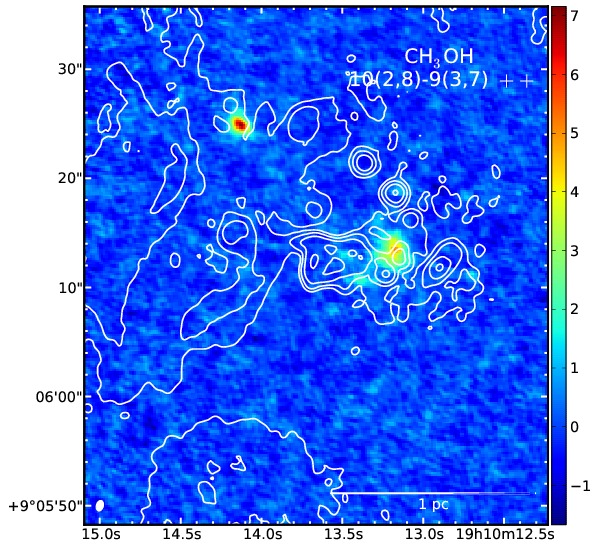
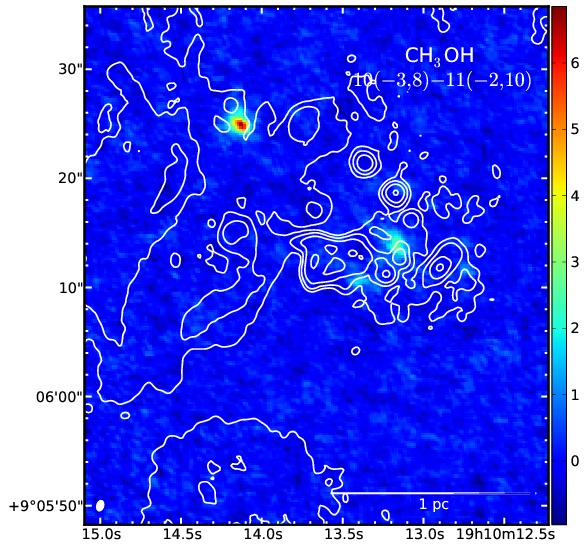
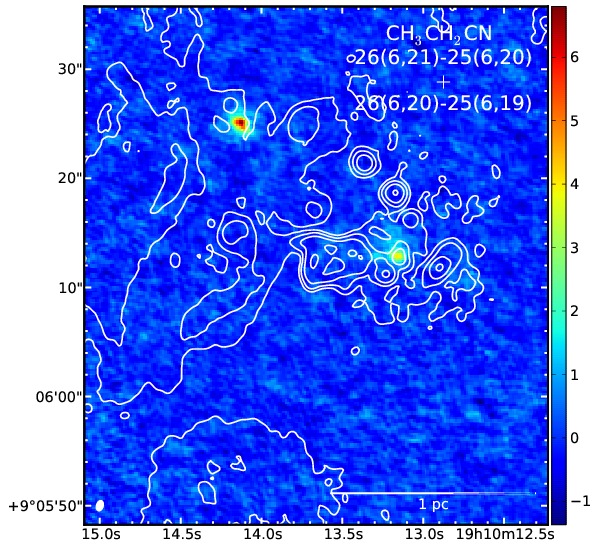
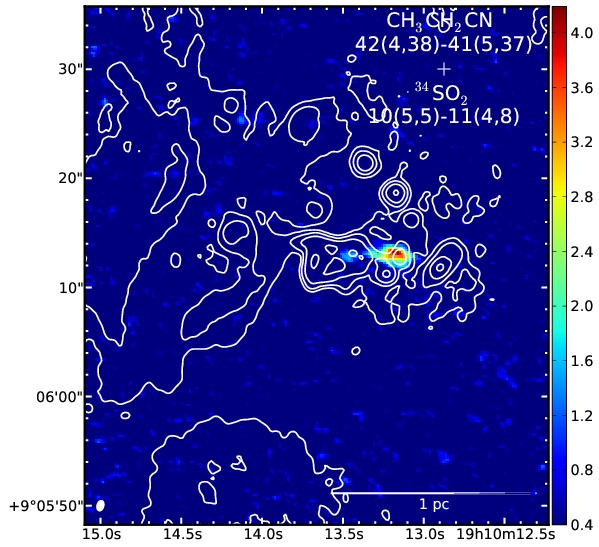
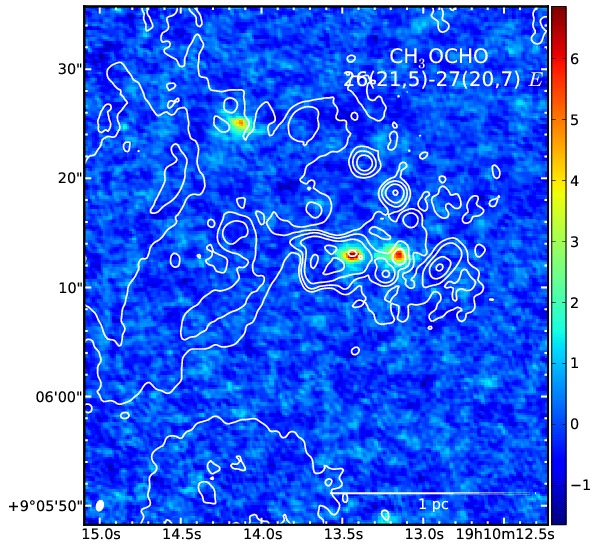
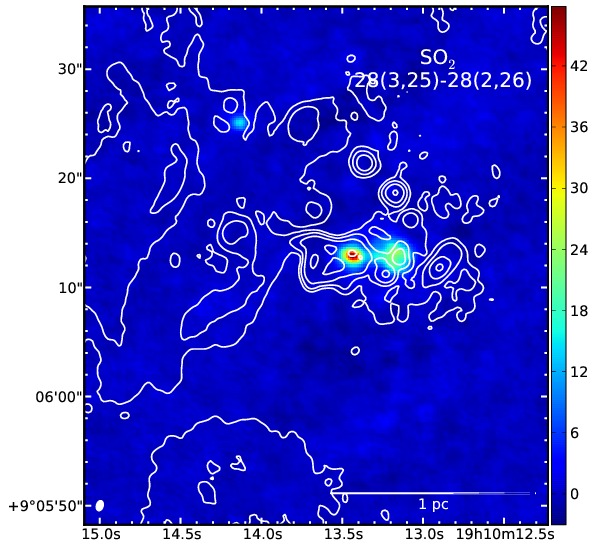
Appendix C (on-line only) shows the velocity-integrated (moment 0) line emission of all the SMA-detected lines listed in Table 5. A single map is shown for neighbouring lines whose profiles are blended. The last column of Table 5 lists the velocity-integrated line fluxes. For the science discussion of this paper (sections 4 and 5) we use the combined SMA+IRAM 30m CO maps together with the dust maps and the larger-scale PMO CO maps to make a study of the mass of the W49 GMC as a function of scale.
4. The mass structure of the W49 GMC
4.1. Mass surface density maps
We calculate maps of the mass of the GMC from scales of pc to pc using the PMO CO maps on the larger scales and the SMA+IRAM 30m CO maps on the smaller scales. The methodology is described in Appendix D, and it is based on solving for the optical depth in every voxel of data from the CO-isotopologue ratios. Uncertainty in this mass determination comes from uncertainties in the isotopologue abundances (typically ), in the CO to H2 conversion factor, and in the assumed excitation temperature (typically ). All added up, masses are uncertain within a factor of 2 each way (see Appendix D). Figure 9 shows the resulting maps of molecular-gas surface density in units of M⊙ pc-2. We derive a total mass for the GMC M⊙. In the area covered by the 0.4-mm dust map (Section 3.2.1), the CO mass map gives a mass M⊙, in agreement with the lower values in the range of masses as derived from 0.4-mm dust emission ( to M⊙).
On the full-GMC map (top frame) the central cluster W49N is the most prominent feature in the center. Radially out of it, the known triple filamentary structure of scale pc is seen connecting W49N to W49S (to the southeast), to W49SW (to the southwest), and extending north of W49N. W49S appears to be connected to a clump ( pc) to the northeast111111This clump is also seen in archival single-dish dust images and in the individual CO maps (figure 1).. W49SW appears to end in a high density peak. Another high column density clump is seen ( pc) southwest of the main W49N peak, and is joined by a north-south extension to the brighter filament joining W49N to W49SW. A chain of filaments extend north of W49N and all of them appear curved with a similar orientation. The full GMC mass distribution is clumpy, which indicates fragmentation also along the filaments in the periphery. All the bright UC and HC HII regions reside in the central main clusters, and W49N is by far the richest in ionized-gas structures (De Pree et al., 1997, 2004). A possible future line of research would be to study star formation in detail in the rest of the high column-density peaks as it has been done with W49N, looking for fainter HII regions and molecular-gas cores.
The bottom panel of Figure 9 shows the high-angular resolution column density map obtained from the combination of the CO SMA mosaics with the IRAM 30m observations presented in Peng et al. (2013). These map cover the area marked by a black square on the full-GMC map. The global column density peak is right in the middle of the ring of HC HIIs (see Figure 8 for an overplot), at the position of the HCHII labeled as B by De Pree et al. (1997). The highest column density features ( M⊙ pc-2) are indeed the highest volume density regions: in Figure C1 of Appendix C it is seen that many of the molecular lines that trace the densest gas ( cm-3) peak at the same position as the high-resolution CO column density maps.
It is striking to notice that the larger scale (10 to 100 pc) structure of the cloud is preserved all the way to the inner pc. This triple structure consists of one structure of filaments oriented toward the east-southeast (which join W49N to W49S), one structure of filaments toward the southwest, and filaments extending to the north. Each of the filamentary structures is seen to be composed of a tree of filaments in itself.
4.2. A Hub-filament network
The maps reveal that the mass structure of the W49 GMC is organized in a hierarchical network of filaments that appear to converge in the central, densest region harboring the W49N and W49S clusters. This network extends all the way from the inner pc where the embedded O-type stars in W49N reside (as traced by the dozens of UC and HC HII regions, see Figure 8, or Figure 1 in De Pree et al., 1997) to the pc scales of the full GMC (see Figure 1). It is also preserved at intermediate scales ( pc), where the filaments connect W49N to W49S, and both of them to the surrounding GMC (figures 5 and 6).
This type of hierarchical, centrally-condensed network of filaments appears to be common in clouds harboring the most luminous ( L⊙) star formation regions in the Galaxy. For example, the global structure of the W49 GMC appears to be a scaled up version of the GMC in the G10.6–0.4 massive star formation region ( L⊙, see Figure 3 of Liu et al., 2012b). In this scenario, the densest, central regions of the GMC collapse first because they have shorter free-fall time (). Furthermore, departures from spherical to sheet or filamentary geometries increase the free-fall time with the aspect ratio of the configuration (Toalá et al., 2012; Pon et al., 2012). Although never completely spherical, the central W49N clump is closer to sphericity than the larger-scale filaments121212i.e., the filament-interfilament column density contratst is larger in the cloud periphery.. Therefore, it is natural to expect that the central clump (scales pc) with an average number density to cm-3 can collapse and form massive stars in a time-scale of the order of a few times the spherical-collapse free-fall time yr, whereas the more filamentary, larger-scale GMC, even with an initial density close to that of the central clump, will collapse in a timescale Myr. Figure 1 of Liu et al. (2012b) shows a schematic diagram that accounts for the aspects above discussed.
Filament networks are often also present in low- and intermediate-mass star formation regions (Gutermuth et al., 2008; Myers, 2009; Molinari et al., 2010; Pineda et al., 2011; Kirk et al., 2013; Takahashi et al., 2013). However, it is unclear why some of them look like a filament-only network and some other also have prominent hub-like condensations. This could be due to evolution/mass differences, or due to different observational techniques131313The dust continuum, in contrast to line observations, picks everything on the line of sight.. We hypothesize that centrally condensed networks are the main morphology in the most massive clusters born out of the most massive clouds like W49 or Carina (Preibisch et al., 2012; Roccatagliata et al., 2013), but more systematic studies are needed. In W49, for example, many previous high-resolution studies focused only on the central few pc of the main clusters (e.g., Wilner et al., 2001; Peng et al., 2010), whereas studies that captured the entire GMC lacked the sensitivity to recover the external filaments (e.g., Simon et al., 2001; Matthews et al., 2009).
Hierarchical filament networks surrounding a central cluster (or small system of clusters) are also naturally expected from simulations of massive clouds that form massive star clusters (e.g., Bonnell et al., 2001; Smith et al., 2009b; Vázquez-Semadeni et al., 2009; Dale et al., 2012). In these simulations, the primorial GMC has density inhomogeneities (presumably caused by the process of GMC formation itself) that give rise to filamentary structure while the full cloud contracts. These filaments can then converge141414Although less used in the literature, we prefer the word ”convergence” to ”collision”, since the latter implies clearly distinct entities, and does not apply to, for example, a case where different filamentary arms that originated from a single GMC converge to a point. into the hubs where cluster formation occurs (e.g., Galván-Madrid et al., 2010; Duarte-Cabral et al., 2011; Inoue & Fukui, 2013), preferably at locations deep within the global gravitational potential. When feedback from the formed stars is included, it is usually found that it has an important effect in regulating the star formation efficiency (e.g., Peters et al., 2010a, 2011; Krumholz et al., 2011; Dale et al., 2012; Colín et al., 2013).
4.3. Other interpretations
Several interpretations have been put forward to explain the observations of W49N. Welch et al. (1987) proposed a global collapse scenario based on interferometric observations of RLs of the ring of HC HIIs and molecular-line absorption toward their line of sight. Keto et al. (1991), based on modeling the line profiles resulting from a hydrodynamical simulation, showed that the observations of Welch et al. (1987) could be explained by a global-local collapse scenario where fragmentation from the larger-scale contracting cloud produces denser molecular cores that themselves collapse into individual HII regions. Serabyn et al. (1993) proposed that the multiply-peaked single-dish line profiles are due to different molecular clumps whose collision triggered the vigorous star formation activity. The morphological evidence presented in this paper shows that the most likely situation is similar to a scaled-up version of the Keto et al. (1991) model. The filamentary pc scale GMC has fragmented and the denser W49N clump (extending further toward the southeast, southwest, and north) is the converging region of a hierarchical (triple) network of filaments that converge toward the ring of HC HIIs. If the different filaments are viewed as separate entities then they could be interpreted as colliding clouds. However, the observations presented in this paper show that they are part of a larger, common structure. Kinematical evidence supporting this interpretation will be shown in the second paper of this project. Further evidence comes from looking at the available single dish line profiles: the larger the optical depth, the more prominent the km s-1 dip is, indicating that it is produced by self-absorption due to the large column of gas toward the center of W49N. Indeed, we obtain our larger optical depths from the line ratios at these positions and velocities.
However, the ring of HC HIIs is not the entire story. There is already a NIR massive star cluster concentrated within 1 pc and located pc east of the Welch ring (cluster 1 of Alves & Homeier, 2003). This cluster likely is the ionizing source of the extended halo of free-free emission next to the HC HIIs (see Figure 8), whose edge matches the shell reported by Peng et al. (2010) from 4.5 and 8.0 m observations. These two YMCs (which may be parts at different evolutionary stages of the same YMC), together with the rest of the young massive stars in W49N, W49S, and W49SE, formed from the same GMC.
4.4. Comparison to other massive clouds in the Galaxy
We now proceed to use the column density maps described in Section 4.1 to compute the mass of the GMC as a function of distance from the central cluster W49N, and to compare with other massive GMCs in the Galaxy that are believed to be progenitors of young massive clusters (YMCs). Figure 10 shows the result. The match between the calculation using the CO 1–0 ratios on larger scales overlaps remarkably well with the result on smaller scales using CO 2–1 ratios. The mass in a region around W49N with a diameter pc M⊙, equivalent to a a mean density under the assumption of spherical symmetry of cm-3. Likely, the mean density is higher because of the filamentary geometry and substructure. Indeed, summing the CO mass in an aperture matching the dust filaments seen at 0.4 mm gives M⊙. The full GMC on scales of pc (diameter) reaches a mass of M⊙. In Figure 10 we compare the W49 GMC with the Galactic Center cloud G0.253+0.016 (Longmore et al., 2012; Kauffmann et al., 2013), which has a mass M⊙ in a diameter pc. Also plotted are the most massive clumps of the G305 GMC (Hindson et al., 2010) and the result of the recent study of the Carina complex by Preibisch et al. (2012). Unlike W49 and G0.253+0.016, the clusters in the latter two clouds are already optically visible. G0.253 and the W49 GMC also differ in other properties. G0.253 is almost starless (Kauffmann et al., 2013; Rodríguez & Zapata, 2013), appears to be externally confined to a total size of a few pc (Longmore et al., 2013), and is in a more extreme environment in the Central Molecular Zone (CMZ) of the Milky Way that may difficult further star formation. On the other hand, W49 has already formed a copious amount of stars as seen in the infrared and radio continuum.
It is seen that GMCs like Carina or W49 have a gas mass reservoir large enough ( M⊙) and the right size (radius pc) to form stellar clusters with the typical stellar mass M⊙ and radius pc of globular clusters (Portegies Zwart et al., 2010). The gas-mass reservoir of the central few pc is still enough to form a YMC with a stellar mass M⊙, even if it decouples completely from the rest of the cloud.
We note that the gas mass is dominated by molecular gas at all the scales relevant to this discussion. From the 3.5-cm free-free map, and for a range of turn-off frequencies151515The frequency at which an HII region transitions from being optically thin to thick. from 8 to 230 GHz, the total HII mass is between and 5400 .
5. GMC and cluster disruption
What is the future of the W49 GMC and its star clusters? Will the GMC be disrupted and star formation terminated? Will the resulting star cluster remain bound?
5.1. GMC disruption by feedback
The GMC can be disrupted by a series of feedback processes, from which the most important are protostellar jets and outflows, HII pressure, and radiation pressure. In W49A, the luminosity output is heavily dominated by the most massive stars. Massive, collimated outflows, do not appear to be important.
In principle, the over-pressurized ionized gas at temperature K can clear out the surrounding molecular gas, which is at a temperature from tens to hundreds of Kelvin (Keto, 2007). However, W49A is at a stage at which in spite of its enormous luminosity, several of its HII regions are still confined within AU (De Pree et al., 2000, 2004). Various mechanisms may be responsible for delaying HII region growth, including confinement by denser molecular gas (De Pree et al., 1995), molecular infall from the surrounding clump (Walmsley, 1995), and continued accretion through filamentary, partially-ionized accretion flows (Peters et al., 2010a; Galván-Madrid et al., 2011; Dale et al., 2012). W49A has already a lifetime of several yr since the onset of massive star formation161616The timespan of any previous low-mass star formation, plus the timespan of the assembly of the GMC are apart., given the presence of hypercompact HII regions and hot molecular cores (Wilner et al., 2001). After this time, only of the gas mass in the inner pc around W49N is ionized, the rest is molecular. The difference is even more dramatic ( of gas is ionized) if the full GMC is considered. Therefore, it is evident that in this timescale ionization is not efficient to disrupt the cloud. Even if the few central pc of gas were fully ionized, the main disruptive force would be radiation pressure rather than ionized-gas pressure. From Figure 2 of Krumholz & Matzner (2009), for an ionizing photon rate few s-1, and an average particle density few cm-3, the radiation pressure would be dominant by a factor .
To estimate the effect of radiation pressure, since most of the gas is molecular and not ionized, we should consider that the dominant form will be onto dust grains171717Even photons that are first absorbed by hydrogen atoms and returned at lower energies will be absorbed by dust (e.g., Krumholz & Matzner, 2009).. The GMC is disrupted if the outward radiation pressure from the central clusters overcomes the cloud’s self gravity, i.e., if the luminosity from the clusters is greater than the Eddington luminosity . Under spherical symmetry (an assumption only valid to some extent in the inner pc of the central clusters):
| (1) |
where is the dust mass at radius and is the Rosseland mean dust opacity. We take from our CO and dust measurements181818Note that this is the mass in the dust component., and in the range from 0.1 to 1 cm2 g-1 (Semenov et al., 2003). Therefore, is in the range from to . Sievers et al. (1991) obtained the luminosity of the central clusters by fitting their spectral energy distribution from the mid infrared to the millimeter. We rescale their result to a distance of 11.1 kpc (those authors used 14 kpc), to obtain a total luminosity . The Eddington ratio is then in the range 0.06 to 0.6. Note that the radius selection corresponds to the distance of W49N to W49S, and therefore is roughly the minimum gas mass that encloses most of the luminosity. If larger radii are taken, or if the larger mass estimates from taking an aperture following the central filaments in the CO maps, or from the 0.4-mm observations are taken, then the Eddington ratio would be even lower. Also, if the totality of the GMC is considered, it is possible that the filaments that are seen to radially converge in the central clusters continue to feed them during the star-formation timescale. A dynamical study of the filamentary network will follow this paper, however, even in the static case, we can conclude that the current cluster is not able to entirely clear its own cloud.
Murray et al. (2010) investigated the disruption of GMCs across a wide range of conditions, from Galactic starburst regions like W49 to Ultra-luminous Infrared Galaxies. They indeed conclude that radiation pressure is the dominant force in cloud dispersal. For their W49A case, however, they pick a cluster luminosity from correcting the free-free luminosity for dust absorption. This higher cluster luminosity in their model allows it to marginally disperse the GMC. Although the luminosity derived from the far-IR by Sievers et al. (1991) is more accurate, it is also true that the cluster may still gain more mass and become more luminous. An appealing idea is that the cluster will continue to gain mass until . Indeed, there is evidence that star formation in the central clusters is continuous: part of the stellar population is already visible in the near infrared191919Concentrated pc east of the Welch ring of HC HIIs, the ”Cluster 1” of Alves & Homeier (2003) likely is the ionizing source of the extended halo of ionized emission seen in the cm (De Pree et al., 1997), whose edge matches the shell reported by Peng et al. (2010). (Conti & Blum, 2002; Alves & Homeier, 2003); part of it is barely visible in the near- and mid-IR (Smith et al., 2009a) but their massive stars are seen as HC and UCHII regions in the radio (e.g., De Pree et al., 1997, 2000); and finally, there are also hot molecular cores without associated HII region (Wilner et al., 2001).
5.2. The fate of the central star cluster
Regarding the future of the star clusters, W49N and W49S may form more than one YMC, or coalesce into a single system. They could also dissolve. Observations and models of YMC dynamics suggest that if the star-formation efficiency is low enough ( %) ”rapid”202020Rapid compared to the crossing time . For a GMC of size pc and velocity dispersion km s-1, Myr. gas dispersal leaves unstable star clusters that end up dissolving (Lada et al., 1984; Bastian & Goodwin, 2006). However, if the gas dispersal timescale is comparable or larger than the crossing time of the GMC, the resulting star cluster has more time to adjust to the new gravitational potential and it is easier for it to remain bound even with star formation efficiencies as low as 10 % (Lada et al., 1984; Pelupessy & Portegies Zwart, 2012).
We argue that, because the star formation efficiency and the gas dispersal timescale are large enough, the most likely outcome is that the star clusters W49N+W49S (or at least part of their stellar content) will remain bound.
From near-infrared observations, Homeier & Alves (2005) estimate a stellar mass in frames of length ( pc) of to . The total stellar mass should be somewhat larger when the embedded population not visible in the IR (e.g., the HC HII regions) is taken into account. The total gas mass in the same area from the CO and submm continuum data is to . Therefore, within the W49N+W49S region, the current is , and will likely increase with time until star formation is terminated.
Observations of the most luminous star formation regions in the Galaxy show that their star clusters are still deeply embedded on large scales even after the formation of subsequent generations of UC HIIs, HC HIIs, and hot molecular cores, which requires timescales of at least several yr from the onset of significant feedback (Galván-Madrid et al., 2009; Liu et al., 2011, 2012a, 2012b). Older, optically visible clusters like the one in Carina (Preibisch et al., 2012) are still surrounded by hundreds of thousands of solar masses of molecular gas. Therefore, observations show that gas dispersal is slow compared to the star formation timescale. It is harder to estimate the SFR of the whole GMC because although in this paper we have presented a good account of its gas content, most of the stellar content is deeply embedded.
The central part of the W49 GMC satisfies other proposed criteria for bound massive cluster formation. Bressert et al. (2012) proposed that massive clusters need to have a escape velocity greater than the sound speed of ionized hydrogen km s-1. The central clusters in W49A satisfy this criterion. For a current star cluster mass , the minimum bound-cluster radius is pc. If the embedded population is taken into account, assuming , pc. The near-IR clusters212121“Cluster 1” is associated with W49N, ”cluster 2” with W49S, and ”cluster 3” with W49SE. identified by Alves & Homeier (2003) have individual radii pc. If further contiguous star formation ends up making a single cluster covering all the central part of the cloud, from W49S to W49SE, the radius of the resultant cluster is pc, compact enough to satisfy the criterion of Bressert et al. (2012) for boundness. This, however, may be a very restrictive condition, since it assumes that even a fully ionized cloud is contained by gravity and will eventually be used to form stars. Our observations show that in the W49 GMC the ionized-gas mass fraction is very small.
Kruijssen (2012) presented a model in which bound star clusters are formed out of the high density end of the ISM. This model accounts for possible dissolution effects like gas expulsion and external tidal forces, for conditions from typical Milky Way to extragalactic starbursts. Kruijssen (2012) finds that for gas mass surface densities above M⊙ pc-2, about 70 % of the formed clusters will remain bound. Our surface density map (figure 9, bottom right) shows that almost all of the W49N gas is above this threshold. This further suggests that the central cluster W49N222222We do not have a high-resolution mosaic of W49S. will remain as a bound one.
6. Conclusions
The first results from our MUSCLE survey of gas in the W49 GMC can be summarized as follows:
-
•
The W49 GMC is one of the most massive in the Galaxy. From multi-scale observations of CO and isotopologues, we derive a total mass M⊙ within a radius of 60 pc. Around the most prominent cluster W49N forming at the center of the GMC, within a radius of 6 pc, the total gas mass is M⊙ (masses uncertain to ). Therefore of the gas mass is concentrated in of the volume. The gas mass is dominated by the molecular- rather than the ionized phase (only of gas is ionized in the inner region). The W49 GMC has enough mass to form a young massive cluster (YMC) as massive as a globular cluster with a conservative star formation efficiency. We compare our results with recent studies of clouds candidate to form YMCs, like the Galactic Center cloud G0.253+0.016 (Longmore et al., 2012), the Carina complex (Preibisch et al., 2012), and G305 (Hindson et al., 2010).
-
•
The mass of the GMC is distributed in a hierarchical network of filaments that is forming a young massive cluster (YMC), or a system of YMCs. At scales pc, a triple, centrally condensed, filamentary structure peaks toward the ring of hypercompact HII regions in W49N known to host dozens of deeply embedded (maybe still accreting) O-type stars. This structure is observed to continue at scales from to 100 pc through filaments that radially converge toward W49N and toward its less prominent neighbour W49S. These large scale filaments are clumpy and could be forming stars at a rate lower than that of the central clusters. This finding suggests that the W49A starburst most likely formed from global gravitational contraction with localized collapse in a ”hub-filament” geometry.
-
•
Feedback from the central YMCs (with a current mass M⊙) is still not enough to disrupt the GMC, but further stellar mass growth within a factor of 2 could be enough to allow radiation pressure to disrupt the cloud and halt star formation. There is no evidence on global scales for significant disruption from photoionization.
-
•
Likely, the resulting stellar content will remain as a gravitationally bound massive star cluster, or a small system of bound star clusters.
References
- Aguirre et al. (2011) Aguirre, J. E., Ginsburg, A. G., Dunham, M. K., et al. 2011, ApJS, 192, 4
- Alves & Homeier (2003) Alves, J., & Homeier, N. 2003, ApJ, 589, L45
- Baobab Liu et al. (2010) Baobab Liu, H., Ho, P. T. P., Zhang, Q., et al. 2010, ApJ, 722, 262
- Bastian & Goodwin (2006) Bastian, N., & Goodwin, S. P. 2006, MNRAS, 369, L9
- Belloche et al. (2013) Belloche, A., Müller, H. S. P., Menten, K. M., Schilke, P., & Comito, C. 2013, ArXiv e-prints
- Beltrán et al. (2011) Beltrán, M. T., Cesaroni, R., Zhang, Q., et al. 2011, A&A, 532, A91
- Beuther et al. (2011) Beuther, H., Linz, H., Henning, T., et al. 2011, A&A, 531, A26
- Bonnell et al. (2001) Bonnell, I. A., Bate, M. R., Clarke, C. J., & Pringle, J. E. 2001, MNRAS, 323, 785
- Bressert et al. (2012) Bressert, E., Ginsburg, A., Bally, J., et al. 2012, ApJ, 758, L28
- Buckley & Ward-Thompson (1996) Buckley, H. D., & Ward-Thompson, D. 1996, MNRAS, 281, 294
- Cesaroni et al. (2010) Cesaroni, R., Hofner, P., Araya, E., & Kurtz, S. 2010, A&A, 509, A50
- Colín et al. (2013) Colín, P., Vázquez-Semadeni, E., & Gómez, G. C. 2013, MNRAS
- Conti & Blum (2002) Conti, P. S., & Blum, R. D. 2002, ApJ, 564, 827
- Curran & Chrysostomou (2007) Curran, R. L., & Chrysostomou, A. 2007, MNRAS, 382, 699
- Dale et al. (2012) Dale, J. E., Ercolano, B., & Bonnell, I. A. 2012, MNRAS, 424, 377
- De Pree et al. (1997) De Pree, C. G., Mehringer, D. M., & Goss, W. M. 1997, ApJ, 482, 307
- De Pree et al. (1995) De Pree, C. G., Rodriguez, L. F., & Goss, W. M. 1995, Revista Mexicana de Astronomia y Astrofisica, 31, 39
- De Pree et al. (2000) De Pree, C. G., Wilner, D. J., Goss, W. M., Welch, W. J., & McGrath, E. 2000, ApJ, 540, 308
- De Pree et al. (2004) De Pree, C. G., Wilner, D. J., Mercer, A. J., et al. 2004, ApJ, 600, 286
- Di Francesco et al. (2008) Di Francesco, J., Johnstone, D., Kirk, H., MacKenzie, T., & Ledwosinska, E. 2008, ApJS, 175, 277
- Dickel & Goss (1990) Dickel, H. R., & Goss, W. M. 1990, ApJ, 351, 189
- Duarte-Cabral et al. (2011) Duarte-Cabral, A., Dobbs, C. L., Peretto, N., & Fuller, G. A. 2011, A&A, 528, A50
- Fukui et al. (2013) Fukui, Y., Ohama, A., Hanaoka, N., et al. 2013, ArXiv e-prints
- Galván-Madrid et al. (2009) Galván-Madrid, R., Keto, E., Zhang, Q., et al. 2009, ApJ, 706, 1036
- Galván-Madrid et al. (2011) Galván-Madrid, R., Peters, T., Keto, E. R., et al. 2011, MNRAS, 416, 1033
- Galván-Madrid et al. (2010) Galván-Madrid, R., Zhang, Q., Keto, E., et al. 2010, ApJ, 725, 17
- Ginsburg et al. (2013) Ginsburg, A., Glenn, J., Rosolowsky, E., et al. 2013, ApJS, 208, 14
- Gooch (1996) Gooch, R. 1996, in Astronomical Society of the Pacific Conference Series, Vol. 101, Astronomical Data Analysis Software and Systems V, ed. G. H. Jacoby & J. Barnes, 80
- Gutermuth et al. (2008) Gutermuth, R. A., Myers, P. C., Megeath, S. T., et al. 2008, ApJ, 674, 336
- Gwinn et al. (1992) Gwinn, C. R., Moran, J. M., & Reid, M. J. 1992, ApJ, 393, 149
- Hindson et al. (2010) Hindson, L., Thompson, M. A., Urquhart, J. S., Clark, J. S., & Davies, B. 2010, MNRAS, 408, 1438
- Ho (1997) Ho, L. C. 1997, in Revista Mexicana de Astronomia y Astrofisica Conference Series, Vol. 6, Revista Mexicana de Astronomia y Astrofisica Conference Series, ed. J. Franco, R. Terlevich, & A. Serrano, 5
- Ho & Haschick (1981) Ho, P. T. P., & Haschick, A. D. 1981, ApJ, 248, 622
- Ho et al. (2004) Ho, P. T. P., Moran, J. M., & Lo, K. Y. 2004, ApJ, 616, L1
- Homeier & Alves (2005) Homeier, N. L., & Alves, J. 2005, A&A, 430, 481
- Inoue & Fukui (2013) Inoue, T., & Fukui, Y. 2013, ApJ, 774, L31
- Johnson et al. (2001) Johnson, K. E., Kobulnicky, H. A., Massey, P., & Conti, P. S. 2001, ApJ, 559, 864
- Kauffmann et al. (2013) Kauffmann, J., Pillai, T., & Zhang, Q. 2013, ApJ, 765, L35
- Keto (2007) Keto, E. 2007, ApJ, 666, 976
- Keto et al. (2005) Keto, E., Ho, L. C., & Lo, K.-Y. 2005, ApJ, 635, 1062
- Keto et al. (2008) Keto, E., Zhang, Q., & Kurtz, S. 2008, ApJ, 672, 423
- Keto et al. (1991) Keto, E. R., Lattanzio, J. C., & Monaghan, J. J. 1991, ApJ, 383, 639
- Kirk et al. (2013) Kirk, H., Myers, P. C., Bourke, T. L., et al. 2013, ApJ, 766, 115
- Kruijssen (2012) Kruijssen, J. M. D. 2012, MNRAS, 426, 3008
- Krumholz et al. (2011) Krumholz, M. R., Klein, R. I., & McKee, C. F. 2011, ApJ, 740, 74
- Krumholz & Matzner (2009) Krumholz, M. R., & Matzner, C. D. 2009, ApJ, 703, 1352
- Kurtz et al. (2000) Kurtz, S., Cesaroni, R., Churchwell, E., Hofner, P., & Walmsley, C. M. 2000, Protostars and Planets IV, 299
- Kurtz et al. (1994) Kurtz, S., Churchwell, E., & Wood, D. O. S. 1994, ApJS, 91, 659
- Lada et al. (1984) Lada, C. J., Margulis, M., & Dearborn, D. 1984, ApJ, 285, 141
- Liu et al. (2013) Liu, H. B., Ho, P. T. P., Wright, M. C. H., et al. 2013, ApJ, 770, 44
- Liu et al. (2012a) Liu, H. B., Jiménez-Serra, I., Ho, P. T. P., et al. 2012a, ApJ, 756, 10
- Liu et al. (2012b) Liu, H. B., Quintana-Lacaci, G., Wang, K., et al. 2012b, ApJ, 745, 61
- Liu et al. (2011) Liu, H. B., Zhang, Q., & Ho, P. T. P. 2011, ApJ, 729, 100
- Longmore et al. (2012) Longmore, S. N., Rathborne, J., Bastian, N., et al. 2012, ApJ, 746, 117
- Longmore et al. (2013) Longmore, S. N., Kruijssen, J. M. D., Bally, J., et al. 2013, MNRAS, 433, L15
- Lovas (2004) Lovas, F. J. 2004, Journal of Physical and Chemical Reference Data, 33, 177
- Mangum et al. (2007) Mangum, J. G., Emerson, D. T., & Greisen, E. W. 2007, A&A, 474, 679
- Matthews et al. (2009) Matthews, H., Kirk, H., Johnstone, D., et al. 2009, AJ, 138, 1380
- Meurer et al. (1995) Meurer, G. R., Heckman, T. M., Leitherer, C., et al. 1995, AJ, 110, 2665
- Miyawaki et al. (1986) Miyawaki, R., Hayashi, M., & Hasegawa, T. 1986, ApJ, 305, 353
- Miyawaki et al. (2009) —. 2009, PASJ, 61, 39
- Molinari et al. (2010) Molinari, S., Swinyard, B., Bally, J., et al. 2010, A&A, 518, L100
- Müller et al. (2005) Müller, H. S. P., Schlöder, F., Stutzki, J., & Winnewisser, G. 2005, Journal of Molecular Structure, 742, 215
- Murray et al. (2010) Murray, N., Quataert, E., & Thompson, T. A. 2010, ApJ, 709, 191
- Myers (2009) Myers, P. C. 2009, ApJ, 700, 1609
- Nagy et al. (2012) Nagy, Z., van der Tak, F. F. S., Fuller, G. A., Spaans, M., & Plume, R. 2012, A&A, 542, A6
- Nguyen Luong et al. (2011) Nguyen Luong, Q., Motte, F., Schuller, F., et al. 2011, A&A, 529, A41
- Nguyen Luong et al. (2013) Nguyen Luong, Q., Motte, F., Carlhoff, P., et al. 2013, ArXiv e-prints
- Nummelin et al. (1998) Nummelin, A., Bergman, P., Hjalmarson, A., et al. 1998, ApJS, 117, 427
- Ossenkopf & Henning (1994) Ossenkopf, V., & Henning, T. 1994, A&A, 291, 943
- Pelupessy & Portegies Zwart (2012) Pelupessy, F. I., & Portegies Zwart, S. 2012, MNRAS, 420, 1503
- Peng et al. (2013) Peng, T.-C., et al., & et al. 2013, submitted
- Peng et al. (2010) Peng, T.-C., Wyrowski, F., van der Tak, F. F. S., Menten, K. M., & Walmsley, C. M. 2010, A&A, 520, A84
- Peters et al. (2011) Peters, T., Banerjee, R., Klessen, R. S., & Mac Low, M.-M. 2011, ApJ, 729, 72
- Peters et al. (2010a) Peters, T., Banerjee, R., Klessen, R. S., et al. 2010a, ApJ, 711, 1017
- Peters et al. (2010b) Peters, T., Mac Low, M.-M., Banerjee, R., Klessen, R. S., & Dullemond, C. P. 2010b, ApJ, 719, 831
- Pineda et al. (2011) Pineda, J. E., Goodman, A. A., Arce, H. G., et al. 2011, ApJ, 739, L2
- Pineda et al. (2009) Pineda, J. E., Rosolowsky, E. W., & Goodman, A. A. 2009, ApJ, 699, L134
- Pon et al. (2012) Pon, A., Toalá, J. A., Johnstone, D., et al. 2012, ApJ, 756, 145
- Portegies Zwart et al. (2010) Portegies Zwart, S. F., McMillan, S. L. W., & Gieles, M. 2010, ARA&A, 48, 431
- Preibisch et al. (2012) Preibisch, T., Roccatagliata, V., Gaczkowski, B., & Ratzka, T. 2012, A&A, 541, A132
- Roccatagliata et al. (2013) Roccatagliata, V., Preibisch, T., Ratzka, T., & Gaczkowski, B. 2013, A&A, 554, A6
- Rodríguez & Zapata (2013) Rodríguez, L. F., & Zapata, L. A. 2013, ApJ, 767, L13
- Santangelo et al. (2009) Santangelo, G., Testi, L., Gregorini, L., et al. 2009, A&A, 501, 495
- Sault et al. (1995) Sault, R. J., Teuben, P. J., & Wright, M. C. H. 1995, in Astronomical Society of the Pacific Conference Series, Vol. 77, Astronomical Data Analysis Software and Systems IV, ed. R. A. Shaw, H. E. Payne, & J. J. E. Hayes, 433
- Semenov et al. (2003) Semenov, D., Henning, T., Helling, C., Ilgner, M., & Sedlmayr, E. 2003, A&A, 410, 611
- Serabyn et al. (1993) Serabyn, E., Guesten, R., & Schulz, A. 1993, ApJ, 413, 571
- Shan et al. (2010) Shan, W. L., Yang, J., Shi, S. C., et al. 2010, in Twenty-First International Symposium on Space Terahertz Technology, 136
- Sievers et al. (1991) Sievers, A. W., Mezger, P. G., Bordeon, M. A., et al. 1991, A&A, 251, 231
- Simon et al. (2001) Simon, R., Jackson, J. M., Clemens, D. P., Bania, T. M., & Heyer, M. H. 2001, ApJ, 551, 747
- Smith et al. (2009a) Smith, N., Whitney, B. A., Conti, P. S., de Pree, C. G., & Jackson, J. M. 2009a, MNRAS, 399, 952
- Smith et al. (2009b) Smith, R. J., Longmore, S., & Bonnell, I. 2009b, MNRAS, 400, 1775
- Snell et al. (1984) Snell, R. L., Scoville, N. Z., Sanders, D. B., & Erickson, N. R. 1984, ApJ, 284, 176
- Takahashi et al. (2013) Takahashi, S., Ho, P. T. P., Teixeira, P. S., Zapata, L. A., & Su, Y.-N. 2013, ApJ, 763, 57
- Toalá et al. (2012) Toalá, J. A., Vázquez-Semadeni, E., & Gómez, G. C. 2012, ApJ, 744, 190
- Turner (2009) Turner, J. L. 2009, Extreme Star Formation, ed. H. A. Thronson, M. Stiavelli, & A. Tielens, 215
- Vázquez-Semadeni et al. (2009) Vázquez-Semadeni, E., Gómez, G. C., Jappsen, A.-K., Ballesteros-Paredes, J., & Klessen, R. S. 2009, ApJ, 707, 1023
- Walmsley (1995) Walmsley, M. 1995, in Revista Mexicana de Astronomia y Astrofisica, vol. 27, Vol. 1, Revista Mexicana de Astronomia y Astrofisica Conference Series, ed. S. Lizano & J. M. Torrelles, 137
- Ward-Thompson & Robson (1990) Ward-Thompson, D., & Robson, E. I. 1990, MNRAS, 244, 458
- Wei et al. (2012) Wei, L. H., Keto, E., & Ho, L. C. 2012, ApJ, 750, 136
- Welch et al. (1987) Welch, W. J., Dreher, J. W., Jackson, J. M., Terebey, S., & Vogel, S. N. 1987, Science, 238, 1550
- Whitmore et al. (1993) Whitmore, B. C., Schweizer, F., Leitherer, C., Borne, K., & Robert, C. 1993, AJ, 106, 1354
- Wilner et al. (2001) Wilner, D. J., De Pree, C. G., Welch, W. J., & Goss, W. M. 2001, ApJ, 550, L81
- Wilson & Rood (1994) Wilson, T. L., & Rood, R. 1994, ARA&A, 32, 191
- Zhang et al. (2013) Zhang, B., Reid, M. J., Menten, K. M., et al. 2013, to appear in ApJ
Appendix A A: Details of the SMA mosaics
The SMA observations make use of the 4 available array configurations to cover the baseline range from 8 to 480 k (Fig. A1, left). Interferometric observations of massive star formation regions (and in general, of fields with complicated structure at multiple scales) are typically limited by the dynamic range produced by the discrete coverage rather than by integration time as in point-source observations. We have corroborated in our data set, as well as in other studies over the past years (e.g., Galván-Madrid et al., 2010) that co-adding SMA compact and extended configurations helps to recover all the flux up to scales of (comparable to the core scales of pc at typical kpc distances) while preserving subarcsecond angular resolution. However, since the ISM is hierarchical, cores are themselves embedded in pc scale clumps which may themselves be embedded on larger-scale structures, as shown in this paper. To map these structures, combined single-dish and inteferometer mapping is needed. ALMA is supposed to resolve these issues by combining mapping from two different arrays and single dishes. The data presented here covers a larger range of angular scales (plus the single dish) than even what has been offered for ALMA Cycle 1.
The right panel of Figure A1 shows the primary beam response of the 11-pointing mosaic. The images and measurements made in this paper have been divided by this reponse to correct the flux scale. Most of the interferometer maps have most of the flux in the central part of the mosaic. However, the CO (and isotopolgues) and dust continuum maps suffer from missing flux even in the all-configuration mosaics, so we have combined them with single-dish data. The SMA continuum map has been combined with the BOLOCAM GPS survey map (Ginsburg et al., 2013). The 13CO and C18O 2–1 maps have been combined with IRAM 30m maps presented in Peng et al. (2013). The combining procedure is described in Liu et al. (2012b, 2013). It is based on creating a visibility data set from the single-dish maps that overlaps in range with the interferometer data. The concatenated data is then inverted back to the image space and jointly cleaned.
Appendix B B: PMO velocity-integrated maps
In this Appendix we show the velocity-integrated (moment 0) PMO maps of the lines listed in Table 2, except for the CO maps that are used in the body of the text.
Appendix C C: SMA velocity-integrated mosaics
In this Appendix we show the velocity-integrated SMA maps from all the identified lines listed in Table 5, except for the 13CO and C18O which are used in the main body of the text. A detailed analysis of these maps will be presented in a forthcoming paper.
Appendix D D: Calculations of the mass of the GMC
We calculate the mass of the W49 GMC at all scales using four data sets: the combined SMA+IRAM 30m 13CO and C18O 2–1 maps of the inner pc (Fig. 9), the combined SMA+BOLOCAM GPS 1 mm dust continuum map also in the inner pc (Fig. 5), the archive SCUBA 0.4-mm map (Fig. 6), and the CO and 13CO 1–0 PMO maps covering the full GMC up to pc scales (Fig. 9). Below we describe the methodology.
D.1. CO 1–0
If we assume that the 13CO emission is optically thin, the 12CO opacity () in a given voxel of data (a position-position-velocity cell) can be calculated from the intensity (brightness) ratio of the lines (Snell et al., 1984):
| (D1) |
where is the relative abundance of 12C to 13C. We use using the fit of Wilson & Rood (1994) for a Galactocentric distance of 7.6 kpc for W49, derived using its parallax distance to the Sun of 11.1 kpc (Zhang et al., 2013).
In the voxels where there is a 12CO detection but no 13CO we use the optically thin approximation to the column density of 12CO [cm-2]:
| (D2) |
where temperatures are in K and velocity widths in km s-1.
In the voxels with 13CO emission we calculate the optically-thick column density with:
| (D3) |
Once the column density is known for each position-position-velocity voxel, we integrate them to obtain the mass surface density maps shown in Section 4. We note that in principle the same procedure can be used with the C18O to 12CO ratio. However, the PMO C18O maps are not sensitive enough to detect emission except for the very center of the cloud (see Section 3.1).
Two small corrections have been applied to the straightforward procedure outlined above. First, there is a dip in the spectra between 14 and 18 km s-1 that appears to be caused by an extended, foreground cloud (Peng et al., 2013). We have interpolated the measurements within this range. The corrected mass is larger. Second, a few voxels close to the map center and around km s-1 have very large optical depths (i.e., the 12CO and 13CO maps have the same intensity within the uncertainty).
For a cloud that is fully molecular, a hydrogen to helium number ratio of 10, and an abundance of H2 to 12CO , the gas mass surface density is then obtained from:
| (D4) |
where [] = g cm-2 for [] = cm-2, , and g.
D.2. CO 2–1
On the scales of W49N ( pc) we follow a similar procedure to the one outlined above, but with the 13CO and C18O 2–1 maps at angular resolution combined from the SMA mosaics and IRAM 30m data. In this case, we have that:
| (D5) |
Th rest of the procedure is as in the larger-scale maps. The relative abundance of 13CO to C18O (7.5) is the ratio of the abundance of 16O to 18O () to the abundance of 12C to 13C () (Wilson & Rood, 1994). The maximum optical depth solved in our calculations is 20. As with the larger-scale GMC, we have interpolated the spectra within the velocity range from 14 and 18 km s-1.
D.3. Millimeter continuum
Dust grains can be assumed to emit as a gray body at temperature . At millimeter and submillemeter wavelenghts their emission is optically thin, so the total mass in dust grains is given by
| (D6) |
where the units of mass [], distance [], frequency [], dust temperature [], flux [], and dust absorption coefficient [] are respectively M⊙, kpc, GHz, K, Jy, and cm2 g-1.
The total molecular-gass mass is then . Often the Rayleigh-Jeans regime () is assumed, but this is not the case for K and the frequencies we deal with, specially at 678 GHz (0.4 mm) where . Therefore we prefer to use the full Planck function.
D.4. Uncertainties
Many sources of uncertainty make the estimation of masses derived from CO ratios and dust continuum emission accurate to a factor of 2, at most. For the CO-ratio measurements, we handle uncertainties on the isotopologue abundances and the excitation temperature, and do not consider uncertainties in the CO to H2 abundance factor, which is usually set in the literature to . For the dust measurements, we handle uncertainties in the dust absorption coefficient and the dust temperature, but again leave the gas-to-dust mass conversion factor at 100.
The uncertainty in the mass determinations from CO isotopologue abundances is estimated from the fits of Wilson & Rood (1994). The abundance of 12C with respect to 13C is , and the abundance of 16O to 18O is . For the optically-thin and the non-saturated optically thick voxels, uncertainty in the mass propagates as the uncertainty in abundance. However, this is not the case for the saturated voxels in which we set to a maximum value . is defined as the value at which the line brightness ratio equals , where is the rms noise in the maps, i.e., larger optical depths are not distinguishable, within the noise. We have found empirically how this affect our calculations by re-running them within the allowed range of abundance values. In the large-scale PMO maps, very few pixels are affected by saturation in all cases. Therefore the masses scale almost linearly with the used abundance. In the smaller-scale SMA maps, several voxels are saturated mainly in the central parts of the map, therefore larger abundances permit increasingly large and larger mass estimates. The mass uncertainty due to the above mentioned effect grows at smaller radii, up to and within pc.
If the excitation temperature is not position dependent, then its effect on the uncertainty of the mass estimate is almost linear and affects equally all the radial measurements. We pick K. Reasonable values are in the range from 20 to 40 K. Therefore we estimate a respective mass uncertainty of . We also explore the effect of a possible radial dependence , with K, and K (i.e., a warm W49N). The results show that the mass in the inner 5 pc would be systematically underestimated by close to the center and at pc, and then at larger radii the mass difference would converge to at pc. However, we do not include the effects of this hypothetical temperature profile in our error budget.
Propagating the uncertainties from abundances and excitation temperatures gives a total uncertainty of for the PMO masses. For the SMA+IRAM 30m masses, typical values are and , but uncertainties are larger at smaller radii. The error bars in Figure 10 include the individual contributions from abundance uncertainty and from shifts in .
Uncertainties in mass determinations from dust are as large or larger than from CO. The dust absorption coefficient , dependent on the properties of dust grains, is the main source of uncertainty. We take as possible values for those corresponding to coagulated dust grains without significant ice mantles from the calculations of Ossenkopf & Henning (1994). The dispersion of these values is smaller at 0.4 mm than at 1 mm. We estimate the mass uncertainty from to be at the former wavelength, and at the latter. Possible variations from the adopted dust temperature K also contribute to the total uncertainty in mass. From the gray body fits of Sievers et al. (1991) and Ward-Thompson & Robson (1990), is restricted to the range between 20 and 50 K. Therefore the uncertainty from temperature in the mass determination is . Again, we do not consider further uncertainties from the dust-to-gas mass conversion factor, which we fix at 100. Therefore, we estimate a total mass uncertainty of at 0.4 mm, and at 1 mm, including uncertainties from the free-free subtraction at the latter wavelength.


 |
 |
 |
 |
 |
 |
 |
 |


 |
 |
 |
 |
 |
 |
 |
 |
 |
 |
 |
 |
 |
 |
 |
 |
 |
 |
 |
 |
 |
 |
 |
 |
 |
 |
 |
 |
 |
 |
 |
 |
 |
 |
 |
 |
 |
 |
 |
 |
 |
 |
 |
 |
 |
 |
 |
 |
 |
| Array | Epoch | Flux | Phase | Bandpass | |
|---|---|---|---|---|---|
| Calibrator | Calibrator | Calibrator | |||
| Subcompact | 15 Aug 2010 | Callisto | 1751+096 | 3C454.3 | 0.05 to 0.08 |
| Compact | 19 Jun 2010 | Neptune | 1751+096 | 3C279 | 0.08 |
| Extended | 10 Sep 2010 | Callisto | 1751+096 | 3C454.3 | 0.08 |
| Very extended | 15 Jul 2010 | Callisto | 1751+096 | 3C454.3 | 0.08 |
| Molecule | Transition | Integrated flux | ||
|---|---|---|---|---|
| [GHz] | [K] | [Jy km s-1] | ||
| 12CO | 115.2712 | 5.53 | ||
| 13CO | 110.2013 | 5.29 | ||
| C18O | 109.7821 | 5.27 | ||
| HCN | 88.6316 | 4.25 | bb From the 12C to 13C line ratios, the average optical depths of the main isotopologues are , , and . | |
| H13CN | 86.3399 | 4.14 | ||
| HCO+ | 89.1885 | 4.28 | bb From the 12C to 13C line ratios, the average optical depths of the main isotopologues are , , and . | |
| H13CO+ | 86.7542 | 4.16 | ||
| CS | 97.9809 | 7.05 | bb From the 12C to 13C line ratios, the average optical depths of the main isotopologues are , , and . | |
| H | 92.0344 | – | ||
| N2H+ | 93.1734 | 4.47 | ||
| SiO | 86.8469 | 6.25 | ||
| SO | 86.0939 | 19.31 | ||
| SO2 | 83.6880 | 36.71 |
| Molecule | Transition | Component 1 | Component 2 | Component 3 | ||||||
|---|---|---|---|---|---|---|---|---|---|---|
| or Atom | FWHM | FWHM | FWHM | |||||||
| [km/s] | [K] | [km/s] | [km/s] | [K] | [km/s] | [km/s] | [K] | [km/s] | ||
| 12CO | – | – | – | – | – | – | – | – | – | |
| 13CO | ||||||||||
| C18O | ||||||||||
| HCN | ||||||||||
| H13CN | – | – | – | |||||||
| HCO+ | – | – | – | |||||||
| H13CO+ | bbThe second peak of H13CO+ 1–0 appears quite wide, possibly due to a baseline difference at both extremes of the line emission. | – | – | – | ||||||
| CS | – | – | – | |||||||
| H | – | – | – | – | – | – | ||||
| N2H+ | – | – | – | |||||||
| SiO | – | – | – | – | – | – | ||||
| SO | – | – | – | – | – | – | ||||
| SO2 | – | – | – | – | – | – | ||||
| Intensity threshold | Surface density threshold | Flux from dust | H2 mass |
|---|---|---|---|
| [Jy beam-1] | [g cm-2] | [Jy] | [M⊙] |
| 0.025 | 17.017 | ||
| 0.050 | 12.745 | ||
| 0.100 | 9.216 | ||
| 0.200 | 7.462 | ||
| 0.400 | 6.267 | ||
| 0.800 | 4.253 | ||
| 1.600 | 2.239 |
| Species | Transition | [GHz] | [K] | Integrated flux [Jy km s-1] | Note |
|---|---|---|---|---|---|
| LSB Low | |||||
| HC3N | 24–23 | 218.3247 | 130.9 | 322 | |
| CH3OH | 4(2,2)–3(1,2) | 218.4400 | 45.4 | 372 | |
| H2CO | 3(2,2)–2(2,1) | 218.4756 | 68.0 | 282 | |
| – | 3(2,1)–2(2,0) | 218.7600 | 68.1 | 294 | |
| HC3N | 24–23 | 218.8543 | 848.9 | 63 | (1) |
| HC3N | 24–23 | 218.8608 | 452.1 | 63 | (1) |
| 33SO2 | 22(2,20)–22(1,21) | 218.8754 | 251.7 | 38 | |
| OCS | 18–17 | 218.9033 | 99.8 | 197 | |
| HNCO | 10(1,10)–9(1,9) | 218.9810 | 101.0 | 89 | |
| HC3N | 24–23 | 219.1737 | 452.3 | 60 | |
| SO2 | 22(7,15)–23(6,18) | 219.2759 | 352.7 | 203 | |
| 34SO2 | 11(1,11)–10(0,10) | 219.3550 | 60.1 | 305 | |
| CH3CH2CN | 22(2,21)–21(1,20) | 219.4636 | 112.4 | 33 | |
| C18O | 2–1 | 219.5603 | 15.8 | ||
| HNCO | 10(2,9)–9(2,8) | 219.7338 | 228.4 | 80 | (1) |
| – | 10(2,8)–9(2,7) | 219.7371 | 228.2 | 80 | (1) |
| – | 10(0,10)–9(0,9) | 219.7982 | 58.0 | 198 | |
| H213CO | 3(1,2)–2(1,1) | 219.9084 | 32.9 | 63 | |
| SO | 6(5)–5(4) | 219.9494 | 34.9 | ||
| CH3OH | 8(0,8)–7(1,6) | 220.0784 | 96.6 | 118 | |
| CH3OCHO | 17(4,13)–16(4,12) | 220.1668 | 103.1 | 93 | |
| CH3CHO | 10(3,8)–11(0,11) | 220.1800 | 275.4 | 63 | |
| LSB High | |||||
| 13CO | 2–1 | 220.3986 | 15.86 | ||
| HNCO | 10(1,9)–9(1,8) | 220.5847 | 101.5 | 90 | |
| CH3CN | 12(6)-11(6) | 220.5944 | 325.8 | 53 | |
| 33SO2 | 11(1,11)–10(0,10) | 220.6174 | 61.0 | 92 | |
| CH3CN | 12(5)–11(5) | 220.6410 | 247.3 | 40 | |
| – | 12(4)-11(4) | 220.6792 | 183.1 | 54 | |
| – | 12(3)-11(3) | 220.7090 | 133.1 | 150 | |
| – | 12(2)-11(2) | 220.7302 | 97.4 | 96 | |
| – | 12(1)-11(1) | 220.7430 | 76.0 | 295 | (1) |
| – | 12(0)-11(0) | 220.7472 | 68.8 | 295 | (1) |
| 33SO2 | 14(3,11)–14(2,12) | 220.9857 | 120.2 | 47 | |
| 34SO2 | 22(2,20)–22(1,21) | 221.1149 | 248.1 | 116 | |
| – | 13(2,12)–13(1,13) | 221.7357 | 92.5 | 153 | |
| SO2 | 11(1,11)–10(0,10) | 221.9652 | 60.3 | 1397 | |
| H | 222.0117 | – | 159 | (2) | |
| CH3CCH | 13(4)–12(4) | 222.0991 | 190.2 | 33 | (3) |
| – | 13(3)–12(3) | 222.1288 | 139.6 | 118 | |
| CH3OCHO | 18(6,12)–17(6,11) | 222.1488 | 312.3 | 106 | |
| CH3CCH | 13(1)–12(1) | 222.1627 | 81.7 | 427 | |
| H2CCO | 11(0,11)–10(0,10) | 222.1976 | 63.9 | 13 | (1) |
| – | 11(3,8)–10(3, 7) | 222.2002 | 181.3 | 13 | (1) |
| USB Low | |||||
| CO | 2–1 | 230.5380 | 16.5 | – | |
| OCS | 19–18 | 231.0609 | 110.8 | 255 | |
| 13CS | 5–4 | 231.2207 | 33.3 | 202 | |
| H | 231.9009 | – | 747 | ||
| CH3OCH3 | 13(0,13)–12(1,12) | 231.9877 | 80.9 | 122 | (1) |
| CH3OCH3 | 13(0,13)–12(1,12) | 231.9879 | 80.9 | 122 | (1) |
| USB High | |||||
| CH3OH | 10(2,8)–9(3,7) | 232.4185 | 165.4 | 90 | |
| – | 232.9458 | 190.3 | 60 | (4) | |
| CH3CH2CN | 26(6,21)–25(6,20) | 233.2050 | 190.9 | 47 | (1) |
| – | 26(6,20)–25(6,19) | 233.2073 | 190.9 | 47 | (1) |
| – | 42(4,38)–41(5,37) | 233.2910 | 410.1 | 33 | (1) |
| 34SO2 | 10(5,5)–11(4,8) | 233.2964 | 109.8 | 33 | (1) |
| CH3OCHO | 26(21,5)–27(20,7) | 233.7284 | 499.2 | 75 | |
| SO2 | 28(3,25)–28(2,26) | 234.1870 | 403.0 | 591 | |