22institutetext: Deutsches Zentrum für Luft-und Raumfahrt, DLR-RY, Robert-Hooke Str. 7, 28359 Bremen, Germany
33institutetext: Departament de Física Aplicada, Universitat d’Alacant, Ap. Correus 99, 03080 Alacant, Spain
Quiescent thermal emission from neutron stars in LMXBs
Abstract
Context. We monitored the quiescent thermal emission from neutron stars in low-mass X-ray binaries after active periods of intense activity in x-rays (outbursts).
Aims. The theoretical modeling of the thermal relaxation of the neutron star crust may be used to establish constraints on the crust composition and transport properties, depending on the astrophysical scenarios assumed.
Methods. We numerically simulated the thermal evolution of the neutron star crust and compared them with inferred surface temperatures for five sources: MXB 165929, KS 1731260, XTE J1701462, EXO 0748676 and IGR J174802446.
Results. We find that the evolution of MXB 165929, KS 1731260 and EXO 0748676 can be well described within a deep crustal cooling scenario. Conversely, we find that the other two sources can only be explained with models beyond crustal cooling. For the peculiar emission of XTE J1701462 we propose alternative scenarios such as residual accretion during quiescence, additional heat sources in the outer crust, and/or thermal isolation of the inner crust due to a buried magnetic field. We also explain the very recent reported temperature of IGR J174802446 with an additional heat deposition in the outer crust from shallow sources.
Key Words.:
stars: neutron, X-rays: binaries1 Introduction
Neutron star low-mass X-ray binaries (LMXBs) are systems formed by a neutron star (NS) that accretes matter from a low-mass companion star. These systems are most of the time in a quiescent state where little accretion occurs with an X-ray luminosity erg s-1. Periodically, the compact object undergoes an accretion episode with a corresponding increase in luminosity of – erg s-1. The accreted hydrogen- and helium-rich material at rates – g s-1 undergoes thermonuclear fusion within hours to days of reaching the NS surface, releasing MeV per accreted nucleon. (see, e.g., Bildsten (1997); Schatz et al. (1999) for a seminal work). The nuclear burning is thermally unstable on weakly magnetized NSs (B G) accreting at g s-1 and produces energetic ( erg) type I X-ray bursts when g s-1.
At the end of an active period, the emission shows a decreasing X-ray activity (quiescent phase) until a new accretion cycle begins. Most of the sources accrete for days or weeks, but there are only few of them that show unusually long active phases that last for years or decades. Recently, five so-called quasi-persistent sources have been monitored for about days after the end of the outburst: MXB 165929 (Wijnands et al. (2003); Cackett et al. (2008)), KS 1731260 (Wijnands et al. (2001); Cackett et al. (2010a)), EXO 0748676 (Wolff et al. (2008); Degenaar et al. (2011b); Díaz Trigo et al. (2011); Degenaar et al. (2014)), XTE J1701462 (Fridriksson et al. (2010, 2011)), and IGR J174802446 (Degenaar & Wijnands (2011a)). All these sources have been accreting at rates – times the Eddington mass accretion rate, g s-1(Galloway et al. (2008); Degenaar et al. (2011b)). The thermal component of the spectra is consistent with an overall decrease in the surface temperature of the NS; only for one source, MXB 165929, last measurements indicate that the star has reached an equilibrium temperature111While this work was being written, a new observation of MXB 165929 was reported, the temperature of which has not been clearly determined yet (see discussion in Cackett et al. (2013)); we did not include it in our analysis., but for the others there is evidence for continued cooling (Fridriksson et al. (2011); Degenaar et al. (2014)).
Theoretical explanations of the origin of the quiescent X-ray emission point to the thermal relaxation of the crust. Before the active phase it is assumed that the NS is old enough to have an isothermal interior and its surface temperature reflects the core temperature. During outbursts, the crust is heated up beyond thermal equilibrium by the accretion of matter that compresses the crust and triggers nuclear reactions. Once accretion falls to quiescent levels, it cools down by thermal radiation from the surface (mainly in the X-ray band), by heat conduction toward the core and consequent neutrino emission as the outer layers return to equilibrium with the interior; see the pioneering work by Brown et al. (1998) and Colpi et al. (2001). In quasi-persistent sources the crust is the region that is heated up because the outburst duration ( yr) is about as long as the crustal diffusion timescale. Nevertheless, observations of one source show that shorter accretion periods of a few months are thought to be responsible for the heating of the crust (see Degenaar et al. (2011a) and analysis on EXO 0748676 below). Typically, sources accrete for much shorter time, and the heat is generated mostly by thermonuclear reactions in the envelope that rapidly diffuses ( s,min) and does not affect the interior thermal state.
As a result of this long-term accretion phase, the cooling is modified not only by the energy released in the envelope (at densities –g cm-3) by thermonuclear reactions, but also by the energy generated in the inner crust (at –g cm-3) by electron captures, neutron emission, and density-driven nuclear fusion reactions (pycnonuclear reactions). Then, the so-called deep crustal heating controls the NS cooling in the quiescence phase. The rates of these processes have huge uncertainties: which particular reaction is taking place and at which density is still unknown. Fortunately, this uncertainty does not significantly affect the value of the total heat released MeV (Haensel & Zdunik (2008) hereafter HZ08, Gupta et al. (2007)), although the spatial distribution of heat sources in the inner crust is uncertain.
In the past decade, the comparison of observational data with cooling models including deep crustal heating allowed investigating crust properties and ultra-dense matter processes that influence the cooling curves (Rutledge et al., 2002). Simulations of the crust relaxation after outbursts for KS 1731260 and MXB 165929 (Shternin et al. (2007) and Brown & Cumming (2009); hereafter Sht07 and BC09) suggested a rather high thermal conductivity in the outer crust (which requires a low impurity content), in agreement with recent molecular dynamics calculations (Horowitz et al., 2009) but in contrast with the inefficient crust conductivity necessary for carbon ignition in superbursts (Cooper & Narayan, 2005; Cumming et al., 2006). A recent interpretation confirms the role of the crustal cooling as responsible for the quiescent emission for MXB 165929, KS 1731260 and XTE J1701462 and highlights the importance of the outburst duration in the subsequent cooling evolution (Page & Reddy, 2013).
Many other open questions as well as new observational data challenge these models in several fronts. First some of the sources might still be cooling, as indicated by the last observation of KS 1731260 (Fridriksson et al., 2011) and the high temperatures exhibit in XTE J1701462. If these sources indeed continue to cool, models should account for longer relaxation times for the crust. This opens the possibility of revisiting the analysis of BC09, who assumed that the quiescent emission of the crust levels off with the core. Second, some sources might show variability in the thermal component: XTE J1701462 has shown relatively short periods of increased temperatures during an overall cooling evolution. The origin of this variation is not clear, and one possible explanation is low-level accretion onto the NS surface during quiescence due to the correlated variability observed in the power-law spectral component (Fridriksson et al., 2011). Third, the candidate for crustal cooling recently detected in the globurar cluster Terzan 5, IGR J174802446, exhibits a higher temperature than the quiescent base level in 2009 (Degenaar et al., 2011b). More recently, five new observations have been reported (Degenaar et al., 2013), making its overall cooling even more puzzling. BC09-type cooling models can only account for these inferred temperatures if there is an additional heat generation in the outer crust (Degenaar et al., 2011a) whose location and origin is unknown222Another NSs went into quiescence in Terzan 5, EXO 1745248 (Degenaar & Wijnands, 2012), but it cannot be considered for crustal cooling since it lacks thermal emission; nevertheless it sets strong constraints on the properties of the NS core, which has efficiently cooled off.. Other recent theoretical speculations in the outer crust that may affect the crustal cooling (for instance, EXO 0748676) include heat convection due to the chemical separation of light and heavy nuclei (Medin & Cumming, 2014) or a shell with rapid neutrino cooling, which might have more dramatic consequences (Schatz et al., 2014).
In this paper, we aim at revisiting the problem by performing time-dependent simulations of the thermal evolution of the NS crust with deep crustal heating. The main purpose is to use our models to constrain the general properties of the NS crust (e.g. the crust thermal conductivity or impurities) by comparing our results with observational data of all available sources. We also discuss alternative scenarios for the sources that cannot be completely explained only by means of deep crustal heating.
The paper is organized as follows: in Sect. 2 we describe the five sources KS 1731260, MXB 165929, EXO 0748676, XTE J1701462, and IGR J174802446and briefly compare their remarkable characteristics. In Sect. 3 we describe the microphysics of the underlying neutron star model and the details for the numerical code. In Sect. 4-7 we test our cooling simulations in detail for the five sources. We summarize in Sect. 8.
2 Sources
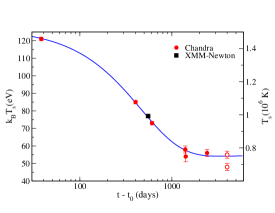
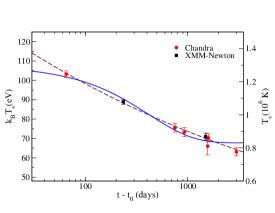
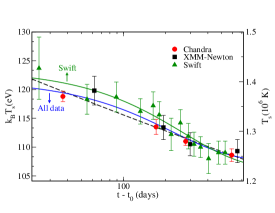
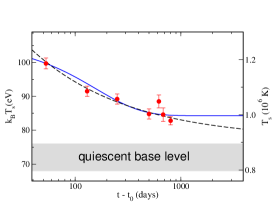
The main observational facts of the five NSs in LMXBs detected in quiescence presented below are summarized in Fig. 1 and Table 1.

| Source | Exponential fit | Power, broken power-law fits | ||||||||
| ( g s-1) | (yr) | (eV) | (d) | (eV) | (eV) | (d) | ||||
| MXB 165929[a] | 0.07-0.18 | 2.5 | 0.8 | — | ||||||
| KS 1731260[b] | 0.05-0.3 | 12.5 | 2.00† | 0.88 | ||||||
| EXO 0748676 | 0.03 | 24 | ||||||||
| Chandra[c] | 0.02 | — | ||||||||
| Swift[d] | 0.34 | 0.3 | ||||||||
| XMM-Newton[d] | 0.06 | 0.4 | ||||||||
| all data[d] | 0.39 | 0.51 | ||||||||
| XTE J1701462[e] | 1.1 | 1.6 | 1.07 | 0.88 | ||||||
| IGR J174802446[f] | 0.2 | 0.17 | 21.6±4 | 157±62 | 84.3±1.4 | 1.84 | 147.9±12.7 | 1.2†† | ||
2.1 MXB 165929
This source was detected in outburst first in 1976–1979 and again in 1999–2001. Both outbursts lasted about years (Lewin et al., 1976). Its quiescence was monitored by Chandra and XMM-Newton telescopes, the last observation was made by Chandra 11 years after the end of the last outburst (Fig. 1a). Assuming an accretion-power luminosity , with , it is possible to estimate a mean value for the mass-accretion rate –, where is in units of g s-1 (Galloway et al., 2008).
The first six observations of this source can be interpreted as the crust cooling down to equilibrium with the core. The evolution of the surface temperature can be well fit with an exponential function (Cackett et al., 2008), which shows that the flux and temperature of the last observation remained consistent with the previous two Chandra observations performed 1000 days before.
Recently, a new Chandra observation (Cackett et al., 2013) showed an unexpected drop in count rate and a change in the spectral shape that cannot be explained by continued cooling. Two possible scenarios are discussed in that work: i) it is assumed that the NS temperature remained unchanged and there was an increase in the column density; ii) alternatively, the NS surface temperature dropped and the spectrum is now dominated by a power-law component. Future observations of this source are necessary to distinguish between these two possibilities (corresponding temperatures are shown as open symbols in Fig. 1a).
2.2 KS 1731260
First detected in 1989 (Sunyaev & Kwant Team, 1989), the presence of type I x-ray bursts identified this compact object as a NS. The source was actively accreting for yr and the last detection in outburst was in January 2001 with a luminosity of erg s-1 (Wijnands et al., 2001) with an inferred (Galloway et al., 2008).
Its first four years in quiescence were studied by Cackett et al. (2006); they analyzed XMM-Newton (XMM) and Chandra (CXO) observations and fit the data spectrum with an absorbed neutron star atmosphere (see Fig. 1b). In that work it was not clear whether the source had reached thermal equilibrium with the core or if it was still cooling, but the last observation seemed to indicate the first. Then, the data were well fit in a first moment by an exponential decay to a constant offset (see Table 1).
Years later, Cackett et al. (2010a) presented a new Chandra observation that shows a decrease in temperature that is inconsistent with the previous fit. From revising all the Chandra and XMM-Newton data, the authors concluded that the source was still cooling with the temperature following a power-law decay (see Tab. 1). However, one problem in this analysis is that the spectrum may not be purely thermal and some nonthermal contribution may not have been detected because of the low number of counts. Observations are consistent with a simple NS atmosphere model, but a low-level (lower than 10) contribution from a power-law cannot be excluded.
We remark that first observations for KS 1731260 and MXB 165929 were performed only 25 days after the end of the outburst (similarly as for EXO 0748676 and IGR J174802446 , as described below). Thus, important information about the first stage of cooling and the physics of the outermost layers is lacking.
2.3 EXO 0748676
This source was first detected in 1980 (Parmar et al., 1986) at luminosities of erg s-1; it remained active for more than 24 years. Short X-ray bursts were observed, and their rise time and duration suggested pure helium ignition. The transition from outburst to quiescence occurred during 2008 and was monitored by Degenaar et al. (2009, 2011b) and Díaz Trigo et al. (2011). They found an uncertain date for the end of the outburst phase, which was poorly constrainted in a period of seven weeks. The mass-accretion rate inferred is , but recent analysis pointed out the possibility of this being underestimated by a factor of 5 because of the high inclination of the binary system with respect to our line of sight (Degenaar et al., 2014).
The quiescent spectrum of EXO 0748676 monitored by Chandra and Swift in the months after outburst was described by assuming a combination of a NS atmosphere model plus a nonthermal power-law tail (see Fig. 1c and Tab. 1). The resulting gradual decrease in the NS effective temperature (from eV to eV) was interpreted as crustal cooling by Degenaar et al. (2009). They also observed that quiescent light curves present a shift between data thermal fluxes (of ) coming from the two satellites, apparently due to cross-calibration problems. Díaz Trigo et al. (2011) revisited the problem and analyzed XMM-Newton data, which are the most sensitive observations of the source. They found that XMM-Newton fluxes are compatible with Swift, which reaffirms the hypothesis of an offset in the calibration between Chandra and Swift.
The unabsorbed flux ( erg cm-2 s-1) detected in April 2010 by Chandra is close to the flux measured by the EINSTEIN observatory before the last outburst of the source ( erg cm-2 s-1), supporting the idea that the crust has reached thermal equilibrium (Degenaar et al., 2011b). Nevertheless, Parmar et al. (1986) reported that EXO 0748676 might undergo periods when it is a much fainter X-ray source because the accretion disk may completely hide the central emission. It is remarkable that there is much less cooling after the end of the outburst than in the other sources. Recently, a new observation of EXO 0748676 was reported (Degenaar et al., 2014), showing a lower temperature eV in 2013 and suggesting that the crust has not fully cooled yet. This last observation is consistent with the predictions of our simulations (see Sec. 6), and we will include these data in our fits in a future work.
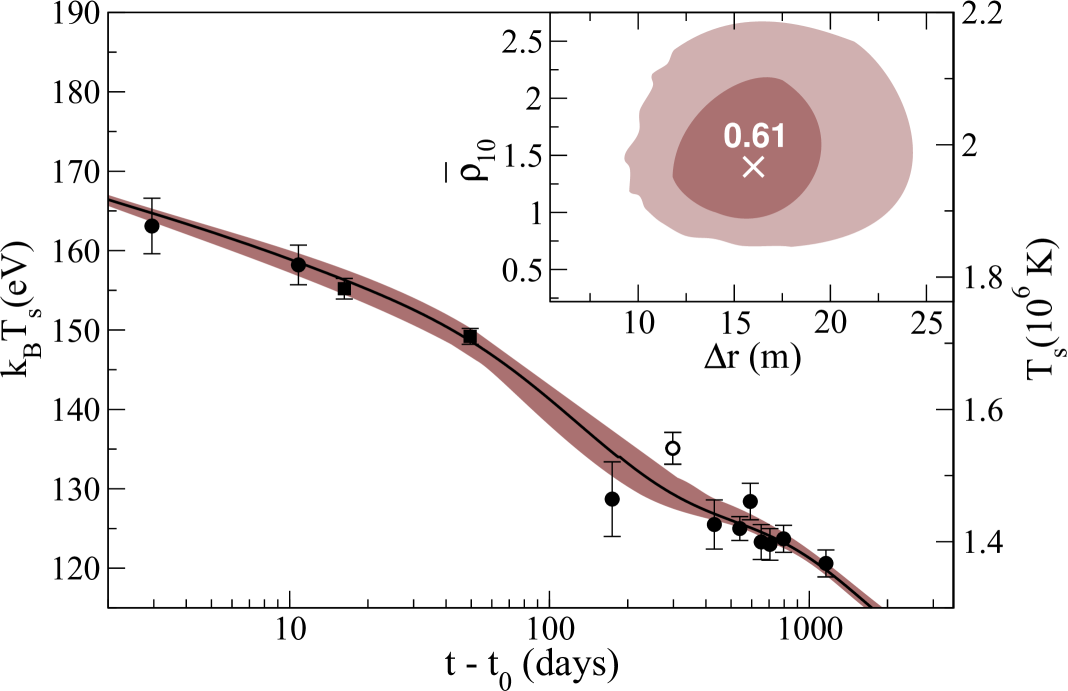
2.4 XTE J1701462
The neutron star transient XTE J1701462 was discovered in 2006 (Remillard et al., 2006) and remained in an exceptional luminous outburst for about months. The transition from outburst to quiescent emission and the first 800 days of the quiescent phase were first monitored by Fridriksson et al. (2010). During most of the quiescent period, the source was followed by Chandra in a campaign consisting of ten observations made between August 2007 and October 2009, and, lately, one more in October 2011. It was also observed three times with XMM-Newton in August 2007, September 2007, and March 2009, and last data came from April 2011 taken from Swift (Fridriksson et al., 2010, 2011) (see Fig. 1d). Here the luminosity was measured very early in the quiescent phase: three data points in the first twenty days. This gives valuable information about the the physics of the outer layers of the NS that are directly involved in the cooling after outbursts. These early data are a qualitative difference to all other known sources. The inferred value for the mass-accretion rate for XTE J1701462 is close to the Eddington rate, (Cackett et al., 2010b).
Spectra of XTE J1701462 show thermal and nonthermal components which latter is well fit by a power-law of index 1-2. The origin of the nonthermal emission is poorly understood, but it probably originates in magnetospheric activity (Campana et al., 1998). The thermal emission in quiescence (see Fig. 1d) shows a temperature decrease that is interpreted as the cooling of the NS crust that was heated up in the accretion phase. Nevertheless, some features in the observed luminosity indicate that the crustal cooling may be affected by other processes.
First, we note that the effective surface temperature decreases from approximately eV to eV, significantly higher temperatures than those inferred for MXB 165929 and KS 1731260 (approx. from eV to eV). The relatively warm surface of XTE J1701462 may be a result of the high (close to Eddington) accretion rate at which this source has been accumulating matter during most of its active phase. Alternatively, it might be due to a higher core temperature (maybe it is a young star?).
Second, the overall cooling rate seems to be explained by crustal heating, as analyzed in Fridriksson et al. (2011) from data from XMM-Newton and Chandra where they found good fits from considering exponential and broken power-law functions with and , respectively. However, these fits do not include the third XMM-Newton (XMM-3) and the fourth Chandra (CXO-4) observations between days, which show a considerable increment in thermal and nonthermal spectral components (Fridriksson et al. (2011), see Tab. 1).
One more drawback is that it was unclear in Fridriksson et al. (2010) whether the XTE J1701462 crust had already reached a thermal equilibrium with the core. The last Chandra observation indicated with confidence that the surface temperature has decreased, implying that the source is still cooling (Fridriksson et al., 2011), which is inconsistent with previous fits.
Another challenge for crustal cooling models is that the temperatures registered at early times drop on a relatively short timescale with an -folding time for the exponential fit of 120 days (compared with 300 days for MXB 165929 and 460 days for KS 1731260 (Cackett et al., 2010a)), which argues in favor of a highly conductive crust. Moreover, the temperature evolution shows a change in the slope at early times of about - days (Fridriksson et al. (2011) obtained even 25-80 days). This break in the evolution makes it difficult to reconcile the initial rapid cooling shown by early observations and the much slower decrease from the last data in the same cooling model.
2.5 IGR J174802446
The transient IGR J174802446 was found in the globular cluster TERZAN by Chandra telescope in 2003 (Heinke et al., 2006). In October 2010 it suddenly entered into an outburst period, increasing its intensity by approximately one order of magnitude (Bordas et al., 2010; Pooley et al., 2010). The source returned to quiescence after about ten weeks (Degenaar & Wijnands, 2011a). A Chandra observation 50 days after the end of the outburst showed that the surface temperature was higher by a factor 4 than the base level observed in 2003 and 2009 (Degenaar & Wijnands, 2011b).
More recently, Degenaar et al. (2013) reported new Chandra/ACIS observations on IGR J174802446 that extend the monitoring to 2.2 years into quiescence. They found that even when the thermal flux and NS temperature have decreased, their values still remain well above those measured in the previous accretion phase. They fit these last observations with exponential decays and found that when the quiescence base level is fixed to the temperature inferred from the 2003/2009 data, the fit results are poor (). However, this is considerably improved () when this parameter varies freely, in which case the base level is eV, considerably higher than the quiescent level. Because this value is close to the obtained from the previous observation in 2013 February, this predicts that the NS crust has nearly leveled off (see solid curve in Fig. 1e). Nevertheless, the best fit corresponds to a power-law decay with a free base level for which eV, which is significantly lower than the most recent observation (see dashed curve Fig. 1e), which indicates a continued cooling of the crust.
2.6 Brief comparison of the sources
We can group MXB 165929 and KS 1731260 together since they have similar accretion rates (), evolve in a similar temperature range ( - eV), and are (nearly) leveled off with the core on comparable timescales ( days). Their data spectra are well fit with an absorbed NS atmosphere, and their exponential fits show similar e-folding times ( - days). Although the data are sparse in time, their error bars are relatively low.
In contrast, EXO 0748676 and XTE J1701462 (and partially IGR J174802446) present peculiar characteristics. They are warmer than the sources in the first group and the data points show larger error bars (like EXO 0748676) or exhibit a much higher variability (as in XTE J1701462). Their temperatures evolve on a higher range ( - eV for EXO 0748676, - eV for XTE J1701462) than the first two, and the e-folding times are considerably shorter (130 days for XTE J1701462and 220 days for EXO 0748676). EXO 0748676 has the lowest accretion rate () but the longest accretion time ( yr), which can be the origin of its high surface temperature. More puzzling is the small amount of cooling that it shows, its temperature decreases by only eV from the initial to the last observation. XTE J1701462 instead has the highest accretion rate, at least ten times higher than the other sources. The pronounced break between the early and latest observations slope is not evident in the other sources. Finally, IGR J174802446 shows similarities to the first group, for instance, an accretion rate of the same order, but has a considerably shorter outburst time (the shortest among all sources). Like the second group, it exhibits a short e-folding time of 60 days and a temperature drop in the overall cooling of only eV.
3 Baseline model and thermal evolution
3.1 Equation of state
At low density we used the BBP Baym et al. (1971) equation of state. The crust-envelope interface is placed at g cm3 and we continued using the BBP EoS to describe the crust up to a density of g cm-3. To take into account the effects of the accretion in the crust composition, we used the EoS presented in HZ08 in the range g cm-3. This is a BBP-like EoS, but modified by nonequilibrium nuclear reactions in the crust (see Sec. 3.3). The very high-density region in the inner crust and the core is described by a Skyrme-type EoS that considers a nucleon-nucleon SLy effective interaction Douchin & Haensel (2001). For this chosen EoS the crust-core interface is at , where is the nuclear saturation density.
Throughout this paper we use two different NS models with masses M⊙ and M⊙. Their properties are listed in Tab. 2: as the NS mass increases, the crust width decreases, which reduces the crustal relaxation time as .
| (M⊙) | ( g cm-3) | (km) | ( cm s-2) | (m) |
|---|---|---|---|---|
| 1.4 | 9.88 | 11.79 | 1.34 | 944 |
| 1.6 | 11.65 | 11.61 | 1.58 | 735 |
3.2 Superfluidity
Nucleon pairing does not affect the EoS, but it can play an important role in NS cooling since it strongly modifies the specific heat and neutrino emissivities of dense matter. Following Kaminker et al. (2001) and Andersson et al. (2005), we used a phenomenological formula for the momentum dependence of the neutron energy gap at zero temperature given by
| (1) |
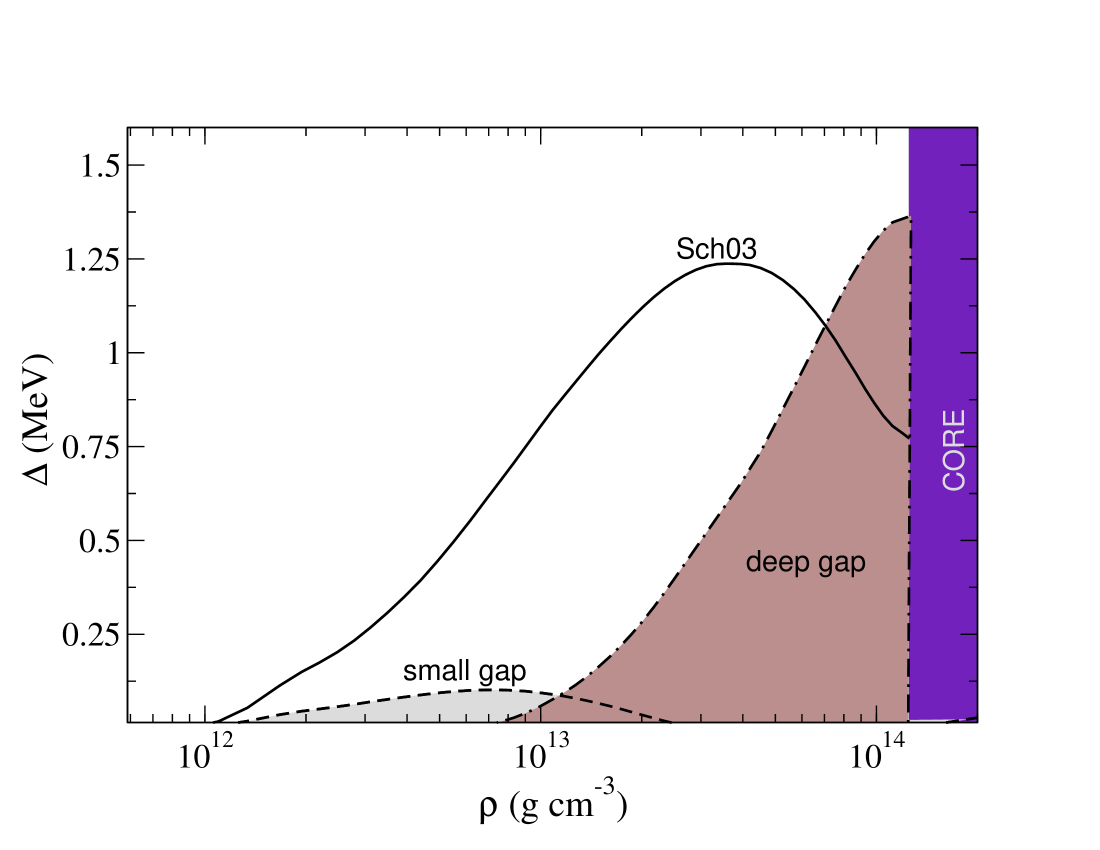
where is the Fermi momentum of neutrons and the parameters and , are values fit to microphysical calculations listed in Tab. 3. This expression is valid for , with vanishing outside this range. In Fig. 2 we show three different functional forms for the density dependence of the neutron superfluidity energy gaps in the NS crust we used throughout: Sch03 gap (from Schwenk et al. (2003)), deep gap, and small gap.
| Label | |||||
|---|---|---|---|---|---|
| (MeV) | (fm-1) | (fm-1) | (fm-1) | (fm-1) | |
| Sch03 | 72.7 | 0.1 | 6.2 | 1.5 | 2.79 |
| deep | 4.0 | 0.4 | 1.5 | 1.65 | 0.05 |
| small | 20.7 | 0.1 | 6.2 | 1.5 | 2.79 |
References. (a) Sch03 gap; (b) deep gap; (c) small gap
The corresponding critical temperatures for the -wave pairing can be approximately calculated as . At the relevant densities, the crustal temperatures for the five sources are always lower than the corresponding , and neutrons are already in a superfluid state in the inner crust. Unless otherwise stated, we considered Sch03 gap in our simulations.
3.3 Crust composition
The crust of an accreting NS can be partially replaced after an accretion period of several years. Thus, its composition can be significantly different from that of isolated NSs, see Fig. 3, in which the mass number A (circles) and the nuclear charge Z (stars) deviate from the non accreted composition (solid lines) along the NS crust. We refer to Sec. 2.1 of HZ08 for details about the capture rates in different regimes.
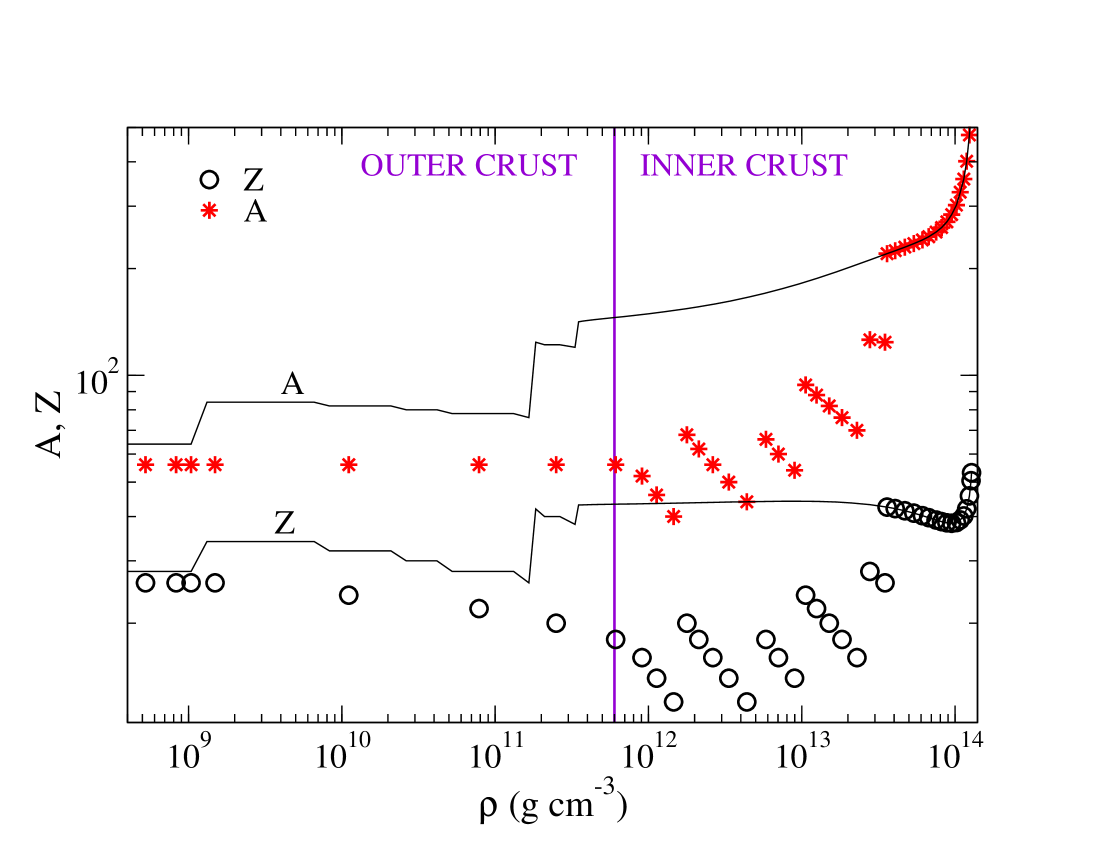
At densities above the neutron drip density, g cm-3, in the inner crust, there are neutron emissions triggered by electron captures that cause A to decrease. At higher densities ( g cm-3) the mean distance between nuclei diminishes and quantum zero-point vibrations increase, which leads to pycnonuclear reactions that result in jumps in A. In Fig. 3 we can observe that the composition abruptly changes with depth, the jumps correspond to the location of thresholds for pycnonuclear reactions.
3.4 Transport properties and neutrino emission
The processes that dominate the crust thermal conductivity (strongly) depend on temperature and density. While electron-phonon scattering dominates at low densities in the outer crust, electron-impurity scattering is the most important process at higher densities in the inner crust. To calculate these processes, we used the public code of A. Potekhin333http://www.ioffe.rssi.ru/astro/conduct/condmag.html.
An important, but uncertain, parameter in calculating the thermal conductivity is the impurity parameter
| (2) |
which measures the quadratic charge deviation of lattice ions with ion density and charge number with respect to the mean value and weighted to the mean ion density . High values of this parameter () correspond to an amorphous crust and a low thermal conductivity. Recent molecular dynamic calculations, however, predict a regular crystalline structure with a moderate value of on the order of unity (Horowitz et al., 2007, 2009) in the outer crust. BC09 estimated the value of by fitting the observational data of the sources KS 1731260 and MXB 165929 and also found that .
The crustal specific heat has contributions from the ion lattice, the degenerate electron gas, and the neutron gas in the inner crust that strongly depend on the temperature and density (see Aguilera et al. (2008) and references therein for the model used here; also Page & Reddy (2012) for a detailed discussion). Contributions from the neutron gas are suppressed by a Boltzmann-like factor, controlled by (see Levenfish & Yakovlev (1994)) when the falls below for superfluidity. This means that if the neutrons are not superfluid, they control the specific heat in the inner crust at all . If they were to become superfluid, then this probably is important only in a density region where the suppression is not effective. The other two crustal specific heat contributions also vary strongly with and : at K the ion lattice dominates in most of the crust (and is only overcome by unpaired neutrons). At lower , the electron contribution is similar to the ionic at K and becomes dominating at K, again, at the layers without unpaired neutrons. Superfluid phonons (Aguilera et al., 2009) might have a negligible effect or only be relevant in a tinny region when and the superfluid phonons velocity approximates the transverse lattice phonon velocity (Page & Reddy, 2012). We neglected the interaction between the ion lattice and the neutron gas (pioneering work Cirigliano et al. (2011), also more recently the entrainment studied in Chamel (2012)), and this might be the main drawback of this approach since it may influence the thermal evolution of the crust , see Page & Reddy (2012). Nevertheless, the results are not conclusive about the strength of the coupling between superfluid neutrons and the lattice, and any type of disorder in the lattice might substantially reduce the effect (Chamel et al., 2013). We plan to investigate this problem in future works.
We included all relevant neutrino emission processes that influence the cooling of the crust (see Tab. 3 in Aguilera et al. (2008) for a list.) At high temperatures ( K) the dominant process is the plasmon decay. At intermediate values ( K), the plasmon decay is only dominant in the outer crust, while electron-nuclei Bremsstrahlung becomes more efficient in a large part of the crust volume (Yakovlev et al., 2001). We also included the Cooper pair breaking and formation (CPBF) process, although it does not affect the thermal evolution of the inner crust.
3.5 Thermal evolution
After defining the baseline NS model, we followed its thermal evolution by solving the diffusion equation taking into account all energy gains and losses:
| (3) |
where is the specific heat per unit volume, denotes the energy loss by neutrino emissions and considers energy gains as a consequence of the accretion of matter. As we mentioned in Sec. 3.1, the deep crustal heating considers that there are heat sources located in the inner crust as a result of pycnonuclear reactions and electron captures as well as other less intense sources in the outer crust (HZ08). The metric used is and in the diffusion limit the heat flux is given by the following expression:
| (4) |
where is the thermal conductivity tensor and is the redshifted temperature. In our one-dimensional treatment the flux is only radial and becomes a scalar that includes contributions of electrons, neutrons, protons, and phonons:
| (5) |
The electronic term is dominant in the crust, while radiative transport is the most important process close to the surface.
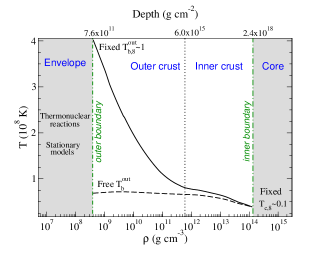
The temperature evolution is followed in the region that extends from the crust-core interface ( g cm-3) down to the base of the envelope (crust-envelope interface at g cm-3).
3.6 Crustal heating during outbursts: generating the initial thermal profile
To simulate the accretion phase, we considered the heat released per nucleon as a function of the density (as in HZ08, Sec. 3.3). The integration in Eq. 3 was iterated until the temporal variable equaled the outburst duration. At this time, the NS crust has reached a thermal profile that depends on the local energy release per nucleon, the local accretion rate , the duration of the outburst , and the crust microphysics as . Then, the quiescent phase begins and the NS crust starts to cool down from this initial thermal profile, which corresponds to the conditions at the end of the outburst.
3.7 Inner boundary: the core
The equilibrium temperature of the system is set by the core temperature, , which mainly depends on the long-term averaged accretion rate. We assumed that the recurrence time, that is, the time between two accretion events, is shorter than the relaxation time of the core (103 yr) and the source has gone through several accretion-quiescence cycles, therefore the core has reached thermal equilibrium and its temperature remains roughly constant. Thus, as an inner boundary condition, we fixed to a constant value taken as a free parameter to fit the observations. If the NS has reached the thermal equilibrium with the core, is determined by the last observations. Otherwise, if the source is still cooling, is difficult to infer.
We checked that assuming a constant is a good approximation for quasi-persistent sources unless accretion lasts for much longer than yr. In that case, the core could be heated up by an inward flux generated by the strong heat deposition over the extended period (e.g., for EXO 0748676 if yr).
3.8 Outer boundary: the envelope
To study the thermal evolution of the crust, the outer boundary condition presents numerical difficulties since the external layers have a thermal relaxation time (1-100 s) much shorter than the crustal cooling timescale (1000 days). Therefore we assumed that the crust is surrounded by a fully relaxed envelope and treated the two regions separately. The outer integration limit for the crustal cooling is then the bottom of the envelope placed at , with a temperature , which is influenced by thermonuclear reactions during outburst. In this sense, the initial value of this temperature at the beginning of the quiescence phase, contains relevant information about the heating of the envelope during the active phase. In our approach (as in BC09), we set to fit the cooling curves to the observational data and leave the envelope model and determining for a future work.
The boundary condition for our crustal cooling is the – relation shown in Fig. 4. At low our partially accreted model (PA) converges to a fully accreted model (FA) composed mainly by H and He, as for example in Potekhin et al. (1997) (hereafter PCY97). For high , however, it resembles the canonical relation for the non-accreted case (Gudmundsson et al. (1983), hereafter GPE83) in a Fe envelope. There is an overall agreement between our approach and the relation used in BC09 (stars), which facilitates the comparison of the cooling curves below.
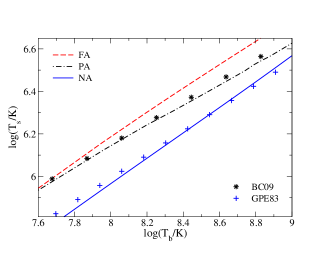
Linearizing the – relations in a log-log plot for subsequent cooling simulations we obtained
| (6) |
with slight variations in the coefficients and for a (1.4, 1.6) M⊙ NS model, respectively.
4 Revisiting crustal cooling
We now discuss our results, which we previously compare with existing works (see details in Appendix A) for testing purposes.
4.1 Deep crustal cooling model: testing MXB 165929
We begin with MXB 165929, which is considered the most standard case. We used a NS with a mass of 1.6 M⊙ and radius km (Tab. 2), taking the impurity parameter , the accretion rate , and core temperature as free parameters. The temperature evolution at the outer boundary, , during outburst and quiescence, the corresponding initial thermal profiles, and the cooling curve are plotted in Figs. 5, 5, and 5, respectively.
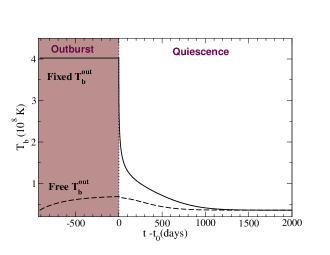
First, we assumed that the temperature at the base of the envelope during outburst, , is fixed to (Fig. 5, solid lines) while at the inner boundary the core temperature is kept fixed to , both values chosen to fit the first and last observations, respectively. We set , and M⊙, similar to those used in BC09, see Appendix A for a detailed comparison. Note that the initial thermal profile suitable to explain the data (brown ellipses in Fig. 5) has an inverted temperature gradient and hence an inward-directed heat flux. As was pointed out before (BC09, Sht07), the (arbitrary) value of is crucial to explain the early decay. To illustrate this point, we plot the case when is not held fixed, but instead evolves freely (dashed curves), controlled only by deep crustal heating (HZ08). These curves fail to explain observations in the early cooling, and a higher value of is necessary, as we can see from the cooling curves (Fig. 5).
At each time, the surface temperature reflects the initial conditions at a particular depth. Deeper down, the crust did not have time to relax, and it exhibits roughly the initial thermal profile. Thus, each depth (or density) corresponds to an evolutionary time. The early cooling (first days) is controlled by the physics of the outer crust and the initial thermal profile, which depend strongly on and on . The following epoch corresponds to the inner crust thermal relaxation, (approx. days) and is determined by electron-impurity scattering. After days the imprint of the superfluid neutron gas is clear: the temperature fall and the subsequent slope is mostly controlled by the strength of the pairing energy gap (Page, 2013) and the possible interaction of the free neutrons with the ion lattice, for example, as a result of entrainment effects (Chamel et al., 2013).
The cooling curve tail reflects the core thermal state (at days) whose temperature remains nearly constant. We checked that the core temperature is not modified unless the accretion period lasts for much longer than 10 yr.
4.2 Heated-up envelope or incorrect accretion rate?
To show how critical the value of is for the early decay, we also explored the case where evolves freely. BC09 estimated that its value cannot rise to K solely by means of deep crustal heating (HZ08 sources) and that the required energy release in the outer crust is MeV nuc-1 for , well above that provided by electron captures (Gupta et al. (2007) and HZ08). Moreover, it must be released at a density gr cm-1, which is again below the density range of electron captures or other known reactions in the outer crust (like 24O burning, Horowitz et al. (2008)).
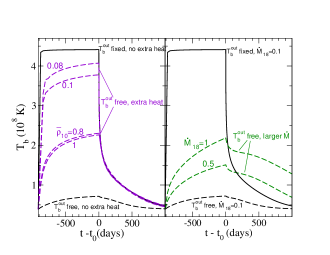
The steep fall in the inverted temperature gradient of the initial thermal profile is necessary to account for the relatively high temperature of the first observation ( eV at 40 days) followed by the moderate value of the second one ( eV at 300 days), see Fig. 6. Our results show that this profile is indeed difficult to achieve unless an additional heating source is assumed to be coming from a low-density layer. It originate either in the heated-up envelope during outburst (that modifies the boundary condition for the cooling through the value of ) or in the outer crust at shallow depths. This fact was implicitly assumed in BC09 when was fixed to a relatively high value . Alternatively, it has been proposed that MXB 165929 has been accreting at the Eddington rate , overestimating for MXB 165929 by about one order of magnitude (Sht07).
We simulated these two possibilities: additional shallow heat deposition and increased accretion rates. In the first case we considered the location of additional sources to vary in the range (where is in g cm-3) with radial width m and a released energy of MeV nuc-1 while keeping (left panels of Fig. 6). We found that the modified hardly reproduces the initial steep fall of (solid lines) unless intense shallow additional sources are present (at ). If the heat originates in even more external layers, the energy deposited should be lower and the results are much similar to the case with fixed . This leads to the idea that the heat source is probably located at the top of the outer crust or even in the envelope.
In the second case, we increased (right panels of Fig. 6) without any additional heat source. We found that the resulting slope cannot explain the MXB 165929 early data (right panels of Fig. 6), which means that it is unlikely that has been underestimated.
We conclude that deep crustal heating by pycnonuclear reactions in the inner crust and e-captures in the outer crust is not enough to explain the early slope of MXB 165929 and additional energy from low density regions is needed either from the heated-up envelope during outburst or from additional shallow sources in the outer crust. Observations shortly after accretion stop are, therefore, crucial to clarify this point.
5 Influence of the thermal state of the envelope and core on the crustal cooling: limiting and
Next we assumed a starting model with fixed M⊙, leaving , and as free parameters, usually set in each case to fit the first and the last observation of each source.
MXB 165929
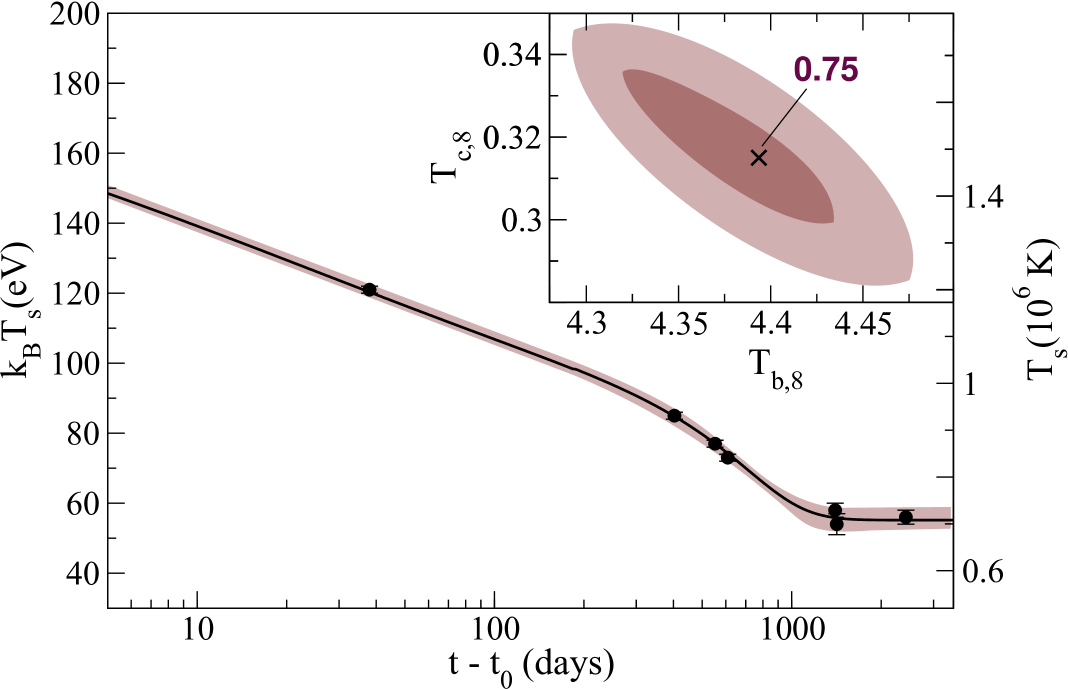
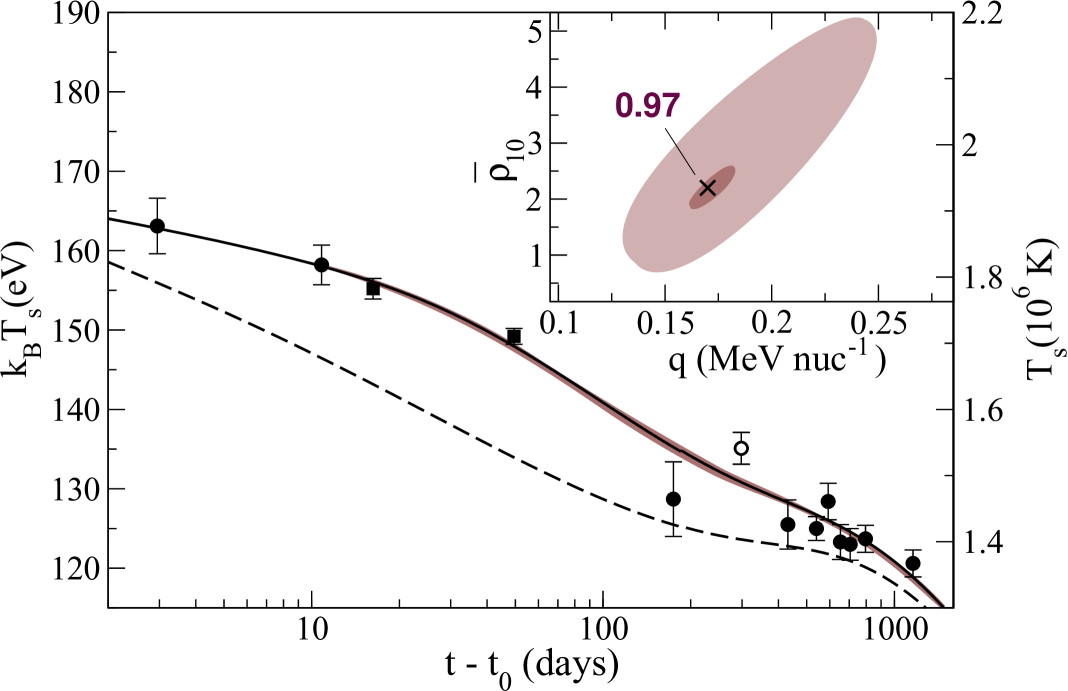
We obtained a thermal evolution that is compatible with a low value in the crust and found that the source reaches thermal equilibrium in days, which fully agrees with the simulations of BC09 and the exponential fits in Cackett et al. (2008). Cooling curves that fit the observations well (light regions with ) are shown in Fig. 7. We found and , the solid curve is the best fit with and , as indicated as a cross in the inset.
EXO 0748676
The quiescent luminosity for this source is higher than the prediction from standard cooling models (Degenaar et al., 2011b), and it has been suggested that residual accretion outside the main accretion period may be responsible for the high temperature (Brown et al. (1998), Rutledge et al. (2000), Colpi et al. (2001)). Nevertheless, the XMM-Newton telescope (which has provided the most sensitive observations) has not shown features in the light curve that are associated with residual accretion (Díaz Trigo et al., 2011). Alternatively, it has been suggested that the core has reached a steady state in which the energy radiated during quiescence equals the heat released by the reactions taking place during outburst. Considering an accretion time of 24 yr and an accretion rate of , a steady state with such a high temperature would be compatible with a recurrence time of 100 yr (Degenaar et al., 2011b), a scenario that cannot be ruled out.
Another peculiarity of this source is the low temperature decrease after outburst: the surface temperature has decreased to a factor of in 650 days, in comparison to 0.5 for MXB 165929 in the same time period. This is again compatible with a high core temperature and a low accretion rate. Another open question is the unknown origin of the power-law component in the spectra.
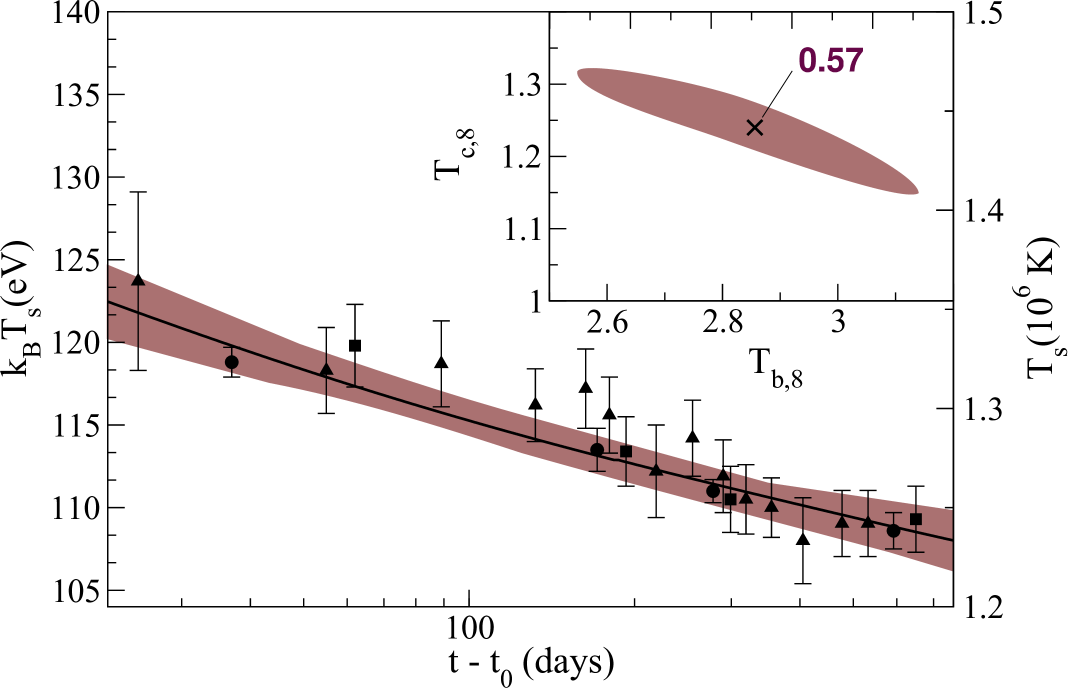
In spite of such peculiarities, the quiescent luminosity of EXO 0748676 can also be very well reproduced by a crustal cooling model with a rather high core temperature 1.25, approx. a factor 3 higher than that of MXB 165929 , which might indicate that EXO 0748676 is a young NS whose core has not yet reached thermal equilibrium. The impurity parameter was fixed to , but given that the source is hot, the results are quite insensitive to variations of . Free parameters varied in the ranges and . The dark regions in Fig. 8 indicate very good fits with ; the best one corresponds to and .
Apparently, there is a shift between the Chandra and Swift observations that is maybe due to cross-calibration problems between the two satellites (Degenaar et al., 2011b). Even more, XMM-Newton and Swift fluxes are compatible, which also points to an offset in the calibration between Chandra and Swift (Díaz Trigo et al., 2011). Because of the small error bars, Chandra data allow for a better constraint of , but these data do not provide information about early times. Conversely, Swift data allow for a better description of the early time, and XMM-Newton data are the most sensitive observations of this source in quiescence and, therefore, the most reliable (Díaz Trigo et al., 2011). We first fit XMM-Newton and Swift data together to find , while Chandra data give . Given this tiny difference, we included all the data in the present analysis444The observation reported in Degenaar et al. (2014) is not included in this work, but we checked that our model can explain it successfully considering core temperatures of . We plan to publish the results in a future work..
5.1 Summary of the crustal coolers
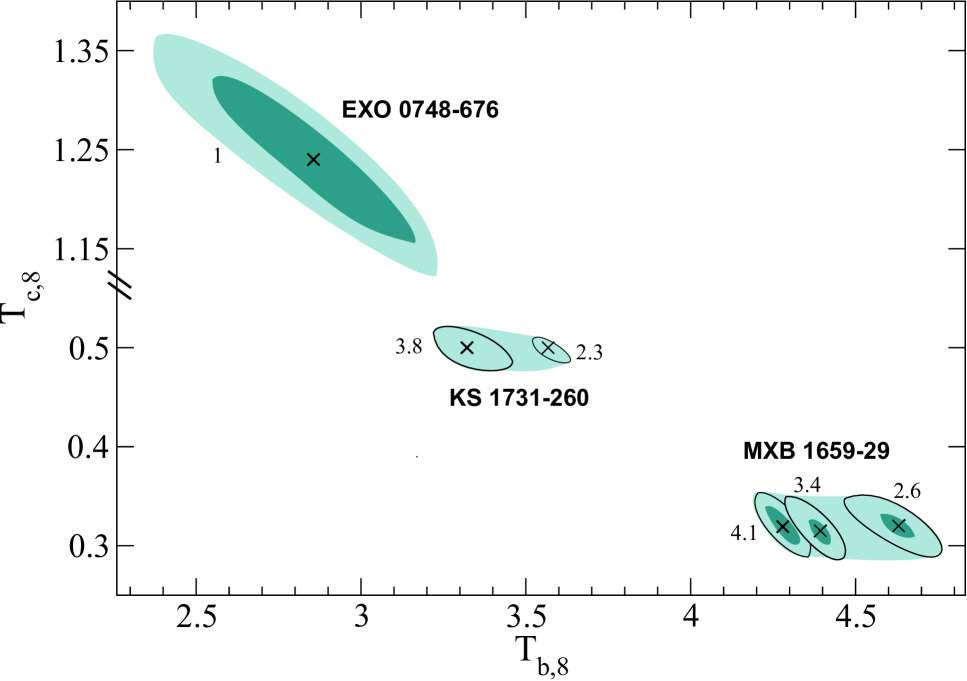
In Fig. 9 we summarized contour plots for the three sources MXB 165929, KS 1731260 and EXO 0748676 in the - parameter space, defined by the conditions (dark and light zones). We chose a M⊙ NS star and a low value of () throughout. We show how the contours for fixed move in the parameter space.
6 Toward a model for crustal coolers: constraining the crust microphysics
This section is devoted to inferring some information about the crust microphysics, and therefore we mainly focus on the new constraints imposed by the last observation of KS 1731260 and on exploring a model that could simultaneously fit the quiescence emission of MXB 165929, KS 1731260, and EXO 0748676.
6.1 Is KS 1731260 still cooling? Constraints on neutron superfluidity energy gaps
The last observations of KS 1731260 reported by Cackett et al. (2010a) seem to indicate that the source is still cooling, and if this is the case, previous models fail to explain the last temperature drop (Fig. 1b). Indeed, for our current set of microphysical inputs, none of the curves obtained by varying , , or succeed in explaining the last observation with (no dark zones in Fig. 9); a longer relaxation time with a more effective storage of heat in the crust is needed. To achieve this, we explored a neutron energy gap for crust superfluidity with a relatively low maximum value, or, alternatively, an energy gap located at deep densities (near the crust-core interface) such that the resulting suppression of the neutron specific heat and the neutrino emissivity is less efficient.
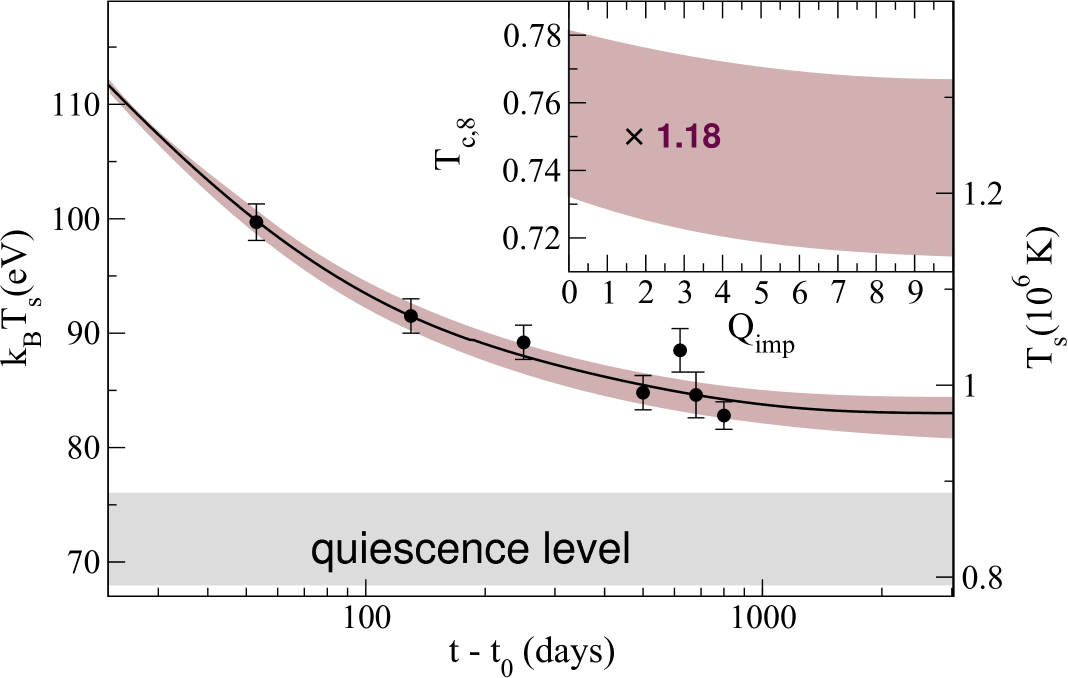
In the results presented up to now we used the gap Sch03, which is similar to that used in BC09 or Sht07, which affects the range g cm-3 with a maximum value of MeV (Fig. 2) and results in a thermal evolution that levels off too fast with the core (dotted-dashed line in Fig. 10. The model we call deep gap (see Fig. 2) has a maximum located at g cm-3, with an accordingly longer thermal relaxation time for the crust. Cooling curves using this deep gap can fit the last data point substantially better (brown dark zones in Fig. 10). A similar effect can be obtained by considering a small gap with maximum value MeV (dashed line in Fig. 2) or any gap contained within the colored regions in Fig. 2. With these new fits a lower is reached; future observations are needed to confirm or refute the predicted core temperature.
6.2 Constraining the impurity parameter
In this subsection we explore the parameter space for the three sources MXB 165929, KS 1731260, and EXO 0748676.
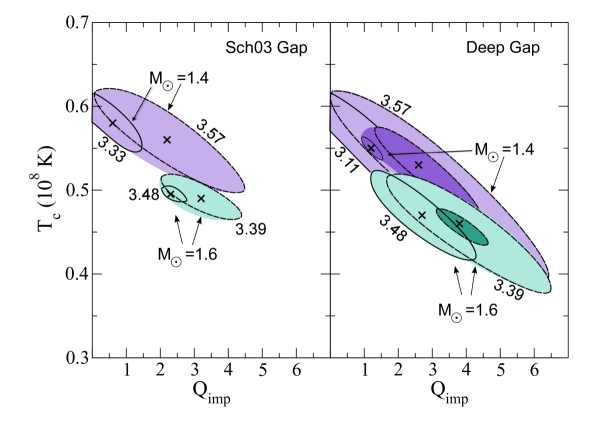
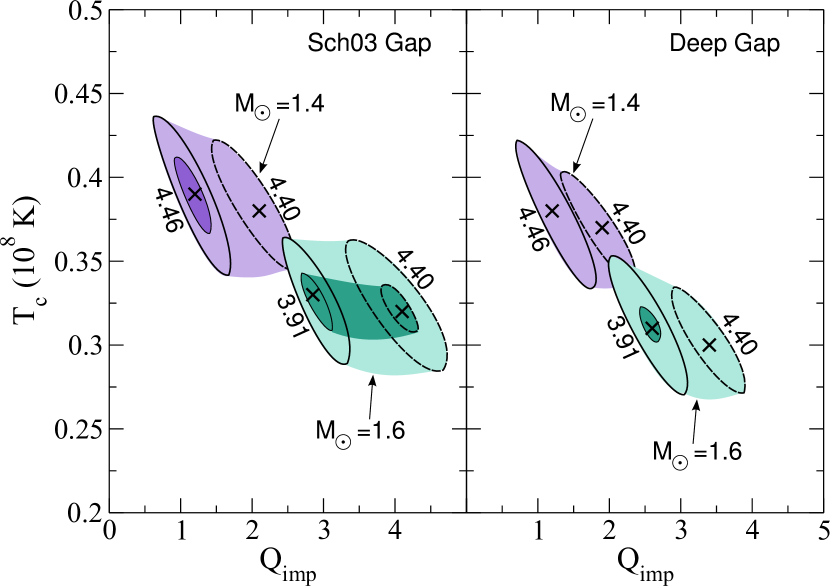
In the left panels of Figs. 11 and 12 we show contour levels corresponding to cooling curves that satisfy the conditions (light regions) and (dark regions) that were obtained for the Sch03 gap and two different masses, M⊙. In right panels, we show the corresponding results for a deep gap. In the different panels we also vary the mass accretion rate within the observational range as much as possible; the ellipses with solid (dashed) contours are calculated for the upper (lower) limit.
First we note some general trends in the figures:
i) is correlated with ; as is increased, the energy released in the inner crust by pycnonuclear reactions is increased and overheats the deep layers. To
balance this effect, must assume a lower value, which raises the thermal conductivity that favors heat transport to the core.
ii) more massive NS has a thinner crust, which reduces the thermal relaxation time, and shows a shift toward higher values.
In particular, for KS 1731260 (Fig. 11), we find that the Sch03 energy gap is unable to fit the data with parameters that satisfy , even when varying the NS mass. However, with the deep energy gap the data can be well fit () with (), and () for M⊙ ( M⊙). In contrast, fits for MXB 165929 (Fig. 12) show that both gaps can fit the data with .
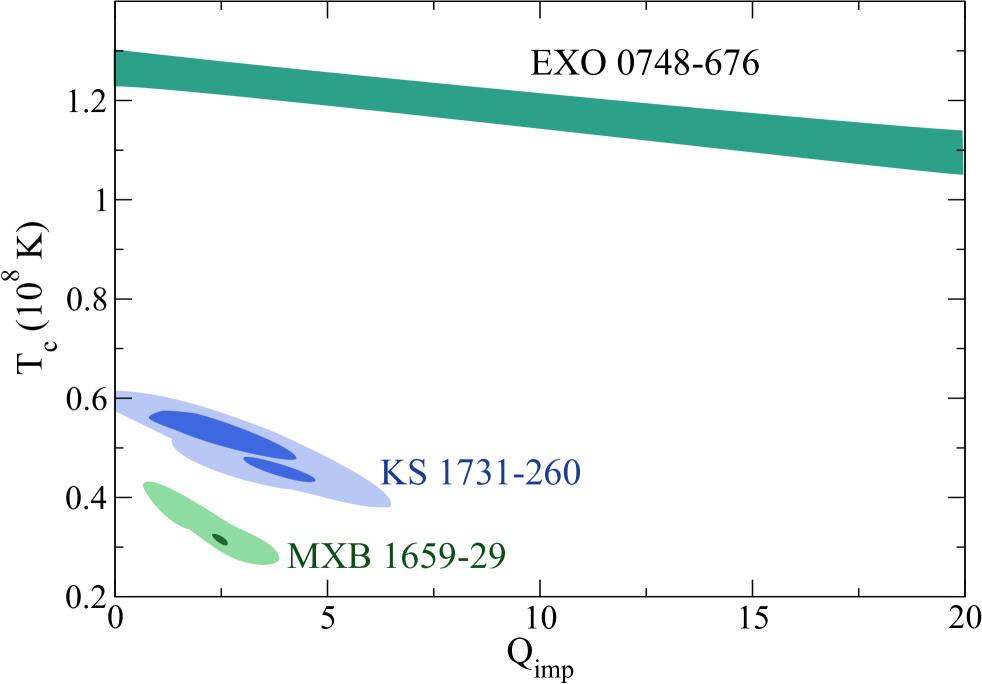
The comparison of these results with those for EXO 0748676 is shown in Fig. 13. Since the last observation of this source was detected at days and the energy gap influences cooling curves only after days, data fits cannot help to distinguish between superfluid models. Remarkably, because at high temperatures ( K) the contribution to the thermal conductivity due to e-impurities scattering is negligible, cooling curves are barely dependent on and the allowed range for it extends to much higher values than for the other two cases.
6.3 General trends in the standard crustal coolers
When comparing results for MXB 165929, KS 1731260 and EXO 0748676 sources (summarized in Tab. 4), we note that while EXO 0748676 shows a higher equilibrium core temperature, , MXB 165929 and KS 1731260 seem to level off at 0.3-0.5. We stress that we obtained good fits () for the three sources with corresponding mass accretion rates compatible with those inferred from observations. Therefore, a model that fits the three sources simultaneously points to the an impurity parameter .
The trend in the fits points to an energy gap for neutron superfluidity with a relatively low maximum value (MeV) or peaked at deep densities close to the crust-core interface ( g cm-3), but this is not conclusive; other processes influencing the contribution of the specific heat and/or the neutrino emissivity may explain the cooling as well.
A star indicates slightly lower values of and than for . The value of is determined by the thermal state of the envelope bottom (at ) at the end of the outburst, and this will set some constraints on the outburst models.
| Source | M | |||||
|---|---|---|---|---|---|---|
| [M⊙] | ||||||
| MXB 165929 | 1.4 | 0.18 | 0.38 | 4.46 | 1.2 | 1.18 |
| \rowcolor[gray]0.9 | 1.6 | 0.18 | 0.31 | 3.91 | 2.6 | 0.94 |
| KS 1731260 | 1.4 | 0.05 | 0.53 | 3.39 | 2.6 | 0.69 |
| \rowcolor[gray]0.9 | 1.6 | 0.05 | 0.46 | 3.57 | 3.8 | 0.87 |
| EXO 0748676 | 1.4 | 0.03 | 1.45 | 2.91 | 1.0 | 0.58 |
| \rowcolor[gray]0.9 | 1.6 | 0.03 | 1.24 | 2.85 | 1.0 | 0.57 |
Based on this analysis, we call these three sources standard crustal coolers; despite their differences, their quiescent emission can be explained by means of the heat released by pycnonuclear reactions deep in the inner crust, as long as the NS crust microphysics, models and boundary conditions (fixing the temperature at the envelope bottom and in the core) are adjusted. For the other two sources, XTE J1701462 and IGR J174802446, these assumptions are not sufficient to account for their quiescent emission and additional heat sources in the outer crust/envelope, residual accretion or new processes affecting the thermal conductivity of the crust have to be assumed, as we discuss next.
7 Beyond crustal cooling
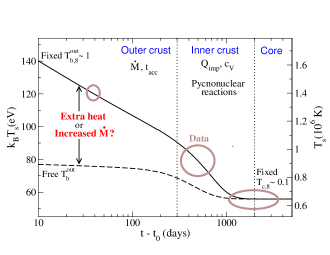
The peculiar observational data of XTE J1701462 and IGR J174802446 require models that include additional considerations beyond the deep crustal cooling model controlled by pycnonuclear reactions and electron captures in the inner crust. In this section we investigate scenarios that could help to understand the quiescent emission for these warm sources: an additional heat deposition in the outer crust, a modified heat flow due to a buried magnetic field, or residual accretion responsible for the increment/variability in the temperature.
7.1 Additional heat in the outer crust?
Previous work on the heat released in the outer crust include the report of Gupta et al. (2007), who calculated the energy liberated by all thermonuclear reactions assuming a one-component plasma and found values 0.2 MeV nuc-1. Later, Horowitz et al. (2008) calculated reaction rates of 24O and 28Ne for a multicomponent plasma and found that a composition in which of the ions are 24O causes reactions that release MeV nuc-1 at g cm-3. This energy could indeed influence the thermal state of the source going into quiescence.
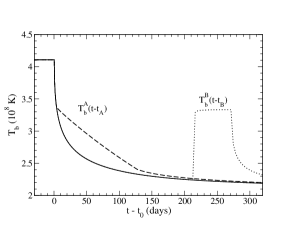
An initial thermal profile that is peaked in the outer crust (typically gr cm-3, see Fig. 14) influences the crustal thermal state and may be a plausible explanation for the break observed at days in XTE J1701462 (Fig. 2d). Additional heat sources located in the outer crust that release high enough energy per nucleon could account for these kind of initial profiles (Fridriksson et al. (2010), BC09, Degenaar & Wijnands (2011a)), as we show next for XTE J1701462 and IGR J174802446.
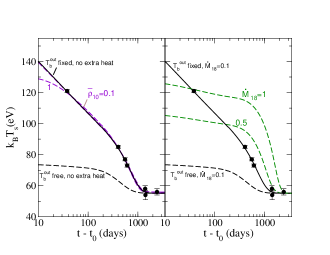
XTE J1701462
This is the most peculiar source: in two observations, XMM-3 and CXO-4, it shows a sudden increase in temperature which so far lacks explanation. Without these two observations, the exponential fit gives the shortest e-folding time of days and the broken power-law fit predicts a break in the slope at about 25–80 days (Fridriksson et al., 2011) (much earlier than the other sources). BC09 suggested that the break is due to the suppression of the specific heat in the transition from a classical to a quantum crystal. They estimated the time at which the break occurs (the diffusion time of the thermal flow from the density at which this transition occurs to the surface) and obtained days, much longer than expected from the data.
It is also difficult to reconcile the early temperature of XTE J1701462 with the latest observations within a cooling model. More specifically, we can easily find a set of parameters for the thermal evolution that explains the first observation at the third day (COX-1) and the tail after days (COX-5 and subsequent), but the problem is to fit the data between and days with the same model.
An alternative explanation for the fast initial drop in temperature are additional heat sources in the outer crust that release energy close enough to the surface for the heat to be rapidly carried away. After this first stage, the temperature evolution should resemble the standard cooling model without additional heat sources. If this is the case, the early data of XTE J1701462 are unique and offer valuable information about the depth of the layer where additional heat is released. The initial thermal profile is modified by the location of heat sources; if we consider shallow sources (), the heat accumulated during the accretion stage mostly diffuses to the surface, keeping the outer crust hot at early times. Instead, if we consider deep sources, the heat is carried toward the interior and is released by neutrino emission from the core, resulting in lower surface temperatures.
We performed simulations considering that the additional heat is located in a shell characterized by the mean density, , at which the energy is deposited and its radial width, . The results presented below are weakly sensitive to in the range m, therefore we kept m fixed and chose a value compatible with observations for an accretion rate of . By varying to adjust the first data (COX-1) and the tail (COX-5 and subsequents), we found that the best fit to the intermediate observations gives and MeV nuc-1 (solid curve in Fig. 15).
Compared with the calculations of Horowitz et al. (2008) for the 24OO reaction555We infer and MeV nuc-1, assuming that only of 24O was burned., our simulations predict a value of for the heat deposition one order of magnitude lower. This difference might be reduced if the effect of neutron skin dynamic is included in the approach, which may result in a significant enhancement of the reaction rate and, hence, a lowering of the corresponding density for the location of the sources.
IGR J174802446
This is the first regular transient with a short active phase of weeks/months showing evidence of crustal cooling. It is remarkable that having been accreting for a much shorter period than the quasi-persistent sources, its thermal flux remains, after 2.2 years, still well above the quiescent emission value detected before outburst. For such a short active phase, it would be expected that the crust reaches a lower temperature.
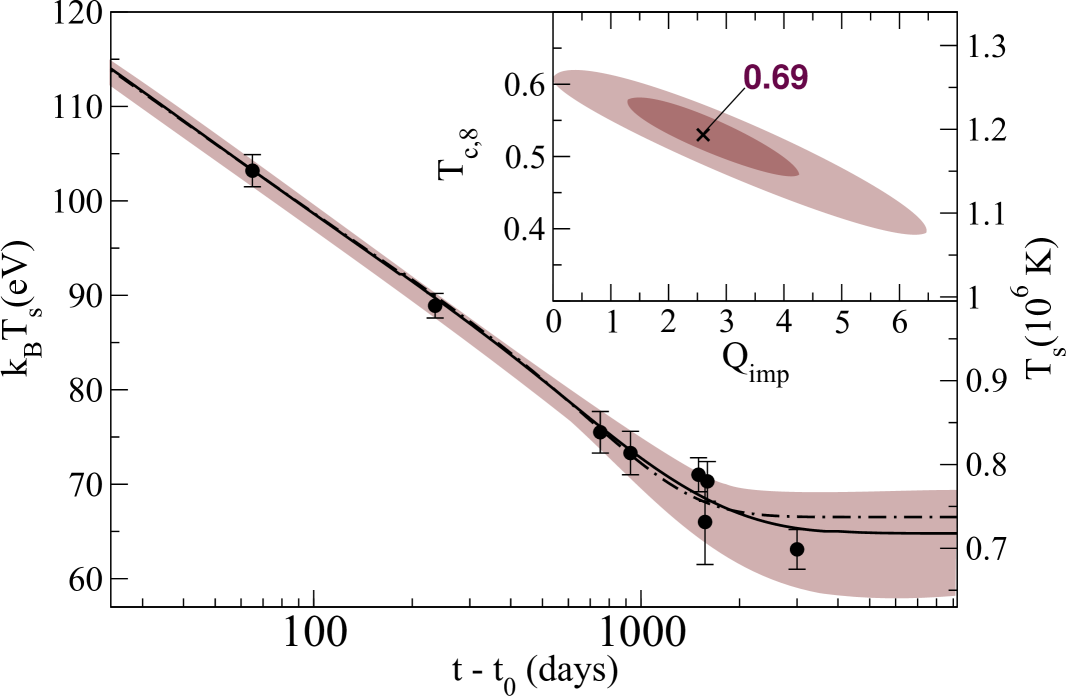
The information on the previous quiescent equilibrium level imposes a constraint on . If we leave as a free parameter in our fits, we find that the NS crust levels off after days at a temperature of , which is far above than the quiescent level before outburst K (see solid curve in Fig. 16), in agreement with the results of Degenaar et al. (2013).
Alternatively, if we fix to the value in the previous quiescence period, all cooling curves underestimate the late-time temperatures (dashed curve in Fig. 17). One possible solution is again an additional heat source (Degenaar & Wijnands, 2011a; Degenaar et al., 2011a); results are plotted in Fig. 17. Models satisfying the condition are shown as light brown region, and the best fit corresponds to MeV nuc-1 and (solid curve). Comparing these results with those found previously for XTE J1701462, we note that these heat sources are extremely intense and deeply located, and its origin can hardly be determined.
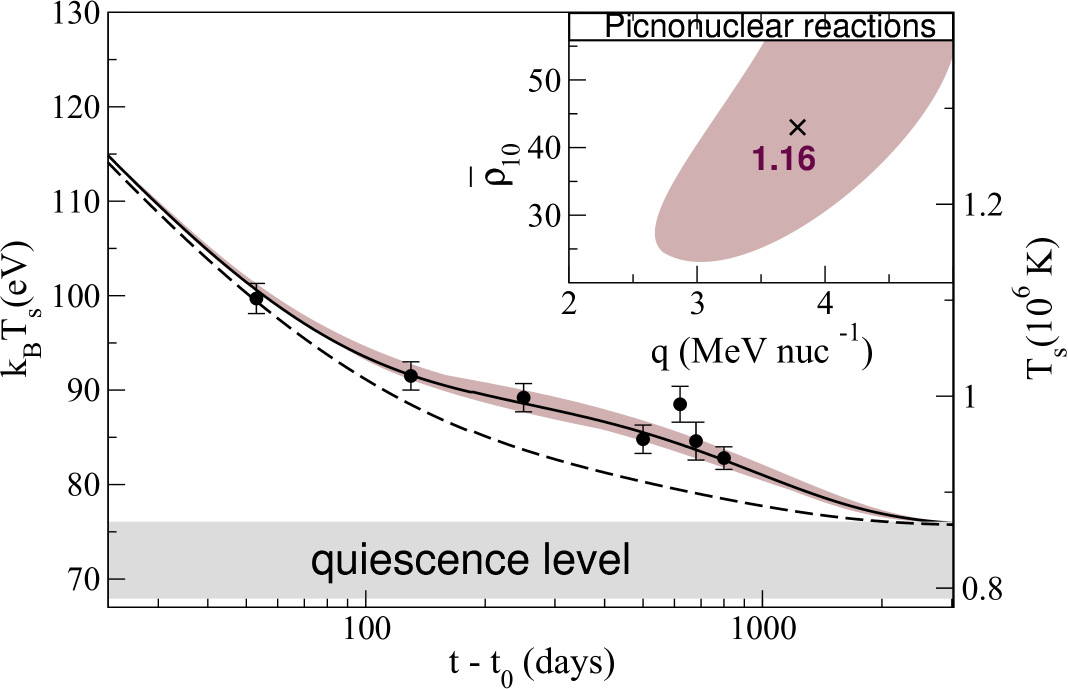
We conclude that there are two different possibilities that can explain the observations of IGR J174802446. First, standard cooling (without additional heat sources) but with an equilibrium temperature well above the value measured in the previous quiescent phase. This can be a consequence of a change in the – relation with respect to the previous quiescent phase (because of a change in the envelope composition during the accretion phase), which could set a higher observed equilibrium level for the same interior temperature (Degenaar et al., 2013). Second, it is also possible to fit the data by fixing in a value compatible with the quiescent band, but then it is necessary to consider very intense additional heat sources whose origin is unclear. Future monitoring of IGR J174802446 will determine if the source has leveled off, favoring the first scenario, or whether it is still cooling, which would indicate non-standard cooling.
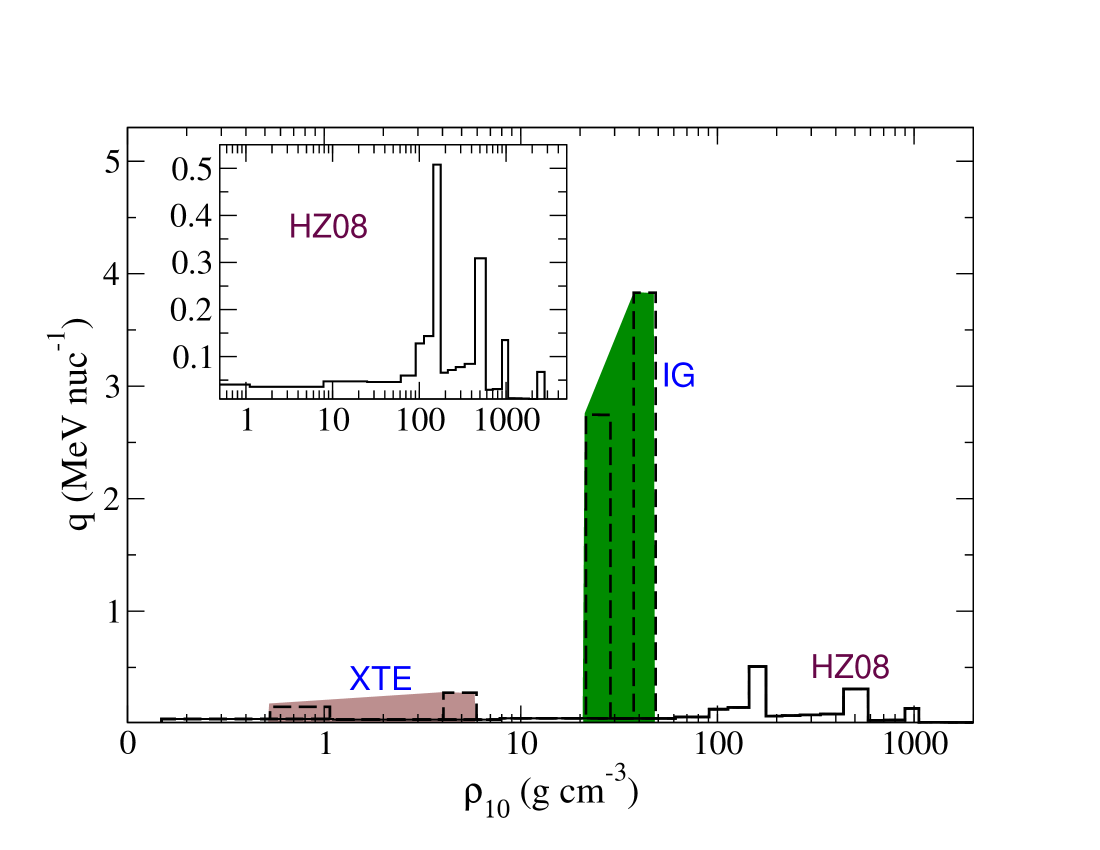
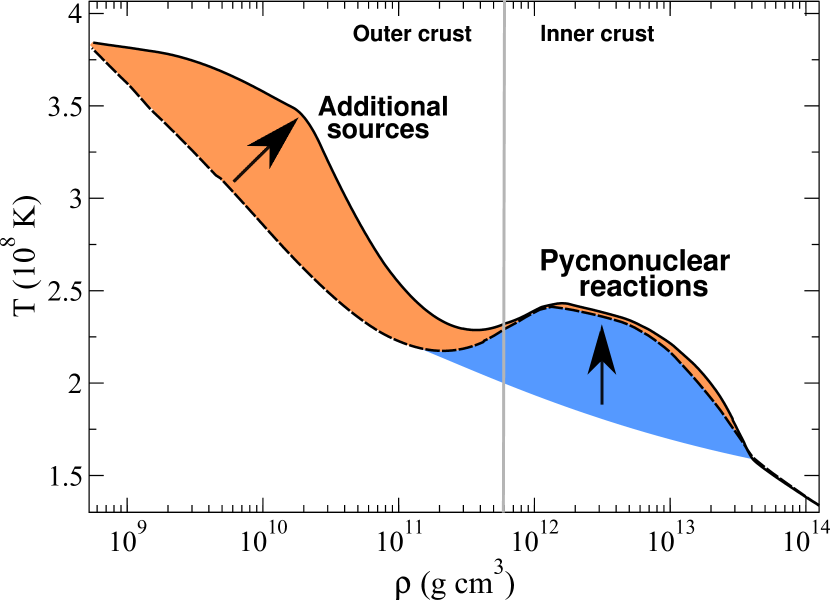
To summarize, in Fig. 18 we compare the additional heat sources needed to explain the quiescent emission of XTE J1701462 and IGR J174802446 with the theoretical calculations of the heat deposited by crustal heating from HZ08. Colored bands illustrate how the source intensity is modified when they are located at different depths. The inset shows the HZ08 results in more detail.
7.2 Buried magnetic field
Another possibility that might explain a warmer outer crust at early times is a low conductivity layer between outer and inner crust. This can be the result of a buried magnetic field, as suggested by Payne & Melatos (2004), if the magnetic field lines are pushed into the crust and concentrate in a thin shell during the accretion period. The thermal conductivity would be highly reduced in the thin layer, and would act as a thermal insulator between outer and inner crust. The cooling curves will be affected by the suppressed thermal conduction, resulting in an accelerated cooling at early times (released of the heat deposited in the outer crust) followed by a slower temperature decrease.
To test this hypothesis, we suppressed the electronic thermal conductivity with a factor in a layer characterized by its radial width, , and the mean density at which the suppression occurs, fixing the accretion rate to the observational value, and . Results show that the parameter range compatible with the observations is and m (Fig. 19) and with a variation of . The minimum is located at and m (with ). To analyze this more exhaustively it is necessary to study the influence of the magnetic field geometry on the results in a 2D model, which is far beyond the scope of this work.
7.3 Residual accretion in XTE J1701462?
As an alternative scenario, we speculate that some data points in the emission of XTE J1701462 may exhibit a higher temperature as a result of residual accretion episodes than a baseline standard cooling. Then we added two residual accretion periods: in the first days the period coincident with CXO-2, XMM-1 and XMM2 and later, at about days, with a duration of days, the period in correlation with XMM-3 and CXO-4. We mimicked the change of the accretion mass rate with a variation of the temperature at the base of the envelope for the periods and as shown in Fig. 20a. We took exponential decay functions with , days, and days for the accretion periods and (Fig. 20a). The corresponding cooling curves with residual accretion included are shown in Fig. 20b. A NS with M⊙ was assumed. The brown region demarcates the curves that fit filled points with . The solid line is the best fit without accretion after ; it predicts that the source is still cooling down. The dashed line is the temperature evolution including and fits the filled symbols plus CXO-2, XMM-1, and XMM2. The dotted line fits all the points, and also XMM-3 and CXO-4 assuming an accretion rate of . Roughly estimated, we need a mean accretion rate of about of the value of during outburst to account for all observations.
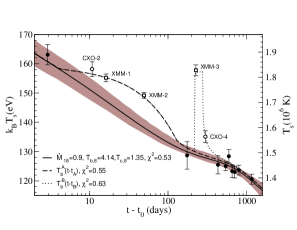
Even though our results show that residual accretion can explain the CXO-2, XMM-1, and XMM-2 observations, Fridriksson et al. (2011) stated that the thermal component outside flares (XMM-3 and CXO-4 observations) is probably not caused by ongoing low-level accretion. This is because the temperature evolution throughout quiescence (excluding flares) presents an smooth and monotonic decrease; if accretion contributed significantly to the thermal emission much more irregular variability would be observed in this component. Moreover, no correlation between thermal and non thermal fluxes outside flares has been observed, whereas both rise together during flares. Nevertheless, residual accretion outside flares is a possibility that cannot be conclusively ruled out.
8 Summary
We have presented detailed numerical models describing the thermal relaxation of the crust following long accretion periods. This was motivated by the increasing number of observations of MXB 165929, KS 1731260, EXO 0748676, XTE J1701462, and IGR J174802446. Our main results are summarized as follows:
-
1.
First, we checked by fitting MXB 165929 observations that the energy released by pycnonuclear reactions (0.05 MeV nuc-1) does not seem to be enough to explain the high initial temperature ( K), which confirms the results of BC09. Therefore, to explain the early slope of the cooling curves of MXB 165929, it its necessary to consider an additional inward-directed heat flux that originates in outer layers.
-
2.
We solved the thermal evolution of the neutron star crust as it cools down taking into account deep crustal heating and we successfully fit MXB 165929, KS 1731260, and EXO 0748676 observations by adjusting the neutron star microphysics. We also obtained, in agreement with previous works, that the impurity content has a low value ().
-
3.
We also studied the influence of neutron superfluidity on the results. MXB 165929 and EXO 0748676 can be modeled with the same microphysics as in BC09. However, KS 1731260 imposes an additional constraint on the neutron energy gap. The last observation suggests a longer relaxation time, which is compatible with an energy gap for neutron superfluidity that has a low value ( MeV) or is peaked at a relatively high density, deep in the inner crust ( g cm-3), although this is not conclusive and other processes such as enhanced specific heat could result in the same effect.
-
4.
We found that XTE J1701462 cannot be explained with a standard crustal cooling model. It requires additional heat sources located in the outer crust, at g cm-3, releasing MeV nuc-1. In addition, we explored alternative scenarios, such as residual accretion during quiescence. Even though this model can explain data, the thermal component outside flares is probably not caused by ongoing low-level accretion (Fridriksson et al., 2011). We also probed the scenario of suppressed electronic thermal conductivity in a thin layer due to a buried magnetic field. We found that the layer must be thin, ( m), and located at g cm-3. For a better description it is necessary to solve a 2D problem considering the magnetic field geometry.
-
5.
The quiescent emission of IGR J174802446 challenges our current understanding of crustal cooling since its thermal flux still remains above the value measured in the previous quiescent phase after spending 2.2 years in quiescence. This is difficult to reconcile with its short outburst (which lasted only two months). In agreement with Degenaar et al. (2013), we found that it is possible to explain the data if we consider that is higher than the one measured in the last quiescent phase. Another possibility are, again, additional heat sources, but in this case, they must be considerably more intense ( MeV nuc-1) and must be located in deeper layers ( g cm-3) than for XTE J1701462.
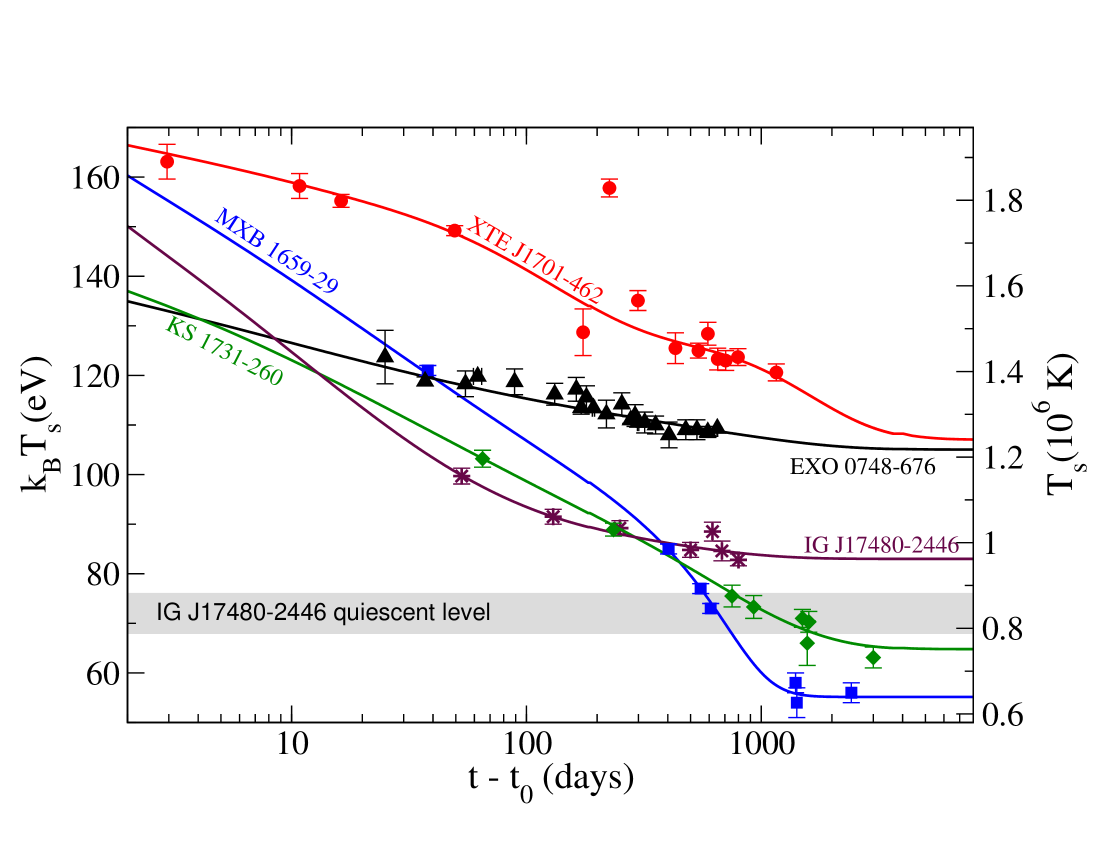
In Fig. 21 we summarize our results, showing the best fits obtained for all the sources. According to this, MXB 165929 and KS 1731260 have already reached thermal equilibrium, with surface temperatures at eV and eV, respectively. EXO 0748676 and IGR J174802446 seem likewise close to equilibrium levels, with temperatures of eV and eV, respectively. On the other hand, XTE J1701462 is still far from thermal equilibrium, which we predict will be reached in several years at the value of eV. This high value is similar to that of EXO 0748676, while the other sources level off at much lower temperatures. XTE J1701462 has an early observation, which provides valuable information about the position and intensity of heat sources in the outer crust. Instead, we do not have information before 30 days for the other sources. An open question is whether the other sources showed an early behavior similar to that of XTE J1701462, for which observational data are lacking.
Acknowledgements.
This research was partially supported by CONICET, PIP-2011-00170 (DNA) and by the grant AYA 2010-21097-C03-02 (JAP). DNA thanks Physics Dept. of Ohio University where part of this project started and Dept. of Applied Physics of Alicante University for warm hospitality.Appendix A Comparison with previous works
A.1 MXB 165929 results with BC09
To check our numerical approach and code, we first compared our results for MXB 165929 with BC09, in which , , and are free parameters (Fig. 22). Similarly as they did, we fixed M⊙, and and explored the behavior of the cooling curves against the variation of and . In Fig. 22 the solid line corresponds to the best fit obtained with and (). The brown zone is with parameters in ranges of and .
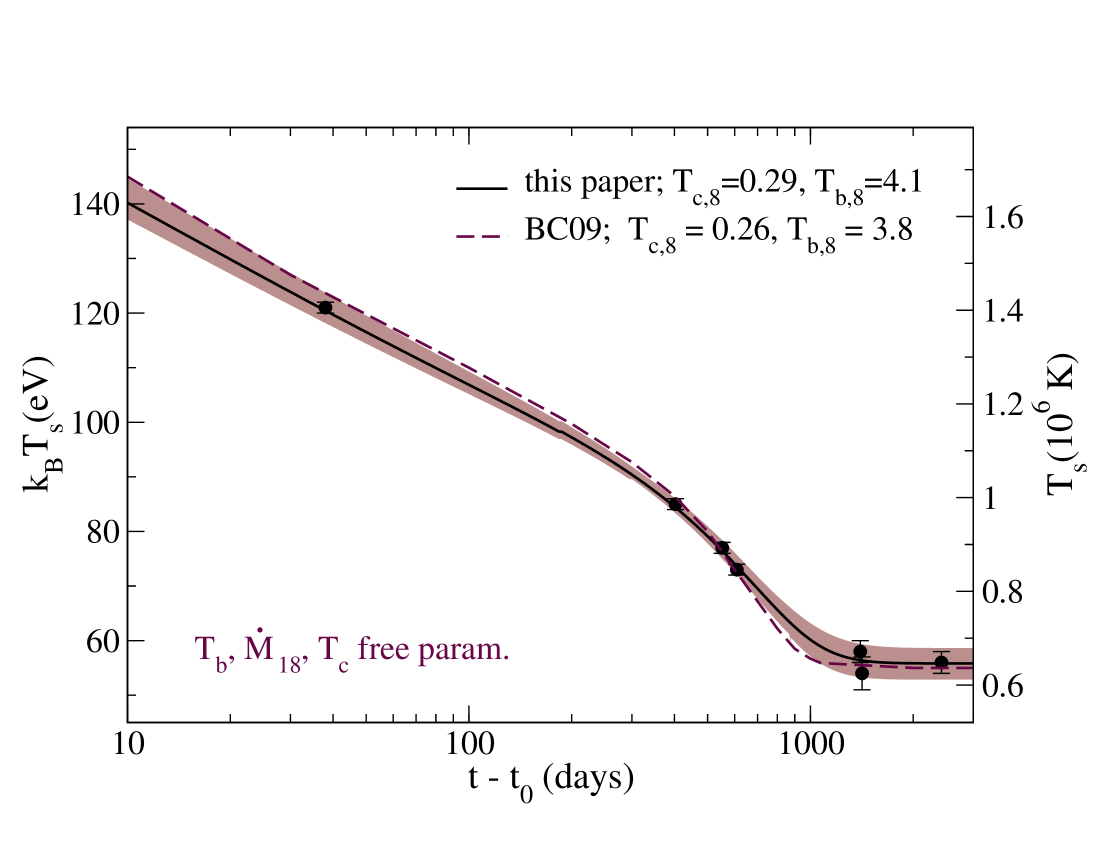
We found that observations can be well described by our cooling curves, and they agree very well with BC09 results (dashed line).
A.2 KS 1731260 results with BC09 and Sht07
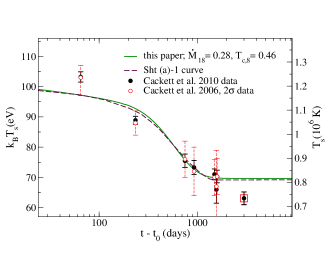
We compare in Fig. 23 our cooling curves for KS 1731260 with previous results of Sht07 (top panel) and BC09 (bottom panel). The dashed line at the top panel is taken from from Sht07, the solid line is our result obtained by letting evolve freely (as in Sec. 4). We considered , and as free parameters and found that the data can be explained with the values , , and . The NS mass is M⊙ and the neutron superfluidity energy gap in the crust is that of Wambach et al. (1993) (moderate-superfluidity case in Sht07). For a better comparison of the results we show in addition to the data of Cackett et al. (2010a) (considered so far) observations from Cackett et al. (2006) (open circles) with 2 error bars, which are the ones considered by Sht07.
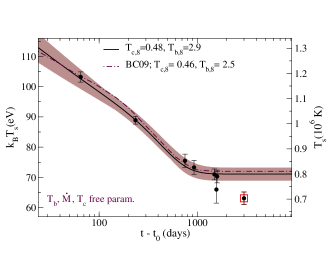
In the bottom panel we compare our results with BC09. Now is fixed during outburst to a constant value (as in Sec. 4), and we simulated with , and left free to vary. The dotted-dashed line was taken from BC09, the solid curve is our best fit with . The brown region corresponds to and with ; all these curves consider (the same value was used in BC09). The NS mass was fixed to M⊙, and we considered the Sch03 energy gap for neutron superfluidity in the crust.
We conclude that our curves agree well with previous results, which make us confident in our work.
References
- Aguilera et al. (2009) Aguilera, D. N., Cirigliano, V., Pons, J. A., Reddy, S., & Sharma, R. 2009, Phys.Rev.Lett., 102, 091101
- Aguilera et al. (2008) Aguilera, D. N., Pons, J. A., & Miralles, J. A. 2008, A&A, 486, 255
- Andersson et al. (2005) Andersson, N., Comer, G. L., & Glampedakis, K. 2005, Nucl. Phys. A, 763, 212
- Baym et al. (1971) Baym, G., Bethe, H. A., & Pethick, C. J. 1971, Nucl. Phys. A, 175, 225
- Bildsten (1997) Bildsten, L. 1997, arXiv:astro-ph/9709094
- Bordas et al. (2010) Bordas, P., Kuulkers, E., Alfonso-Garzón, J., et al. 2010, The Astronomer’s Telegram, 2919, 1
- Brown et al. (1998) Brown, E. F., Bildsten, L., & Rutledge, R. E. 1998, ApJ, 504, L95
- Brown & Cumming (2009) Brown, E. F. & Cumming, A. 2009, ApJ, 698, 1020
- Cackett et al. (2013) Cackett, E. M., Brown, E. F., Cumming, A., et al. 2013, ApJ, 774, 131
- Cackett et al. (2010a) Cackett, E. M., Brown, E. F., Cumming, A., et al. 2010a, ApJ, 722, L137
- Cackett et al. (2010b) Cackett, E. M., Brown, E. F., Miller, J. M., & Wijnands, R. 2010b, ApJ, 720, 1325
- Cackett et al. (2006) Cackett, E. M., Wijnands, R., Linares, M., et al. 2006, MNRAS, 372, 479
- Cackett et al. (2008) Cackett, E. M., Wijnands, R., Miller, J. M., Brown, E. F., & Degenaar, N. 2008, ApJ, 687, L87
- Campana et al. (1998) Campana, S., Colpi, M., Mereghetti, S., Stella, L., & Tavani, M. 1998, A&A Rev., 8, 279
- Chamel (2012) Chamel, N. 2012, Phys.Rev., C85, 035801
- Chamel et al. (2013) Chamel, N., Page, D., & Reddy, S. 2013, Phys.Rev., C87, 035803
- Cirigliano et al. (2011) Cirigliano, V., Reddy, S., & Sharma, R. 2011, Phys.Rev., C84, 045809
- Colpi et al. (2001) Colpi, M., Geppert, U., Page, D., & Possenti, A. 2001, ApJ, 548, L175
- Cooper & Narayan (2005) Cooper, R. L. & Narayan, R. 2005, ApJ, 629, 422
- Cumming et al. (2006) Cumming, A., Macbeth, J., in ’t Zand, J. J. M., & Page, D. 2006, ApJ, 646, 429
- Degenaar et al. (2011a) Degenaar, N., Brown, E. F., & Wijnands, R. 2011a, MNRAS, 418, L152
- Degenaar et al. (2014) Degenaar, N., Medin, Z., Cumming, A., et al. 2014, arXiv 1403.2385
- Degenaar & Wijnands (2011a) Degenaar, N. & Wijnands, R. 2011a, MNRAS, 414, L50
- Degenaar & Wijnands (2011b) Degenaar, N. & Wijnands, R. 2011b, MNRAS, 412, L68
- Degenaar & Wijnands (2012) Degenaar, N. & Wijnands, R. 2012, MNRAS, 422, 581
- Degenaar et al. (2013) Degenaar, N., Wijnands, R., Brown, E. F., et al. 2013, ApJ, 775, 48
- Degenaar et al. (2009) Degenaar, N., Wijnands, R., Wolff, M. T., et al. 2009, MNRAS, 396, L26
- Degenaar et al. (2011b) Degenaar, N., Wolff, M. T., Ray, P. S., et al. 2011b, MNRAS, 412, 1409
- Díaz Trigo et al. (2011) Díaz Trigo, M., Boirin, L., Costantini, E., Méndez, M., & Parmar, A. 2011, A&A, 528, A150
- Douchin & Haensel (2001) Douchin, F. & Haensel, P. 2001, A&A, 380, 151
- Fridriksson et al. (2011) Fridriksson, J. K., Homan, J., Wijnands, R., et al. 2011, ApJ, 736, 162
- Fridriksson et al. (2010) Fridriksson, J. K., Homan, J., Wijnands, R., et al. 2010, ApJ, 714, 270
- Galloway et al. (2008) Galloway, D. K., Muno, M. P., Hartman, J. M., Psaltis, D., & Chakrabarty, D. 2008, ApJS, 179, 360
- Gudmundsson et al. (1983) Gudmundsson, E. H., Pethick, C. J., & Epstein, R. I. 1983, ApJ, 272, 286
- Gupta et al. (2007) Gupta, S., Brown, E. F., Schatz, H., Möller, P., & Kratz, K. 2007, ApJ, 662, 1188
- Haensel & Zdunik (2008) Haensel, P. & Zdunik, J. L. 2008, A&A, 480, 459
- Heinke et al. (2006) Heinke, C. O., Wijnands, R., Cohn, H. N., et al. 2006, ApJ, 651, 1098
- Horowitz et al. (2007) Horowitz, C. J., Berry, D. K., & Brown, E. F. 2007, Phys. Rev. E, 75, 066101
- Horowitz et al. (2009) Horowitz, C. J., Caballero, O. L., & Berry, D. K. 2009, Phys. Rev. E, 79, 026103
- Horowitz et al. (2008) Horowitz, C. J., Dussan, H., & Berry, D. K. 2008, Phys. Rev. C, 77, 045807
- Kaminker et al. (2001) Kaminker, A. D., Haensel, P., & Yakovlev, D. G. 2001, A&A, 373, L17
- Levenfish & Yakovlev (1994) Levenfish, K. P. & Yakovlev, D. G. 1994, Astronomy Reports, 38, 247
- Lewin et al. (1976) Lewin, W. H. G., Hoffman, J. A., Doty, J., & Liller, W. 1976, IAU Circ., 2994, 1
- Medin & Cumming (2014) Medin, Z. & Cumming, A. 2014, Astrophys.J., 783, L3
- Page (2013) Page, D. 2013, Pairing and the Cooling of Neutron Stars, ed. R. A. Broglia & et al. (World Scientific Publishing Co), 324–337
- Page & Reddy (2012) Page, D. & Reddy, S. 2012, ArXiv e-prints
- Page & Reddy (2013) Page, D. & Reddy, S. 2013, Phys.Rev.Lett., 111, 241102
- Parmar et al. (1986) Parmar, A. N., White, N. E., Giommi, P., & Gottwald, M. 1986, ApJ, 308, 199
- Payne & Melatos (2004) Payne, D. J. B. & Melatos, A. 2004, MNRAS, 351, 569
- Pooley et al. (2010) Pooley, D., Homan, J., Heinke, C., et al. 2010, The Astronomer’s Telegram, 2974, 1
- Potekhin et al. (1997) Potekhin, A. Y., Chabrier, G., & Yakovlev, D. G. 1997, A&A, 323, 415
- Remillard et al. (2006) Remillard, R. A., Lin, D., ASM Team at MIT, & NASA/GSFC. 2006, The Astronomer’s Telegram, 696, 1
- Rutledge et al. (2000) Rutledge, R. E., Bildsten, L., Brown, E. F., Pavlov, G. G., & Zavlin, V. E. 2000, ApJ, 529, 985
- Rutledge et al. (2002) Rutledge, R. E., Bildsten, L., Brown, E. F., et al. 2002, ApJ, 580, 413
- Schatz et al. (1999) Schatz, H., Bildsten, L., Cumming, A., & Wiescher, M. 1999, ApJ, 524, 1014
- Schatz et al. (2014) Schatz, H., Gupta, S., M ller, P., et al. 2014, Nature, 505, 62
- Schwenk et al. (2003) Schwenk, A., Friman, B., & Brown, G. E. 2003, Nucl. Phys. A, 713, 191
- Shternin et al. (2007) Shternin, P. S., Yakovlev, D. G., Haensel, P., & Potekhin, A. Y. 2007, MNRAS, 382, L43
- Sunyaev & Kwant Team (1989) Sunyaev, R. & Kwant Team. 1989, IAU Circ., 4839, 1
- Wambach et al. (1993) Wambach, J., Ainsworth, T. L., & Pines, D. 1993, Nucl. Phys. A, 555, 128
- Wijnands et al. (2001) Wijnands, R., Miller, J. M., Markwardt, C., Lewin, W. H. G., & van der Klis, M. 2001, ApJ, 560, L159
- Wijnands et al. (2003) Wijnands, R., Nowak, M., Miller, J. M., et al. 2003, ApJ, 594, 952
- Wolff et al. (2008) Wolff, M., Ray, P., Wood, K., & Wijnands, R. 2008, The Astronomer’s Telegram, 1812, 1
- Yakovlev et al. (2001) Yakovlev, D. G., Kaminker, A. D., Gnedin, O. Y., & Haensel, P. 2001, Phys. Rep, 354, 1