Correlation between ground state and orbital anisotropy in heavy fermion materials
Abstract
The interplay of structural, orbital, charge and spin degrees of freedom is at the heart of many emergent phenomena, including superconductivity. Unraveling the underlying forces of such novel phases is a great challenge because it not only requires understanding each of these degrees of freedom, it also involves accounting for the interplay between them. Cerium-based heavy fermion compounds are an ideal playground for investigating these interdependencies and from our experiments we discover that there is a correlation between orbital anisotropy and the nature of the ground state in this material class. We measured the crystal-electric field ground-state wave functions of the strongly correlated materials CeRh1-xIrxIn5 with great accuracy using linear polarization-dependent soft x-ray absorption spectroscopy. These measurements establish that these wave functions determine the ground state properties of the substitution series, which covers long-range antiferromagnetic order, unconventional superconductivity, and coexistence of these two states. We discuss the impact of certain wave functions on magnetic order and anisotropic hybridization, as well as on the formation of a superconducting ground state. The latter may serve as a guide in the quest for enhancing superconducting transition temperatures, or even for new superconductors.
pacs:
71.27.+a, 71.70.Ch, 74.70.Tx, 78.70.DmWhy do many chemically and structurally highly similar compounds develop different ground states? This seemingly simple question still eludes a straightforward description despite intense research. Yet, it is specifically pressing in view of the quest for a deeper insight into unconventional superconductivity.
We here investigate heavy fermion metals, i.e. rare earth or actinide materials, in which a plethora of phenomena including antiferromagnetism and superconductivity can be observed. In these compounds, the electrons hybridize with the conduction electrons (-hybridization) and, in analogy to the Kondo effect in diluted systems, the local magnetic moments can be screened in these so-called “Kondo lattices” at sufficiently low temperatures. However, the Kondo effect competes with the Ruderman-Kittel-Kasuya-Yosida (RKKY) interaction which typically favors long-range magnetic order. As a result of this competition a quantum phase transition from magnetically ordered to paramagnetic, more itinerant electron behavior can take place. The balance of both interactions depends on the exchange interaction which can be tuned by external parameters such as pressure, magnetic field or doping Gegenwart_2008 . Non-Fermi liquid behaviour and, of interest here, unconventional superconductivity often occur in the vicinity of such quantum critical points. The quantum critical region of heavy fermion phase diagrams shows a striking similarity with cuprate (hole doping) and Fe pnictide (electron doping) phase diagramsBroun_2008 ; Norman_2011 – all have in common an intriguing proximity of superconductivity and magnetism. Here heavy fermion materials may serve as prototypical systems because they can be made chemically very pure and the transitions of interest occur at very low temperatures where phonons are frozen out. In this respect they are the simpler and more straightforward correlated electron system to study.
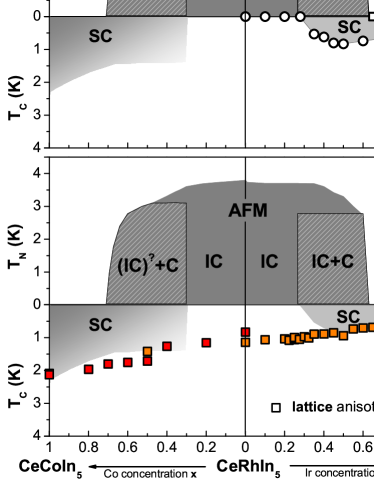
The tetragonal heavy fermion family CeMIn5 with M = Co, Ir, and Rh (HoCoGa5-type structure, see Fig. 1) is ideally suited for studying the interplay of antiferromagnetism, superconductivity and quantum criticality because their properties can be tuned easily by substitution Hegger_2000 ; Petrovic_2001 ; Petrovic_2001a ; Bao_2000 ; Bao_2003 ; Park_2006 ; Thompson_2012 ; Aynajian_2012 . Figure 2a shows the substitution phase diagram of CeRhIn5, where Rh is substituted by Ir or Co Pagliuso_2001 ; Pagliuso_2002a ; Llobet_2005 ; Zapf_2001 ; Yokoyama_2008 ; Yokoyama ; Ohira-Kawamura_2007 ; Ohira-Kawamura . For clarity we show the magnetically ordered and superconducting regions on separate scales (up and down, respectively). CeCoIn5 and CeIrIn5 are superconductors with transition temperatures of Tc = 2.3 and 0.4 K Petrovic_2001 ; Petrovic_2001a . CeRhIn5, however, orders antiferromagnetically at TN = 3.8 K. The magnetic order of CeRhIn5 is incommensurate (IC AF) with the magnetic moments aligned in the plane, propagating in a spiral along the tetragonal -axis Bao_2000 . Substituting Rh with Ir or Co tunes the ground state away from magnetic ordering towards bulk superconductivity by passing through regions where magnetic order and superconductivity coexist, and where – in the case of Ir substitution – a second commensurate magnetic phase has been observed Llobet_2005 . A commensurate phase has also been observed on the Co side, but here the coexistence with the incommensurate order is still a matter of debate, possibly due to uncertainties of the samples’ stoichiometry Yokoyama_2008 ; Yokoyama ; Ohira-Kawamura_2007 ; Ohira-Kawamura . We note that the Fermi surface of CeRhIn5 resembles that of LaRhIn5, i.e. the electron of Ce remains localized and does not contribute to the Fermi surface volume, in contrast to the Ir and Co samples which show enlarged Fermi surfaces volumes, implying a more itinerant electron behaviour Haga_2001 ; Fujimori_2003 ; Harrison_2004 ; Shishido_2005 ; Settai2007 ; Allen2013 , especially in the regions of pure superconductivity PhysRevLett.101.056402 ; Shishido .
On the search for interdependencies of physical parameters and ground state properties Bauer et al. speculated about a linear relationship between lattice anisotropy (here and are the lattice constants) and the superconducting transition temperature Tc for the superconducting plutonium and cerium 115 compounds Bauer_2004 . We however, can see from Fig. 2b that this relationship does not hold for almost half of the phase diagram. The yellow squares in Fig. 2b show the the lattice anisotropy (or rather ) on top of the CeRh1-yCoyIn5 – CeRh1-xIrxIn5 phase diagram. The ratios are calculated from the values given in Ref. Pagliuso_2001 and in the following we will refer to only as lattice anisotropy. Figure 2b shows that Bauer et al.’s scaling works rather well in the purely superconducting regions. However, for magnetically ordered, Rh-rich samples this linear dependency of Tc on obviously breaks down. A closer inspection reveals that even in the region of phase coexistence there are significant deviations from a linear dependency (CeRh1-xIrxIn5 with ). Consequently, the lattice anisotropy has no predictive power concerning the formation of a superconducting ground state, motivating us to look further for another parameter. In the following we concentrate on the CeRh1-xIrxIn5 substitution series because the phase diagram is well defined (see Fig. 2a).
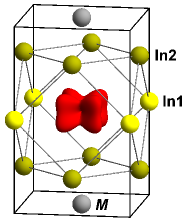
The importance of momentum-dependent hybridization and the impact of the anisotropic crystal-electric field (CEF) ground-state wave functions has been discussed by several groups Pagliuso_2002 ; Thalmeier_2005 ; Burch_2007 ; Flint_2010 ; Haule_2010 ; Pourovskii_2014 . For the heavy fermion compound CeIrIn5 Shim et al. have even made specific predictions on the basis of first principle DMFT calculations Shim_2007 . In particular, their calculations claim that the out-of-plane hybridization is stronger than the in-plane one, and that this is important to make the system more itinerant. Consequently the shape, i.e. the angular distribution, of the orbital which is determined by the CEF should be relevant. This is demonstrated in Fig. 1 where the Ce orbital is drawn within the unit cell of CeIn5. However, such an impact of the CEF on the ground state properties has never been proven experimentally, most likely due to the lack of accuracy of common methods. Here we present results of a systematic investigation of the CEF ground states and the different ground state properties of CeRh1-xIrxIn5 using the soft x-ray absorption technique which specifically targets the ground state wave function. The CeRh1-yCoyIn5 series appears less well suited due to unresolved questions with respect to a possible coexistence of IC and C magnetic order and the exact doping dependence of Tc (cf. Fig.2a).
I Results
I.1 Soft x-ray absorption spectroscopy and choice of samples
We recently started using soft x-ray absorption spectroscopy (XAS) at the rare earth -edges as a new method for measuring CEF ground state wave functions in heavy fermion compounds HansmannPRL100 ; WillersPRB81 ; StrigariPRB86 . Here the dipole selection rules for linearly polarized light provide the sensitivity to the ground state symmetry and allow its determination with unprecedented accuracy. The knowledge of excited states is not required for the ground state analysis as long as the data are taken at low enough temperatures so that only the ground state is populated, nor is data statistics or background hampering the result. This is a great advantage over more conventional methods like inelastic neutron scattering and single-crystal susceptibility.
We have chosen the Ir concentrations = 0, 0.2, 0.3, 0.5, 0.75 and 1 of the CeRh1-xIrxIn5 series for the liner polarized soft XAS experiment. Here = 0 and 0.2 cover the purely incommensurate antiferromagnetic region of the phase diagram with an almost identical TN. The region of phase coexistence, which comprises an incommensurate, a commensurate and a superconducting state, is covered with the = 0.3 and 0.5 samples. We note that in both magnetic phases the magnetic moments are aligned antiferromagnetically in the basal plane and that the region of phase coexistence has been discussed in detail in Ref. Thompson_2012 . The magnetic order decays rapidly with further increasing Ir concentration so that the samples with = 0.75 and 1 are purely superconducting. By this choice we cover all phases of interest with two samples each for our systematic investigation of the orbital anisotropy.
I.2 XAS data of CeRh0.8Ir0.2In5
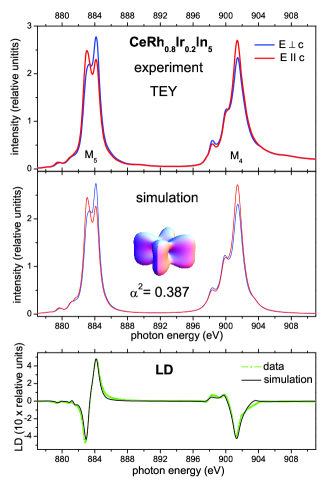
As an example, the top of Fig. 3 shows the total-electron-yield (TEY) intensities of the cerium and edge of CeRh0.8Ir0.2In5 for the two polarizations E (blue) and E (red) at T = 8 K. This temperature is low enough to assure excited CEF states are not populated ( 70 K and 230 K) ChristiansonPRB70 ; ChristiansonPRB66 ; WillersPRB81 , so that the clear difference between the two polarizations is representative for the out-of-plane anisotropy of the ground state orbital. The green dots in the bottom panel of Fig. 3 present the resulting linear dichroism (LD) in a tenfold enlargement. The LD is the difference of the intensities for E and E . The data were then analyzed with an ionic full multiplet calculation (see section Analysis in Materials and Methods).
The CEF ground state in this compound family is a Kramer’s doublet ChristiansonPRB70 ; ChristiansonPRB66 ; WillersPRB81 and can be expressed in terms of as
The quantity determines the out-of-plane anisotropy where () corresponds to a more oblate (prolate) orbital. We find that a ground state with = 0.387 0.005 describes the data (see middle panel of Fig. 3) and in particular the LD (see black line in the bottom panel) very well. The inset visualizes the corresponding orbital. Note, dipole experiments like inelastic neutron scattering or soft XAS determine , so that the sign of cannot be determined.
I.3 Linear dichroism of all compositions
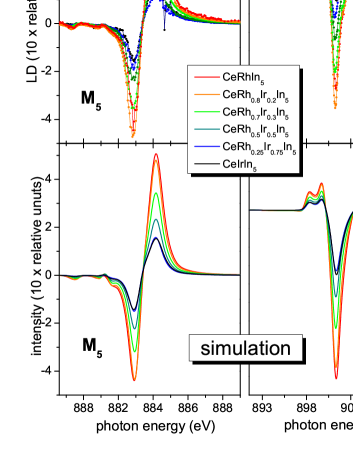
The results for the other Ir concentrations, which were obtained in the same manner, are summarized in Fig. 4. In the top panels of Fig. 4 the measured LD of both edges is depicted for the entire series of CeRh1-xIrxIn5 from = 0 to 1. The LD is largest for the two Rh rich concentrations = 0 and 0.2 (red and orange dots). It then decreases rapidly for the intermediate Ir concentration = 0.3 (light green) and even more so for = 0.5 (dark green). The LD is smallest and almost the same on the Ir rich side ( = 0.75 and 1, light and dark blue dots). The lower panels of Fig. 4 exhibit the corresponding simulated LD, which reproduce nicely the measured strong reduction of the LD with increasing Ir concentration. The resulting orbital anisotropies are listed in Table 1. It is important to note that the LD of the interim compositions cannot be simulated with the respective fractions of the LD of CeRhIn5 and CeIrIn5. This is most obvious for CeRh0.5Ir0.5In5, where 0.5 LD + 0.5 LD would yield an = 0.321 while a value of 0.284 has bee observed. This change of LD indicates that the CEF ground state wave function changes monotonically, but not linearly with the Ir concentration, unlike the lattice anisotropy in Fig. 2b. For completeness we also give the value for CeCoIn5 in Table 1 WillersPRB81 .
II Discussion
II.1 Orbital anisoptroy and phase diagram
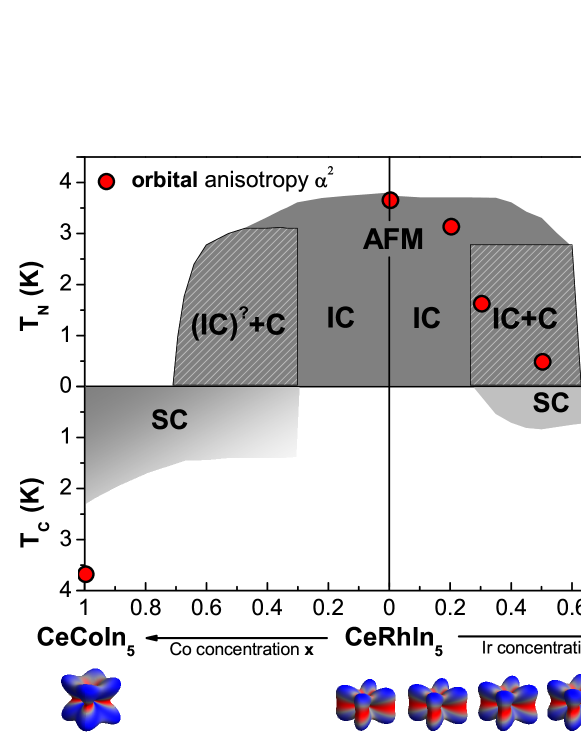
In Fig. 5 the values are plotted as red circles along with the CeRh1-xIrxIn5 phase diagram for illustrating the changes of the wave function with the Ir concentration. The size of the circles corresponds to the error bars. As shown in Fig. 5, we now can observe a clear trend between the value of and the ground state properties of CeRh1-xIrxIn5: The incommensurate antiferromagnetically ordered (IC AFM) samples CeRhIn5 and CeRh0.8Ir0.2In5 on the Rh rich side have almost the same large LD (see also Fig. 4), yielding the largest -values within the series; the -value of the = 0.2 sample being only 5% smaller than the one of the pure Rh compound. In the intermediate region where the three phases coexist, decreases rapidly with . On the Ir rich side of the phase diagram, in the purely superconducting region, is small and levels off, i.e it is identical for CeRh0.25Ir0.75In5 and CeIrIn5.
| sample | CeRhIn5 | CeRh1-xIrxIn5 | CeIrIn5 | CeCoIn5 | |||
|---|---|---|---|---|---|---|---|
| Ir concentration | 0 | 0.2 | 0.3 | 0.5 | 0.75 | 1 | |
| 0.407 | 0.387 | 0.328 | 0.284 | 0.242 | 0.242 | 0.123 | |
| () | 1.31 | 1.30 | 1.24 | 1.23 | 1.20 | 1.20 | 1.20 |
| Ce-In2 (Å) | 3.2775 | - | - | - | - | 3.272 | 3.288 |
Obviously, the superconducting compositions favor the orbitals with smaller values. This becomes even more evident when taking into account CeCoIn5: The value of CeCoIn5 is smallest while it has the highest Tc (Fig. 5). Actually, its value falls rather nicely onto the phase diagram when using the same scaling as for the CeRh1-xIrxIn5 substitution series. This strongly supports our conjecture that is a parameter which correlates with the magnetic as well as the superconducting phases, in contrast to which only serves the superconducting samples.
The implication of the changing Jz contribution on the spatial distribution of the electrons in the CEF ground state is obvious when recalling the pure = is donut shaped, while the pure is yo-yo shaped HansmannPRL100 . Upon going from CeRhIn5 to CeIrIn5 the orbital extends increasingly out-of-plane (see Fig. 5) such that it becomes less oblate with increasing Ir concentration. For CeCoIn5 the orbital is prolate, i.e. has the largest extension in the direction and CeCoIn5 has the highest superconducting transition temperature. We discuss possible correlations and implications in the following.
Intuitively one would expect that the lattice anisotropy follows the orbital anisotropy, a behavior which has been observed e.g. in the Ce-monopnictides Hannan_2004 . However, in the CeIn5 family this is obviously not the case. While the lattice constants of the CeRhxIr1-xIn5 series nicely follow Vegard’s law Pagliuso_2001 , so that the lattice anisotropy in Fig. 2b changes accordingly with the Ir concentration, the orbital anisotropy changes in a strongly non-linear manner (see Fig. 5). Furthermore, while the unit cell becomes shorter along the -axis from Rh to Ir, the orbital extends increasingly out of the plane, suggesting an anti-correlation, rather than a correlation, between the wave function’s flatness and the ratio. However, CeCoIn5 indicates the opposite (i.e. correlating) behavior: in this compound, the orbital is the most extended one along , while the smallest ratio (largest ) is observed. Apparently, there is no obvious systematics between orbital and lattice anisotropy (compare Fig. 2b and Fig. 5).
In Table 1 we also list the calculated paramagnetic moments that correspond to the CEF wave functions of CeRhxIr1-xIn5 and CeCoIn5. If we use the simple ansatz that the strength of the exchange interaction is proportional to the square of the paramagnetic moment, then we observe that does not increase upon going from CeRhIn5 to CeIrIn5 or CeCoIn5; instead, the trend is opposite: it decreases. Consequently, it is questionable whether it is an increase of which changes the balance between the RKKY (T) and the Kondo () interaction strengths such that CeRhIn5 is dominated by the RKKY and CeIrIn5 and CeCoIn5 by the Kondo interaction. There must be another mechanism or condition at play which changes the balance between the two interactions.
The evolution of anisotropy in ground state wave functions reflects the momentum dependence of the Ce – conduction band hybridization. In fact, this very aspect has been addressed by Shim et al. Shim_2007 : their DMFT calculations for CeIrIn5 show the Ce moment to be more strongly coupled to the out-of-plane indium atoms (In2) than to the in-plane indium (In1) despite nearly identical Ce-In bond lengths (see Fig. 1).
Following this line of thought for the other members of the Ce115 family, one would expect that CeCoIn5 would show the least Ce-In(2) hybridization, and consequently should order magnetically since its Ce-In2 distances are largest. In contrast, CeRhIn5 where the Ce and In2 are closer should be more itinerant with respect to CeCoIn5 (see Table 1) Moshopulu_2002 . This naive ansatz predicts a behavior that is opposite to the observed ground state properties of the CeIn5 compounds. This apparent contradiction is resolved by our experimental findings which reveal that the spatial distribution of the wave function dictates the ground state: the orbital of CeCoIn5 has the largest extension in the direction, so that the large Ce-In2 distances are (over)compensated and an itinerant, nonmagnetic ground state forms. In CeRhIn5, where the small orbital extension in the -direction leads to a reduction of the hybridization, the ground state is magnetically ordered. Our findings provide experimental evidence for the Shim et al. conjecture that the out-of-plane hybridization is important.
How does this fit with the observed linear correlation between the lattice anisotropy and Tc for the superconducting plutonium and cerium 115 compounds Bauer_2004 ? We already noted that this only holds for the superconducting compositions, so that the ratio by itself cannot be used to predict whether a compound becomes superconducting. For example, the ratio of CeRhIn5 would indicate a finite Tc at ambient pressure, while in reality no superconductivity has been recorded (see Fig. 2b). Here, we infer that is the parameter that distinguishes superconducting from non-superconducting compounds. Once the purely superconducting region of the phase diagram has been reached, does not change any more and the ratio seemingly tunes Tc.
Our observation shows that the orbital anisotropy is the driving parameter for the -hybridization, eventually resulting in superconductivity. We emphasize that the degree of hybridization has been measured by independent experiments. The stronger -hybridization of the superconducting compounds CeIrIn5 and CeCoIn5 is reflected in a larger Fermi surface Haga_2001 ; Fujimori_2003 ; Harrison_2004 ; Shishido_2005 ; Settai2007 ; Allen2013 and also in a larger quasielastic line width. For the latter, inelastic neutron scattering on powder samples found a line width of HWHM 1.4 meV for the magnetically ordering Rh compound and line widths at least twice as large for CeIrIn5 and CeCoIn5 WillersPRB81 .
II.2 Summary
In summary, the CEF ground state wave functions of the CeRh1-xIrxIn5 substitution series have been determined and a clear correlation between ground state properties and wave functions has been observed. These findings suggest the ground state orbital plays a decisive role in the detailed balance of RKKY and Kondo interactions and may explain why these seemingly similar materials have different ground states. More generally, anisotropic hybridization, in addition to , must be a necessary component in an appropriate description of Kondo lattice materials and of the evolution of their ground states as a function of a non-thermal tuning parameter.
III Materials and Methods
III.1 Samples
High-quality single crystals of CeRh1-xIrxIn5 were grown by flux-growth and well characterized by magnetic susceptibility and/or heat capacity to ensure their nominal composition is in accordance with the phase diagram Pagliuso_2001 ; Llobet_2005 . Before the absorption experiment all crystals were aligned within 1-2∘ by Laue x-ray diffraction.
III.2 Method
The linearly polarized soft XAS experiment was performed at the European Synchrotron Radiation Facility (ESRF) in Grenoble, France, at the ID08 undulator beamline. We recorded the Ce -edge absorption spectra in the total electron yield mode (TEY). The energy resolution at the edges ( eV) was set to 0.2 eV. The samples were cleaved in situ in an ultra high vacuum chamber with a pressure of 2 x 10⁻¹⁰ mbar at 8 K. The edges were recorded for light polarized parallel (E ) and perpendicular (E ) to the tetragonal axis. Here the undulator beamline has the advantage that for normal incidence the polarization can be changed without moving the sample, so that the same sample spot is probed for both polarization directions. For each sample different spots were probed in order to rule out sample inhomogeneities. The data of CeRh1-xIrxIn5 were taken at 8 K for the four Ir substitutions = 0.2, 0.3, 0.5, and 0.75. The excited CEF states are above 5 meV ( K) ChristiansonPRB70 ; ChristiansonPRB66 ; WillersPRB81 so that at 8 K only the ground state is probed. The data of CeRhIn5 ( = 0), CeIrIn5 ( = 1), and also of CeCoIn5 were taken in a previous experiment WillersPRB81 . For the data analysis all data were normalized to the intensity of the isotropic spectra Iiso = (2IE⊥c + IE||c)/3.
III.3 Analysis
The XAS data have been simulated with ionic full multiplet calculations based on the XTLS 8.3 program TanakaJPSC63 . The atomic parameters are given by reduced Hartree-Fock values. The reduction accounts for the configuration interaction which is not included in the Hartree-Fock calculations and is determined from fitting the isotropic spectra Iiso. Typical reductions are about 40% for the Coulomb interactions and about 20% for the interactions HansmannPRL100 ; WillersPRB81 ; StrigariPRB86 . In the present manuscript the LD of the end members of the series were analyzed in the same manner as for the substitution series investigated here.
Acknowledgements.
We thank P. Thalmeier for fruitful discussions. The wave function density plots were calculated using the CrystalFieldTheory package for Mathematica written by M. W. Haverkort. Support from the German funding agency DFG under Grant No. 583872 is gratefully acknowledged. Work at LANL was performed under the auspices of the U.S. DOE, Office of Basic Energy Sciences, Division of Materials Sciences and Engineering.References
- (1) Gegenwart, P., Si, Q. & Steglich, F. Nature Phys. 4, 186 (2008).
- (2) Broun, D. Nature Phys. 4, 170 (2008).
- (3) Norman, M. R. Science 332, 196 (2011).
- (4) Hegger, H. et al. Phys. Rev. Lett. 84, 4986 (2000).
- (5) Petrovic, C. et al. J. Phys.: Condens. Matter 13, L337 (2001).
- (6) Petrovic, C. et al. Europhys. Lett. 53, 354–359 (2001).
- (7) Bao, W. et al. Phys. Rev. B 62, R14621–R14624 (2000).
- (8) Bao, W. et al. Phys. Rev. B 67, 099903(E) (2003).
- (9) Park, T. et al. Nature 65, 440 (2006).
- (10) Thompson, J. D. & Fisk, Z. J. Phys. Soc. Jpn. 81, 011002 (2012). And references therein.
- (11) Aynajian, P. et al. Nature 486, 201 (2012).
- (12) Pagliuso, P. G. et al. Phys. Rev. B 64, 100503 (2001).
- (13) Pagliuso, P. G. et al. Physica B 312-313, 129 (2002).
- (14) Llobet, A. et al. Phys. Rev. Lett. 95, 217002 (2005).
- (15) Zapf, V. S. et al. Phys. Rev. B 65, 014506 (2001).
- (16) Yokoyama, M. et al. Phys. Rev. B 77, 224501 (2008).
- (17) Yokoyama, M. et al. Physica B 403, 812 (2008).
- (18) Ohira-Kawamura, S. et al. Phys. Rev. B 76, 132507 (2007).
- (19) Ohira-Kawamura, S. et al. Physica B 403, 812 (2008).
- (20) Haga, Y. et al. Phys. Rev. B 63, 060503 (2001).
- (21) Fujimori, S.-I. et al. Phys. Rev. B 67, 144507 (2003).
- (22) Harrison, N. et al. Phys. Rev. Lett. 93, 186405 (2004).
- (23) Shishido, H., Settai, R., Harima, H. & Onuki, Y. J. Phys. Soc. Jpn. 74, 1103 (2005).
- (24) Settai, R., Takeuchi, T. & Onuki, Y. J. Phys. Soc. Jpn. 76, 051003 (2007).
- (25) Allen, M. P. et al. Nat. Phys. 9, 468 (2013).
- (26) Goh, S. K. et al. Phys. Rev. Lett. 101, 056402 (2008).
- (27) Shishido, H., Settai, R., Kawai, T., Harima, H. & Onuki, Y. J. Mag. Mag. Mat. 310, 303 (2007).
- (28) Bauer, E. D. et al. Phys. Rev. Lett. 93, 147005 (2004).
- (29) Pagliuso, P. G. et al. Physica B 320, 370–375 (2002).
- (30) Thalmeier, P. & Zwicknagl, G. Handbook on the Physics and Chemistry of Rare Earths, vol. 34 (Ed K.A. Gschneider, Jr., J.-C.G. Bünzli and V.K. Pecharsky, 2005). And references therein.
- (31) Burch, K. S. et al. Phys. Rev. B 75, 054523 (2007).
- (32) Flint, R. & Coleman, P. Phys. Rev. Lett. 105, 246404 (2010).
- (33) Haule, K., Yee, C.-H. & Kim, K. Phys. Rev. B 81, 195107 (2010).
- (34) Pourovskii, L. V., Hansmann, P., Ferrero, M. & Georges, A. Phys. Rev. Lett. 112, 106407 (2014).
- (35) Shim, J. H., Haule, K. & Kotliar, G. Science 318, 1615 (2007).
- (36) Hansmann, P. et al. Phys. Rev. Lett. 100, 066405 (2008).
- (37) Willers, T. et al. Phys. Rev. B 81, 195114 (2010).
- (38) Strigari, F. et al. Phys. Rev. B 86, 081105 (2012).
- (39) Christianson, A. D. et al. Phys. Rev. B 70, 134505 (2004).
- (40) Christianson, A. D. et al. Phys. Rev. B 66, 193102 (2002).
- (41) Hannan, A. et al. J. Phys. Soc. Jpn. 73, 1881 (2004).
- (42) Moshopoulou, E. G. et al. Appl. Phys. A Suppl 74, 895 (2002).
- (43) Tanaka, A. & Jo, T. J. Phys. Soc. Jpn. 63, 2788 (1994).