Electronically driven fragmentation of Ag nanocrystals revealed by ultrafast electron crystallography
Abstract
We report a ultrafast electron diffraction study of silver nanocrystals under surface plasmon resonance excitation, leading to a concerted fragmentation. By examining simultaneously transient structural, thermal, and Coulombic signatures of the prefragmented state, an electronically driven nonthermal fragmentation scenario is proposed.
pacs:
36.40.Gk, 73.22.Lp, 78.67.Bf, 61.05.J-The ability to image defect growth processes is central to the understanding of the electronically induced structural phase transitions in solids Nasu (2004); Collet et al. (2003); Qazilbash et al. (2007). Whereas optical and photoemission studies have provided significant insights into the initial electronic processes that are strongly coupled to lattice degrees of freedom, the mechanism bridging the femtosecond (fs) optical seeding to the picosecond(ps)-to-nanosecond(ns) macroscopic structural changes remains a central topic to be elucidated. Recent developments in ultrafast diffraction techniques have enabled direct probing of atomic dynamics and helped accentuate the important role of electronic excitation in initiating coherent motions Bargheer et al. (2004), bond dilation Baum et al. (2007); Fritz et al. (2007) and structural transformations Ruan et al. (2004); Gedik et al. (2007); Siwick et al. (2003). Here, employing ultrafast electron nanoscale crystallography Ruan et al. (2009), we demonstrate a direct structural study of spatially inhomogeneous processes in Ag nanocrystals (NCs) induced via surface plasmon resonance (SPR) excitation. Contrary to an impulsive process leading to fragmentation, we find that the dominant dynamical feature in the prefragmentation stage is a defect-mediated instability growth, creating sub-nanocrystalline domains with hot surface and relatively cold core. Electronic effects are proposed to account for the incipient creation and subsequent growth of lattice inhomogeneities directly responsible for fragmentation, which are corroborated by the evidences of correlated charge localization and defect percolation on the picosecond timescale following photoexcitation.
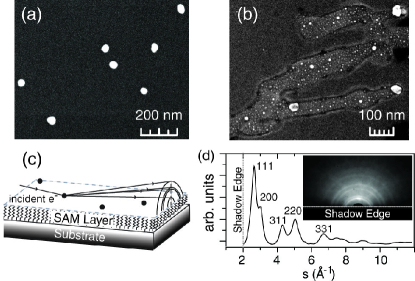
Photoinduced fragmentation of NCs has been a subject of recent intense interests, with a range of results favoring either thermal ablation Takami et al. (1999); Inasawa et al. (2005), or a nonthermal pathway involving charging of the nanoparticles Kamat et al. (1998); Link et al. (2000); Redmond et al. (2007); Muto et al. (2008) or creation of strong fields Plech et al. (2006). The mechanism for photoinduced structural changes appears to depend on the pulse duration Schaffer et al. (2001), with the surrounding solvent limiting the thermal dissipation Hartland (2004). Using ultrafast electron crystallography (UEC) Ruan et al. (2009), we have directly probed the transient structures of the NCs up to the ablation limit, and identified the transient dynamical structures and the charge states. In contrast to earlier colloidal suspensions studies, this experiment is conducted in vacuum with sufficient dispersion of nanoparticles to avoid long-range surface plasmon induced interaction and solvent effect. Colloidal silver NCs (Ted Pella, 407 nm) are dispersed ex-situ on a silicon substrate functionalized with a self-assembled monolayer (SAM) of alkane-silane ((3-Aminopropyl)trimethoxysilane or APTMS, Ted Pella) molecules that suppress substrate signals. SEM characterization of the sample showed uniform coverage, with low mean areal density of 7 NC per (Fig. 1(a)). First, the NCs are irradiated using ultrafast laser pulse (50 fs, p-polarized, 45∘ incidence) at 400 nm, which is within their SPR bandwidth ( nm), to check for traces of fragmentation. At a critical fluence F=22 mJ/cm2 (multi-shot) SPR excitation leads to fragmentation into predominantly 2 nm NCs, as shown in Fig. 1(b). Prior to such laser excitation, the UEC patterns obtained from these randomly oriented NC samples resemble a ‘powder diffraction’ pattern, as shown in Fig. 1(c). The 1D structure function deduced via a radial averaging of these 2D patterns Ruan et al. (2009) displays clear fcc symmetry (Fig. 1(d). We subsequently probe the transient structures and the atomic rearrangements using laser fluence just below the critical fragmentation fluence. Sample integrity was retained during pump-probe cycles of UEC, as confirmed by SEM imaging following the conclusion of experiment.
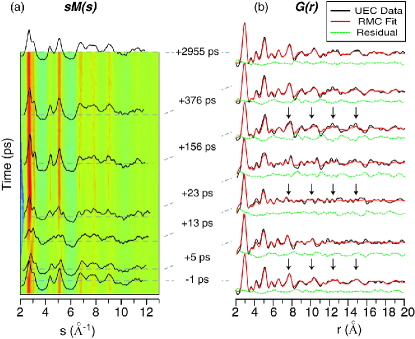
The gross features of photoinduced structural changes are evident from the transient alteration of the normalized structure function Ruan et al. (2009) , ( is the electron scattering wave-vector) obtained at the prefragmenting fluence 17 mJ/cm2, shown in Fig. 2(a). By 13 ps, the initial fcc ordered diffraction maxima diminish while the nearby diffusive scattering gain strength and grow into multiple peaks, indicating a departure from the cubic symmetry. The reduction of long-range order is evident from the corresponding pair correlation function Ruan et al. (2009), obtained via a Fourier analysis of the diffraction patterns, as shown in Fig. 2(b). The atom-atom correlation peaks greater than 10 Å in smear out completely by 13 ps, whereas the short-range peaks ( 10 Å) retain their strength, thereby indicating the persistence of short-range order during the pre-fragmentation process.
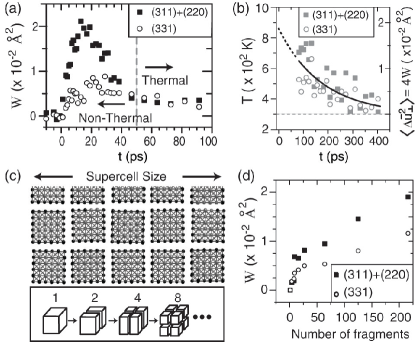
To identify the origins of this structural disorder, we first calculate from each Bragg intensity a parameter ln . is closely related to the mean-square displacement of atoms (4W= ) - a tool often used in cases of quasi-equilibrium conditions to extract lattice temperature via the Debye-Waller relation. In such cases, is independent of the diffraction order used Raman et al. (2008). However, we find here (Fig. 3(a)) that for ps, determined from higher order (331) peak is smaller than that from the lower order (311) and (220) peaks, indicating the nonthermal nature of the structure disordering process. We will argue that this anisotropy in is the manifestation of a unique structural change that destroys the long-range coherence within NCs acting as a precursor to the fragmentation observed above the critical fluence. At longer times ( ps), shows no -dependence, thus allowing us to reliably extract the lattice temperature from Raman et al. (2008), shown in Fig. 3(b). The temperature decay is in good agreement with an interface limited thermal relaxation model based on thermal conductivity of the SAM EPA and suggests a temperature rise in NCs of at most K at early times, which is insufficient to cause thermal ablation. To capture the essence of this nonthermal transformation, we carry out a simulation of diffraction signatures expected from NC fragmentation. Starting from a supercell structure for the NC, we fragment (subdivide) the supercell into smaller units as illustrated in Fig. 3(c). The separation between fragments and their relative orientations is altered randomly so as to remove any inter fragment correlations. Such fragmented assemblies are generated for several fragmentation numbers, following which, the intensity from the fragmented assembly is computed for each case. The lattice temperature is maintained (at 300 K), so that any changes evident in the intensities arise solely from the fragmentation process. The parameter extracted from these ‘simulated’ is shown in Fig. 3(d), and exhibits the same anisotropy trend seen in the experiment. A qualitative agreement in the scale of anisotropy seen in the experiment and simulation is reached when the number of fragments exceed 100, corresponding to an individual fragment size of nm, which is close to the average fragment sizes observed in the SEM image (Fig. 1(b)). These results indicate that a nonthermal restructuring (prefragmentation) rather than a thermal disorder better explains the experimental observations.
To find out the role of Coulombic forces in the fragmentation of the NCs, we examine two relevant processes leading to charging of the NCs: photoemission and charge transfer between the NCs and the supporting surface. To determine the photoemission yield, we use a projection imaging method Raman et al. (2009) illustrated in Fig. 4(a,b), where surface scattered electrons originating from point P intercept the laser-induced vacuum emitted charge cloud, thus casting its shadow on the CCD. By analyzing the normalized shadow images of the electron cloud, we can extract the density of photoemitted electrons, which we find to double (to 7.9 e/cm2) in the presence of NCs relative to that from a bare Si surface, as evident from Fig. 4(c). This enhancement is significant considering the NCs occupy less than of the surface. Similar photoemission enhancement from Ag NCs has been observed in other studies as well and attributed to SPR assisted multiphoton processes Lehmann et al. (2000). In addition to this, we observe another competing, SPR enhanced localized charge transfer channel between NCs and the substrate, that causes even more pronounced charging of the NCs. We quantify this process via a diffractive voltammetry approach Ruan et al. (2009); Murdick et al. (2008); Raman et al. (2009) as illustrated in Fig. 4(d). Recall that the Ag NCs sit on top of a SAM layer, which produces its own diffraction signal in the form of a strong (001) peak at 2.75 Å-1. Any interfacial charge transfer between the Ag NC and the substrate leads to the creation of a transient field at the Ag NC/SAM/Si interface, causing a refraction shift of probing electron beam traversing the region in between. Thus, from the shift of the (001) SAM peak, we numerically compute the corresponding interfacial field (and potential ). Based on an interfacial capacitance C=7.5 attofarad, we thus determine a maximum average charging per NC of 400 e+ , which is in contrast to 0.2 e+ estimated from the vacuum emission measurement. This corresponds to a Coulomb fissility ratio , where is the number of atoms within the NC, which is below the direct Coulomb fissility regime () Muto et al. (2008).
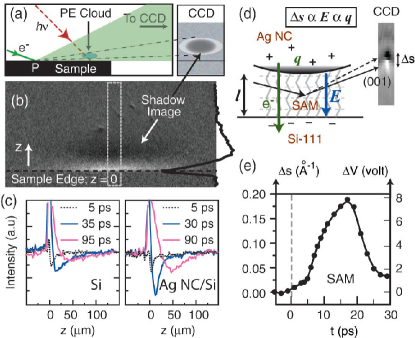
Our observation is consistent with a progressive Coulomb-induced fragmentation scenario proposed by Kamat and coworkers Kamat et al. (1998). The transient charging curve (Fig. 4(e)) shows an initial 6 ps incubation period for charge redistribution at NC interface which is absent at non-SPR excitations Ruan et al. (2009), and is thus indicative of transient trapping of positive charges at the excitation sites. The migration of charges to the interface and the accompanied rise of interfacial field (Fig. 4(e)) is hindered as the lattice is undergoing atomic restructuring during this incubation period, which also coincides with the period of - anisotropy (Fig 3(a)).
The observed correlation between the atomic process and charge trapping suggests that local valence instabilities which cause bond softening Fritz et al. (2007) lead to structural defects and charge localization as seen in our studies. Earlier studies of fs laser induced melting in metals using optical and photoemission techniques have revealed that interband transitions Guo et al. (2000) and thermionic emission Grua et al. (2003) can both lead to rapid bond softening within the initial non-equilibrium time scales of core hole lifetime ( 100 fs) and electron-phonon coupling time ( 1 ps) Del Fatti et al. (2000). In Ag, the nonlinear interband excitation involving inner valence shell () is found to be strongly coupled to the SPR dephasing pathway Voisin et al. (2001). These excitations can provide seeds for valence destabilization through SPR. Such a process would be inhomogeneous in nature and proceed on a phonon timescale.

To visualize transient atomic processes associated with electronic excitation, we employ a Reverse Monte Carlo (RMC) sturcture refinement scheme Ruan et al. (2009). While the earlier fragmentation simulation yielded qualitative insights into the origin of observed - anisotropy, the approach here seeks to refine/adjust the local atomic positions within the Ag supercell so as to fit both the positions and intensities of peaks generated from these structures to those determined experimentally at each time instance, as shown in Fig.2(b). First, we confirm that the data has sufficient signal-to-noise ratio since the RMC result of the ground state (0) retains a robust fcc sturcture, as shown in Fig. 5(a). Given that the diffraction changes between consecutive time frames are small, the refinement scheme progressively tracks the disordering process from one time instance to the next, while being constrained by the correlation between atomic positions in neighboring time frames that is inherently present in the diffraction patterns. Selected RMC results are depicted in Figs. 5(a)-(d) with a planar slice cut off from the 3D supercell to expose the degradation of the pristine fcc lattice over time. The atomic sites colored in black represent topological defects with coordination number N 10, whereas the fully coordinated ones have N 12 corresponding to the fcc structure. We find that these defects, which are initially sparsely distributed following SPR, visibly grow and percolate into strips in 10 ps and then saturate, leaving behind fragmented nanocrystalline domains with an average size nm EPA . This disordered state persists for nearly 10 ps before a slow recovery to fcc on a time scale ps. Further analysis shows that among those undercoordinated sites the nearest neighbour distance exhibits large fluctuations indicating bond-softening in this region Fritz et al. (2007) characterized by their averaged root-mean-square displacements on the order of 0.15 Å, which is 4 times higher than those in the region of core domains.
In summary, an electronically driven, progressive fragmentation of Ag NCs is presented. We suggest that the fragmentation process is triggered by the creation of local valence instabilities, caused by redistribution of local charge density, facilitated in Ag through the strong nonlinear coupling between SPR and interband transition. When sufficient valence instabilities are instigated at a high fluence ( 17 mJ/cm2), the electronic states are strongly perturbed, leading to a prolonged ps lifetime of the local charge redistribution associated with valence excitation due to an insufficient dynamical screening. Such a dynamical localization feature is central to the creation and growth of the topological defects, which can persist on the phonon timescales, and could be common in nonequilibrium photoinduced structural phase transition.
We thank P.M. Duxbury, S.J.L. Billinge, R. Shen, and F. Vallée for critical discussions. The experimental work was supported by Department of Energy under Grant DE-FG02-06ER46309. The theoretical analysis was supported (R.J.W, R.A.M) by National Science Foundation under Grant DMR-0703940.
References
- Nasu (2004) K. Nasu, Photoinduced phase transitions (World Scientific, Hackensack, 2004).
- Collet et al. (2003) E. Collet, et al., Science 300, 612 (2003).
- Qazilbash et al. (2007) M. M. Qazilbash, et al., Science 318, 1750 (2007).
- Bargheer et al. (2004) M. Bargheer, et al., Science 306, 1771 (2004).
- Baum et al. (2007) P. Baum, D.-S. Yang, and A. H. Zewail, Science 318, 788 (2007).
- Fritz et al. (2007) D. M. Fritz, et al., Science 315, 633 (2007).
- Ruan et al. (2004) C.-Y. Ruan, et al., Science 304, 5667 (2004).
- Gedik et al. (2007) N. Gedik, et al., Science 316, 425 (2007).
- Siwick et al. (2003) B. J. Siwick, J. R. Dwyer, R. E. Jordan, and R. J. D. Miller, Science 302, 1382 (2003).
- Ruan et al. (2009) C.-Y. Ruan, et al., Microsc. Microanal. 15, 323 (2009), arXiv:0910.4407v1.
- Takami et al. (1999) A. Takami, H. Kurita, and S. Koda, J. Phys. Chem. B 103, 1226 (1999).
- Inasawa et al. (2005) S. Inasawa, M. Sugiyama, and Y. Yamaguchi, J. Phys. Chem. B. 109, 3104 (2005).
- Kamat et al. (1998) P. V. Kamat, M. Flumiani, and G. V. Hartland, J. Phys. Chem. B 102, 3123 (1998).
- Link et al. (2000) S. Link, C. Burda, B. Nikoobakht, and M. A. El-Sayed, J. Phys. Chem. B 104, 6152 (2000).
- Redmond et al. (2007) P. L. Redmond, X. Wu, and L. Brus, J. Phys. Chem. C 111, 8942 (2007).
- Muto et al. (2008) H. Muto, K. Miyajima, and F. Mafune, J. Phys. Chem. C 112, 5810 (2008).
- Plech et al. (2006) A. Plech, V. Kotaidis, M. Lorenc, and J. Boneberg, Nat. Phys. 2, 44 (2006).
- Schaffer et al. (2001) C. B. Schaffer, A. Brodeur, and E. Mazur, Meas. Sci. Tech. 12, 1784 (2001).
- Hartland (2004) G. V. Hartland, Phys. Chem. Chem. Phys. 6, 5263 (2004).
- Raman et al. (2008) R. K. Raman, et al., Phys. Rev. Lett. 101, 077401 (2008).
- (21) See EPAPS Document No. [to be assigned] for details.
- Raman et al. (2009) R. K. Raman, Z. Tao, T.-R. Han, and C.-Y. Ruan, Appl. Phys. Lett. 95, 181108 (2009).
- Lehmann et al. (2000) J. Lehmann, et al., Phys. Rev. Lett. 85, 2921 (2000).
- Murdick et al. (2008) R. A. Murdick, R. K. Raman, Y. Murooka, and C.-Y. Ruan, Phys. Rev. B 77, 245329 (2008).
- Guo et al. (2000) C. Guo, G. Rodriguez, A. Lobad, and A. J. Taylor, Phys. Rev. Lett. 84, 4493 (2000).
- Grua et al. (2003) P. Grua, et al., Phys. Rev. B 68, 035424 (2003).
- Del Fatti et al. (2000) N. Del Fatti, et al., Phys. Rev. B 61, 16956 (2000).
- Voisin et al. (2001) C. Voisin, N. D. Fatti, D. Christofilos, and F. Vallee, J. Phys. Chem. B 105, 2264 (2001).