High-spin transition quadrupole moments in neutron-rich Mo and Ru nuclei: testing softness?
Abstract
The transition quadrupole moments, , of rotational bands in the neutron-rich, even-mass 102-108Mo and 108-112Ru nuclei were measured in the 8 to 16 spin range with the Doppler-shift attenuation method. The nuclei were populated as fission fragments from 252Cf fission. The detector setup consisted of the Gammasphere spectrometer and the HERCULES fast-plastic array. At moderate spin, the moments are found to be reduced with respect to the values near the ground states. Attempts to describe the observations in mean-field-based models, specifically cranked relativistic Hartree-Bogoliubov theory, illustrate the challenge theory faces and the difficulty to infer information on softness and triaxiality from the data.
keywords:
rotational bands , transition quadrupole moments , triaxial nuclear shape , cranked relativistic Hartree-Bogoliubov theoryEvidence for the presence of a stable triaxial nuclear shape has thus far mainly been inferred from spectroscopic data at high spin. Recent examples are the observation of wobbling bands in the rare-earth region [1] and of chiral structures in the lanthanide region [2]. Another, earlier example of the presence of a triaxial shape is associated with the smooth terminating bands in the tin region. These are understood as corresponding to a gradual change, over a large spin range, from a prolate shape through the triaxial plane toward an oblate, non-collective shape [3]. Another testing ground for asymmetric shapes is thought to be the Zr-Mo-Ru region of neutron-rich nuclei (neutron number ). This is due in part to the presence at low excitation energy of bands built on a -vibrational state, an observation [4] suggesting that the potential energy surface (PES) of these nuclei is soft or unstable with respect to the deformation parameter . This parameter measures the degree of triaxiality of a quadrupole nuclear shape, which is only symmetric if is a multiple of (e.g., prolate for , ). However, there is at present considerable uncertainty on this issue despite the increasing available information on level schemes [5] and lifetimes [6]. In fact, the data on ground-state bands in the nuclei of interest appear consistent with the rotation of a prolate or near-prolate shape accompanied by the usual alignment of a pair of nucleons at medium spin.
It should be pointed out that the near-yrast structure of the nuclei of interest cannot be interpreted in terms of either wobbling or chirality. The known transitions linking excited- and ground-band levels are predominantly of the and type, in contrast with the selective linking transitions associated with wobbling motion. Furthermore, the alignment properties exhibited by the excited and the ground-state bands differ significantly, while they are essentially indistinguishable in the case of wobbling. The presence of chiral bands indicates that the excited configuration, on which these bands are built, is associated with a triaxial shape. It has been suggested that the off-yrast structure of 110,112Ru may contain candidates for such bands [7]. However, for -soft nuclei, the PES of an excited configuration and of the vacuum configuration will be different, due to the deformation driving properties of the orbitals in the former configuration and to differences in pairing. Hence, the presence of chiral bands at moderately high spin does not imply the onset of triaxiality near the ground state.
In this letter, transition quadrupole moments, , in the even-mass nuclei 102-108Mo and 108-112Ru are reported. The values are the result of lifetime measurements using the Doppler-shift attenuation method (DSAM). The measurements cover a large number of transitions in the respective ground-state bands, in the spin range, and a number of transitions in the bands. The data sets are augmented by values from the literature, including lower-spin transitions accessible by the recoil-distance Doppler-shift method. The values and the moments of inertia are compared with the results of cranked relativistic Hartree-Bogoliubov calculations with approximate particle-number projection by means of the Lipkin-Nogami method (called CRHB+LN hereafter) [8]. The goal of the study is to examine possible signatures for a shape change in the ground-state band as a function of spin, herewith addressing the possibility of a rotation-induced triaxial shape. The comparison between the data and the calculations also addresses two related issues: the recent prediction of a stable triaxial ground state [9], and the predicted competition between a prolate and an oblate shape near the ground state [10] and in the ground-state band [6].
As was the case in Ref. [6], neutron-rich nuclei in this mass region were populated via spontaneous fission. A 230-Ci 252Cf source, mounted on a Pt backing of thickness 440 mg/cm2, was used. The source was covered by a 240-g/cm2 Au foil. The experiment ran for 18 days with a detector combination consisting of 98 Compton-suppressed Ge spectrometers of Gammasphere [11] and the HERCULES array. This array of 64 fast-plastic detectors was designed as an evaporation-residue counter for in-beam studies [12]. In the present experiment, HERCULES served a two-fold purpose: (i) It helped to determine the fission axis, thereby providing an orientation axis for the emission angles of the rays from fission fragments detected in Gammasphere. (ii) It provided an efficient way to gate on either the light- or heavy-mass fragment, based on the measured pulse height and time-of-flight with respect to the -ray flash. A total of fragment- quintuple coincidence events were recorded.
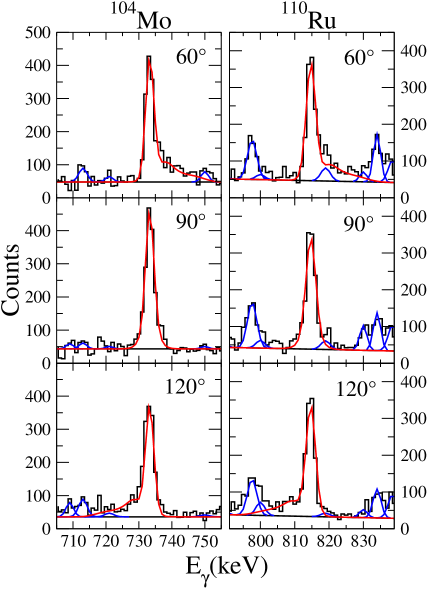
Item (i) above is of importance as it enables DSAM lifetime measurements with the usual approach; i.e., the analysis of asymmetric line shapes can be performed, in contrast to the situation in Ref. [6]. The fission axis coincides with the line between the source position and the HERCULES detector that is hit by a fragment. The velocity vector of the complimentary fragment, slowing in the Pt backing and emitting the ray of interest, is collinear with this line (due to momentum conservation). The emission angle of the ray of interest with respect to the fission axis is denoted by . Examples for angle-sorted -ray coincidence spectra gated with the heavy-mass fragment are displayed in Fig. 1; more details are presented elsewhere [13].
The line shapes for the various transitions are fitted with the code of Ref. [14] and lifetimes are extracted. The light 252Cf fragments have an average initial velocity of 0.046c. For the slowing of the ions in the Pt backing, the stopping powers of both the SRIM package [15] and the Northcliffe-Schilling description [16] were considered. The two treatments differ in stopping powers by about 11%. This difference, along with uncertainties in the initial velocity and the transition energy, were incorporated into the systematic uncertainty for each extracted lifetime. The results are reported in Table 1; they deal only with stretched transitions.
From the measured lifetimes, the reduced transition probabilities, , were derived. These were translated into values according to the expression
| (1) |
where the term in brackets is a Clebsch-Gordan coefficient determined by the spin and the principal quantum number of the initial () and final () state. Appropriate error propagation was taken into account. For some of the transitions in a band, the partial lifetimes according to the intensity-branching ratios reported in Ref. [5] (or in a footnote of Table 1) were used. For all transitions in a band, was adopted. These values are confirmed [13] by ratios of measured values for different -band to ground-state-band transitions from the same initial state according to the Alaga rules [18].
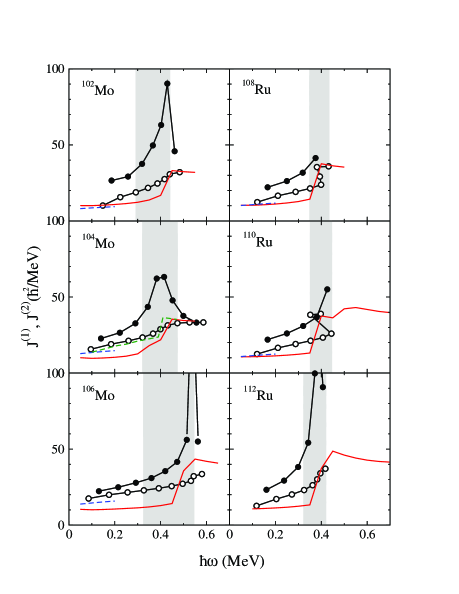
The present discussion focusses on the ground-state bands and starts with their alignment features. These are depicted in Fig. 2 in terms of the kinematic and dynamic moments of inertia as a function of rotational frequency. The 106Mo and 108Mo nuclei have essentially the same characteristics and the latter case is omitted for brevity. As indicated by the shaded area in each plot, the spin range where values are now available, overlaps in part with the band-crossing region. In 104Mo, for example, this region is centered around MeV and . In all nuclei under discussion, the rise of the moments of inertia is attributed to the rotational alignment of a pair of neutrons [19].
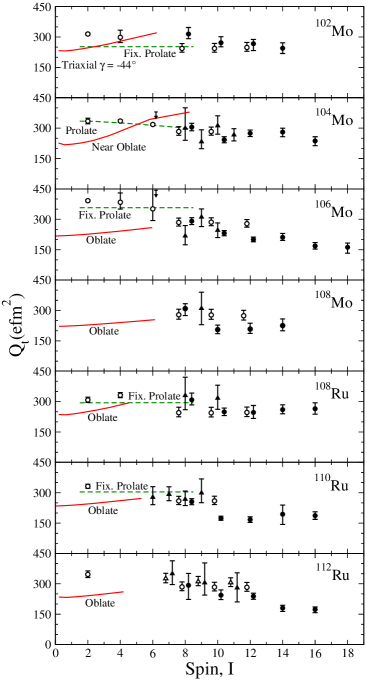
The values, as a function of spin, for the in-band transitions in 102-108Mo and 108-112Ru are provided in Fig. 3 with full symbols. They are combined with previous results from the literature [5, 6], shown as open symbols. A distinction is made between the values for the ground-state and bands by circles and triangles, respectively. The values for the two types of bands are comparable in magnitude.
For the ground-state bands the following observations can be made: The values decrease with increasing spin and this behavior is accentuated in the heavier isotopes. This observation holds for both Mo (102,104Mo vs. 106,108Mo) and Ru (108Ru vs. 110,112Ru) isotopes: the weighted-average values for of efm2 and efm2 for 110,112Ru are to be compared with efm2 for 108Ru. Moreover, these averages for 110,112Ru are also somewhat smaller than those for 106,108Mo. Hence, the decrease in the values seems more severe in the Ru isotopes than in the available Mo nuclei. This observation suggests a dependence of on and . It is worth noting that a reduction of moments with increasing spin is also seen in 74Kr [20] and in the rare-earth region [21]. In these nuclei, this reduction has been interpreted as being due to a soft PES polarized by rotation-aligned quasiparticles inducing a triaxial shape.
As stated above, the Mo and Ru nuclei under investigation are thought to be characterized by -soft energy surfaces and their successful description would be expected to use mean-field based models. Unfortunately, as discussed in Sec. 4.1. of Ref. [9], no consistent picture emerges from the model calculations and different methods reach different conclusions. These calculations face two principal difficulties. First, strong shape variations with and are expected that can be attributed to shell effects in the single-particle spectrum. Hence, the results depend sensitively on the adopted single-particle energies, the accuracy of which is model and parameter dependent [22, 23]. Second, the results of calculations strongly depend on the treatment of pairing as exemplified below.
In this letter, the covariant density functional theory of Ref. [8] is applied. The first task was to perform PES calculations as a function of the degree of freedom and the quadrupole-deformation parameter . This was done for selected Mo isotopes with a code for triaxial relativistic mean-field theory plus BCS with separable pairing (called RMF+BCS hereafter). The second task was to calculate the alignment and deformation properties of the bands and this was done within the CRHB+LN approach [8], where the Gogny D1S force was used in the pairing channel. This code does not have constraints on the diagonal and off-diagonal elements of the quadrupole-moment tensors, and . As a result, the solution is restricted to local minima; i.e., the observables of interest, and , are calculated at the equilibrium deformations of these minima, which change with frequency. In both calculations the NL3* parametrization of the RMF Lagrangian [24] was used.
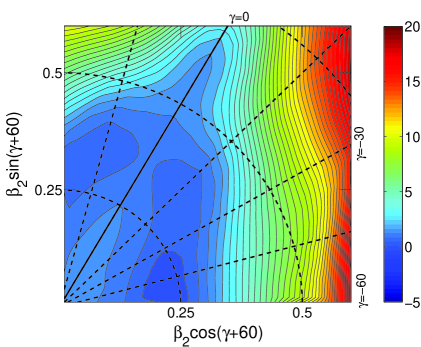
A sample result of the triaxial RMF+BCS calculations with NL3* is shown in Fig. 4. The PES plot illustrates the softness in this case. An oblate minimum and a shallow excited prolate minimum are seen. In contrast, axial RMF+BCS calculations [25] with the NL3 parametrization of the Lagrangian predict the prolate minimum to be the lowest in 102,104Mo, whereas the oblate one becomes the lowest in the heavier Mo isotopes. However, CRHB+LN calculations with the NL3 parametrization suggest that the oblate minimum is lowest by 20 and 240 keV in 102,104Mo, respectively. These examples indicate that the energy surfaces strongly depend on the treatment of pairing.
The results of the CRHB+LN calculations are first compared with the experimental moments in Fig. 2. The ground states of 102,104,106Mo are calculated to be triaxial , near-oblate , and oblate, respectively. These solutions are energetically favored in the calculations. However, they fail to reproduce the rise of the moments with frequency. In Fig. 3, the triaxial and oblate solutions are represented by a full curve. Substantial shape changes take place in the associated configurations with increasing spin: the deformation increases while drifts towards . The latter feature is pronounced in 104Mo, where is reached at and the value rises accordingly. This prediction is in conflict with the data, including the new values, which show the opposite trend. A similar situation occurs in the Ru isotopes. Thus, the interpretation of the alignment and deformation properties of the observed bands in terms of collective motion associated with oblate and near-oblate shapes faces substantial difficulties. It turns out that it is also impossible to describe the radii of neutron-rich Mo nuclei with such shapes [10].
The alternative is to associate the observed bands with a prolate minimum, although it is an excited one in Fig. 4. The CRHB+LN calculations indicate that, without constraining the and moments, the solution in the local prolate minimum becomes unstable when increases. Only in the case of 104Mo is a solution obtained over a significant frequency range. Figures 2 and 3 indicate that the CRHB+LN prolate solution in 104Mo, represented by dashed, green curves, provides a good description of the moment and the band-crossing frequency as well as the values for . The downslope of with increasing is reproduced and is attributed to a combined decrease in and increase in deformation induced by rotation. For the other nuclei, the prolate solution is only stable at the lowest values. The and values extracted from these minima agree rather well with experiment, though in a limited range of frequency and spin. Due to this limitation, the trends in the predicted low-spin and measured high-spin values are, in the case of 106Mo and 110Ru, not comparable. They can, however, be viewed as complementary. It is worth noting that the current data are covering the band-crossing region; this spin range disappears in the cranking calculations performed as a function of if the calculated crossing is sharp [26].
The trend seen in the data appears to be consistent with rotation associated with a near-prolate shape below the band crossing. Above it, a significant excursion into the triaxial sector may be present according to the current CRHB+LN calculations. These data represent a challenge for theoretical calculations based on mean-field models. This is demonstrated here within the CRHB+LN framework. The predicted oblate shape and a low-spin triaxial shape with are ruled out by the data. For some of the nuclei viz. 104Mo, the calculations with the prolate minimum reproduce the observations, but reliable predictions with such a minimum cannot be made for all the nuclei discussed. For nuclei with a very soft PES, a description on the mean-field level may not be adequate and methods beyond mean field may be required [27, 28], as correlations due to configuration mixing and angular-momentum projection can affect the relative energies of the various minima. However, such methods also depend sensitively on the underlying single-particle structure which remains model and parameter dependent [27]. Thus, description within such a framework will not necessarily provide reliable results. In addition, the description of rotational spectra requires the use of a phenomenological scaling factor for the moments of inertia, as time-odd mean fields are neglected in the current realizations of these methods [28].
In conclusion, moments up to have been obtained for the 102-108Mo and 108-112Ru even, neutron-rich isotopes. A systematic decrease of the moments with spin is observed. The available data remain a challenge for theory to explain.
Acknowledgments
The authors thank J. Elson (WU) and J. Rohrer (ANL) for technical support. The 252Cf source was provided by the Oak Ridge National Laboratory. This work was supported by the US Department of Energy, Office of Nuclear Physics, Grant Nos. DE-FG02-88ER40406, DE-FG02-07ER41459, DE-FG02-94ER40834, and Contract No. DE-AC02-06CH11357.
References
- [1] D.R. Jensen, G.B. Hagemann, I. Hamamoto, S.W. Ødegård, B. Herskind, G. Sletten, J.N. Wilson, K. Spohr, H. Hübel, P. Bringel, A. Neußer, G. Schönwaßer, A.K. Singh, W.C. Ma, H. Amro, A. Bracco, S. Leoni, G. Benzoni, A. Maj, C.M. Petrache, G. Lo Bianco, P. Bednarczyk, D. Curien, Phys. Rev. Lett. 89 (2002) 142503.
- [2] S. Frauendorf, Rev. Mod. Phys. 73 (2001) 463.
- [3] A.V. Afanasjev, D.B. Fossan, G.J. Lane, I. Ragnarsson, Phys. Rep. 322 (1999) 1.
- [4] J.A. Shannon, W.R. Phillips, J.L. Durell, B.J. Varley, W. Urban, C.J. Pearson, I. Ahmad, C.J. Lister, L.R. Morss, K.L. Nash, C.W. Williams, N. Schulz, E. Lubkiewicz, M. Bentaleb, Phys. Lett. B 336 (1994) 136.
- [5] NNDC database, http://www.nndc.bnl.gov/nudat2.
- [6] A.G. Smith, J.L. Durell, W.R. Phillips, W. Urban, P. Sarriguren, I. Ahmad, Phys. Rev. C 86 (2012) 014321.
- [7] Y.X. Luo, S.J. Zhua, J.H. Hamilton, J.O. Rasmussen, A.V. Ramayya, C. Goodin, K. Li, J.K. Hwang, D. Almehed, S. Frauendorf, V. Dimitrov, J. Zhang, X.L. Che, Z. Jang, I. Stefanescu, A. Gelberg, G.M. Ter-Akopian, A.V. Daniel, M.A. Stoyer, R. Donangelo, J.D. Colem, N.J. Stone, Phys. Lett. B 670 (2009) 307.
- [8] A.V. Afanasjev, P. Ring, J. König, Nucl. Phys. A 676 (2000) 196.
- [9] P. Möller, R. Bengtsson, B.G. Carlsson, P. Olivius, T. Ichikawa, H. Sagawa, A. Iwamoto, At. Data Nucl. Data Tabl. 94 (2008) 758.
- [10] R. Rodríguez-Gúzman, P. Sarriguren, L.M. Robledo, S. Perez-Martin, Phys. Lett. B 691 (2010) 202.
- [11] I.-Y. Lee, Nucl. Phys. A 520 (1990) 641c.
- [12] W. Reviol, D.G. Sarantites, R.J. Charity, C.J. Chiara, J. Elson, M. Montero, O.L. Pechenaya, S.K. Ryu, L.G. Sobotka, Nucl. Instr. Meth. A 541 (2005) 478.
- [13] J.B. Snyder, PhD thesis, Washington University (2013).
- [14] J.C. Wells, N.R. Johnson, ORNL Physics Division Progress Report for Period Ending September 30, 1991.
- [15] J.F. Ziegler, J.P. Biersack, M.D. Ziegler, SRIM: The stopping of ions in matter (Lulu Press, Morrisville, NC, 2008), http://www.srim.org.
- [16] L.C. Northcliffe, R.F. Schilling, Nucl. Data Tab. A 7 (1970) 233.
- [17] C.Y. Wu, H. Hua, D. Cline, A.B. Hayes, R. Teng, D. Riley, R.M. Clark, P. Fallon, A. Goergen, A.O. Macchiavelli, K. Vetter, Phys. Rev. C 73 (2006) 034312.
- [18] R.F. Casten, Nuclear Structure from a Simple Perspective, Oxford University Press, New York 2000.
- [19] J. Skalski, S. Mizutori, W. Nazarewicz, Nucl. Phys. A 617 (1997) 282.
- [20] J.J. Valiente-Dobón, T. Steinhardt, C.E. Svensson, A.V. Afanasjev, I. Ragnarsson, C. Andreoiu, R.A.E. Austin, M.P. Carpenter, D. Dashdorj, G. de Angelis, F. Dönau, J. Eberth, E. Farnea, S.J. Freeman, A. Gadea, P.E. Garrett, A. Görgen, G.F. Grinyer, B. Hyland, D. Jenkins, F. Johnston-Theasby, P. Joshi, A. Jungclaus, K.P. Lieb, A.O. Macchiavelli, E.F. Moore, G. Mukherjee, D.R. Napoli, A.A. Phillips, C. Plettner, W. Reviol, D. Sarantites, H. Schnare, M.A. Schumaker, R. Schwengner, D. Seweryniak, M.B. Smith, I. Stefanescu, O. Thelen, R. Wadsworth, Phys. Rev. Lett. 95 (2005) 232501.
- [21] N.R Johnson, Prog. Part. Nucl. Phys. 28 (1992) 215.
- [22] A.V. Afanasjev, S. Shawaqfeh, Phys. Lett. B 706 (2011) 177.
- [23] R. Rodríguez-Gúzman, P. Sarriguren, L.M. Robledo, Phys. Rev. C 82 (2010) 044318.
- [24] G.A. Lalazissis, S. Karatzikos, R. Fossion, D. Pena Arteaga, A.V. Afanasjev, P. Ring, Phys. Lett. B 671 (2009) 36.
- [25] G.A. Lalazissis, S. Raman, P. Ring, At. Data Nucl. Data Tabl. 71 (1999) 1.
- [26] Z. Szymanski, Fast Nuclear Rotation, Clarendon Press, Oxford 1983.
- [27] M. Bender, P. Bonche, P.-H. Heenen, Phys. Rev. C 74 (2006) 024312.
- [28] Z.P. Li, T. Nikšic, D. Vretenar, J. Meng, G.A. Lalazissis, P. Ring, Phys. Rev. C 79 (2009) 054301.
| 1 | Eγ (keV) | Iγ 2 | (ps) | (efm2) |
|---|---|---|---|---|
| 102Mo | ||||
| 690.9 | 100 | 1.59 | 315 | |
| 771.5 | 48.1 | 1.20 | 272 | |
| 834.9 | 20.6 | 0.82 | 267 | |
| 879.2 | 2.3 | 0.74 | 245 | |
| 104Mo | ||||
| 519.2 | 184 | 4.783 | 380 | |
| 641.7 | 100 | 2.44 | 305 | |
| 601.7 | 24.9 | 3.4 | 300 | |
| 646.5 | 14.0 | 2.24 | 233 | |
| 733.6 | 40.8 | 1.93 | 243 | |
| 678.4 | 6.2 | 1.88 | 312 | |
| 712.9 | 5.1 | 1.96 | 267 | |
| 798.0 | 19.7 | 0.96 | 275 | |
| 861.3 | 10.0 | 0.63 | 281 | |
| 945.0 | 2.6 | 0.55 | 237 | |
| 106Mo | ||||
| 896.2 | 55.9 | 2.33 | 1154 5 | |
| 511.2 | 252 | 3.803 | 443 | |
| 654.9 | 100 | 2.43 | 291 | |
| 631.0 | 12.1 | 3.46 | 2186 | |
| 690.9 | 9.1 | 1.81 | 311 | |
| 784.1 | 42.9 | 1.52 | 231 | |
| 756.4 | 3.6 | 1.77 | 246 | |
| 896.7 | 17.9 | 1.02 | 200 | |
| 992.9 | 8.9 | 0.54 | 211 | |
| 1051.5 | 5.2 | 0.63 | 169 | |
| 1087.6 | 1.9 | 0.57 | 162 | |
| 1 | Eγ (keV) | Iγ 2 | (ps) | Qt (efm2) |
|---|---|---|---|---|
| 108Mo | ||||
| 662.1 | 100 | 2.05 | 309 | |
| 707.0 | 25.0 | 1.6 | 310 | |
| 776.6 | 57.7 | 2.02 | 205 | |
| 872.0 | 19.6 | 1.08 | 208 | |
| 945.6 | 8.2 | 0.61 | 225 | |
| 108Ru | ||||
| 940.5 | 32.2 | 1.87 | 785 | |
| 701.6 | 100 | 1.53 | 308 | |
| 657.8 | 20.8 | 2.1 | 330 | |
| 798.3 | 41.6 | 1.20 | 249 | |
| 730.0 | 11.5 | 1.25 | 317 | |
| 788.1 | 19.9 | 1.28 | 246 | |
| 762.2 | 5.1 | 1.34 | 260 | |
| 863.6 | 2.3 | 0.69 | 264 | |
| 110Ru | ||||
| 599.8 | 62.5 | 4.12 | 278 | |
| 645.5 | 20.8 | 3.03 | 292 | |
| 705.3 | 100 | 2.17 | 256 | |
| 712.7 | 25.0 | 1.94 | 268 | |
| 756.0 | 8.6 | 1.24 | 299 | |
| 815.0 | 37.6 | 2.22 | 174 | |
| 887.6 | 12.5 | 1.54 | 168 | |
| 703.9 | 7.9 | 3.6 | 190 | |
| 799.7 | 5.4 | 2.03 | 187 | |
| 112Ru | ||||
| 605.4 | 44.5 | 3.10 | 350 | |
| 649.5 | 100 | 2.5 | 290 | |
| 693.3 | 26.5 | 1.84 | 305 | |
| 723.3 | 55.9 | 2.06 | 244 | |
| 7 | 756.0 | 10.2 | 1.32 | 280 |
| 1 | Eγ (keV) | Iγ 2 | (ps) | Qt (efm2) |
|---|---|---|---|---|
| 763.4 | 31.3 | 1.61 | 239 | |
| 791.9 | 12.3 | 2.31 | 180 | |
| 836.0 | 7.1 | 1.90 | 173 |
1 Subscripts 1 and 2 indicate first and second excited state, respectively.
2 Uncertainties range from 3% for strong to 40% for the weakest transitions.
3 Lower-limit value due to limited DSAM applicability.
4 Intensity-braching ratio of 0.26 0.05 [13] was used (see text).
5 value not shown in Fig. 3.
6 Intensity-braching ratio of 0.57 0.13 [13] was used (see text).
7 Transition reported in Ref. [17].