PDR Model Mapping of Obscured H2 Emission and the Line-of-Sight Structure of M17-SW
Abstract
We observed H2 line emission with Spitzer-IRS toward M17-SW and modeled the data with our PDR code. Derived gas density values of up to few times 107 cm-3 indicate that H2 emission originates in high-density clumps. We discover that the PDR code can be utilized to map the amount of intervening extinction obscuring the H2 emission layers, and thus we obtain the radial profile of relative to the central ionizing cluster NGC 6618. The extinction has a positive radial gradient, varying between 15—47 mag over the projected distance of 0.9—2.5 pc from the primary ionizer, CEN 1. These high extinction values are in good agreement with previous studies of toward stellar targets in M17-SW. The ratio of data to PDR model values is used to infer the global line-of-sight structure of the PDR surface, which is revealed to resemble a concave surface relative to NGC 6618. Such a configuration confirms that this PDR can be described as a bowl-shaped boundary of the central H II region in M17. The derived structure and physical conditions are important for interpreting the fine-structure and rotational line emission from the PDR.
1 Introduction
The star forming region M17 is notable for its asymmetry in terms of its appearance in different wavelength regimes. Optically, it is visible as a nebula with a prominent northern bar marking the location of an ionization front, which suffers only a low level of optical extinction (Felli et al., 1984, and references therein). On the other hand, radio maps have long revealed the presence of the southern bar, part of the M17-SW region, which has no obvious optical counterpart, and is thus understood to suffer a much higher level of extinction along our line of sight (LOS). Also noteworthy is the high-extinction patch situated in front of a number of O-type stellar members belonging to the ionizing cluster NGC 6618, which from our direction can be found between the two ionization bars (e.g., Dickel, 1968; Beetz et al., 1976; Povich et al., 2007).
Given that the southern bar includes an ionization front and a PDR that are both obscured in optical wavelength, it is best studied in the IR and radio regimes. Previous IR and radio studies of M17-SW have described it as almost edge-on PDR (Stutzki et al., 1988), or as a bowl carved into the molecular cloud (Meixner et al., 1992; Brogan & Troland, 2001; Pellegrini et al., 2006), and have concluded that it is comprised of a clumpy medium (Stutzki & Güsten, 1990; Meixner et al., 1992).
For this study we obtained Spitzer spectroscopy of rotational emission lines of H2 toward M17-SW in order to model the data with our PDR code. Specifically, we performed model mapping of the gas density over the field of view, and inferred the LOS configuration of the PDR layer (see Sheffer et al., 2011). Owing to the presence of extinction obscuring the interface between the H II region and the molecular cloud, we also included in model mapping as means of dereddening the H2 line intensities. We shall present our results as a function of the radial distance from CEN 1, the primary O4 member of NGC 6618.
2 Spitzer-IRS Data and Analysis
Our Spitzer observations of M17-SW belong to programs P03697 (SH and LH data) and P30295 (SL data). Data acquisitions for P03697 were executed on three dates between 2004 Oct 02 and 2005 Apr 23, and those for P30295 on the two dates 2007 Sep 30 and Oct 12. The target area was covered by multiple AORs: 11 for SH, and 4 each for LH and SL data, see Table 1. Following re-gridding onto the LH pixel frame, the area available for full analysis based on five emission lines includes 480 LH pixels. Each LH pixel is 446 wide, corresponding to 8900 AU, or 0.043 pc at a distance of 2.0 kpc ( precision, see Xu et al., 2011).
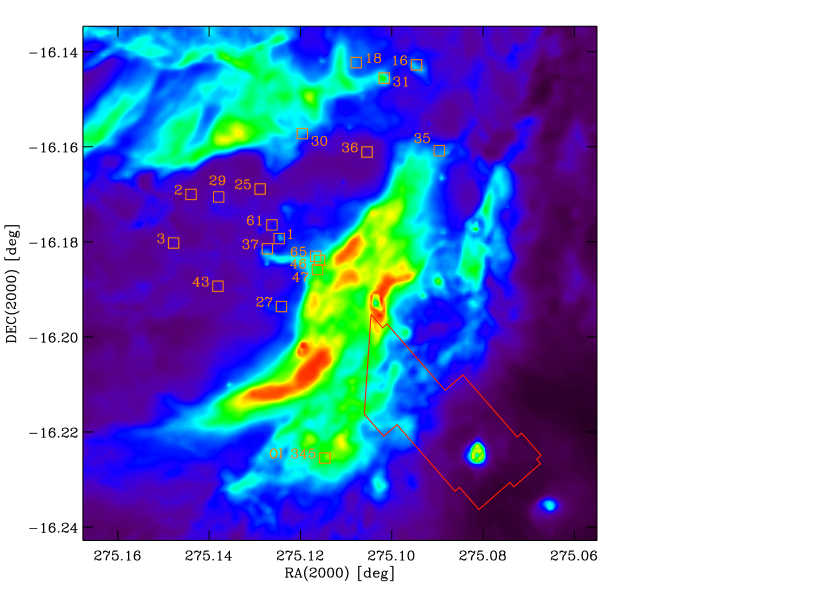
We employed version 1.7 of CUBISM (Smith et al., 2007) for the reduction of observations and the construction of data cubes therefrom, assuring a match with the Spitzer Science Center pipeline version S18.7.0. Left panel of Figure 1 shows the proper celestial location and orientation of the area of intersection of all modules over an 8 image from Spitzer/IRAC.
Four pure-rotational emission lines of H2 were detected and mapped toward the target: S(1) and S(2) at 17.03 and 12.28 , respectively, from the SH module, and S(3) and S(5)

at 9.66 and 6.91 , respectively, from orders 1 and 2, respectively, of the SL module. Owing to lack of reliable signal from S(0) at 28.22 , albeit located within the wavelength interval of coverage of the LH module, our PDR modeling did not include the S(0) line. Emission line maps were constructed by using in-house IDL procedures to fit line profiles and to derive integrated line intensities that included continuum removal following its fitting by a low-order polynomial. The presence in these spectra of emission lines of ionized atomic species appreciably stronger than the emission lines from H2 necessitated an additional step of deblending S(5) and [Ar II] at 6.98 . Such a challenge did not arise in the analysis of similar data toward NGC 2023-South, where lines of ionized species were either weak or undetectable (Sheffer et al., 2011). We note that the spectral co-presence of H II region and PDR emission lines shows that both regions are sampled along the LOS toward M17-SW, thus indicating that their configuration cannot be strictly edge-on.
No attempt was made to correct for zodiacal background emission owing to the bright nature of this target and the insensitivity of continuum-subtracted emission lines to such uniform contribution. Based on the discussion in Sheffer et al. (2011), data from the LH and SH modules were corrected by a factor of 0.84 in order to obtain calibration match with the SL module flux values.
In order to compare emission data with PDR models, line intensities were converted to column density via cm-2, where , and stand for the column density, emission intensity, Einstein A-coefficient, and transition energy for each rotational upper level . This conversion is linear owing to insignificant self-absorption of these quadrupole transitions. The four right panels of Figure 1 show the radial variation of H2 emission lines with distance from CEN 1, following data averaging along the orthogonal direction. Both intensity and column density scales are provided.
3 PDR Modeling of H2 Emission
The two primary PDR parameters are , the total hydrogen number density, and , the ratio of the incident 6—13.6 eV far-ultraviolet (FUV) flux over the Habing flux of erg s-1 cm-2 (Habing, 1968). We employed the Kaufman et al. (2006) PDR code to generate a (, ) grid of 950 normal models, where ‘normal’ means that the incident radiation field is normal to the PDR surface (). Model output consists of (H2) values following an integration along the normal as well, with grid step being 0.1 dex.
Model mapping was performed with the parameter constrained to predicted values. This was motivated by the availability of lists of O-type stars residing in and around NGC 6618 (e.g., Broos et al., 2007; Povich et al., 2009), as well as by the knowledge of precise (albeit projected) linear distances between each star and each mapped data pixel. Thus was obtained by summing the FUV flux of 19 O-type stars listed in Hoffmeister et al. (2008) and using
| (1) |
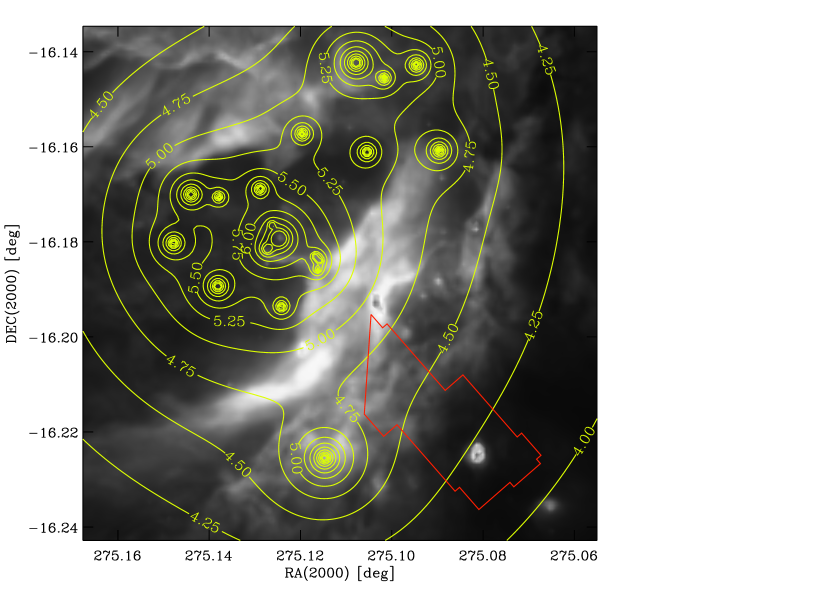
where the superscript ‘pr’ may stand for ‘predicted’ or ‘projected,’ is the distance to M17-SW in kpc, is the FUV luminosity of stellar radiator in solar units (Parravano et al., 2003), and is the angular separation between star and any map pixel in seconds of arc. The left panel of Figure 2 shows that the values of range over (1—8).
We perform a search for the smallest root mean square deviation (RMSD) of the differences in dex between modeled and observed values, thus yielding values for the ratio data/model. This ratio may be decomposed into two and two factors, , where is the number of PDRs along the LOS and here assumed to be 1, accounts for limb brightening owing to inclination angle , accounts for the angle of incidence of the radiation field on the PDR, and is the beam area filling factor, also assumed to be 1. This assumption is consistent with the pc sizes of both observationally-derived C18O clumps toward M17-SW (Stutzki & Güsten, 1990) and PDR-modelled clumps with cm-3 (Meixner and Tielens, 1993), as well as with the pc (at kpc) beam widths of the SH and SL modules of Spitzer-IRS. Owing to the dependence of the two angular factors, and , on the local orientation of the cloud surface (Sheffer et al., 2011), we shall employ them to infer clues about the LOS variations of the PDR over the field of view, see 5.
4 PDR Modeling with as a Free Parameter
It is customary to de-redden the observed values by the known or assumed value of extinction, , prior to comparing -corrected values with model output. Here we employ the Mathis (1990) reddening law. Our initial PDR mapping runs employed a global (or spatially-invariant) correction by mag, approximating the average value toward the central members of NGC 6618 (Hanson et al., 1997; Povich et al., 2007). However, some of the OB stars in the M17 region appear to show appreciably higher extinction values, with mag (Tokunaga & Thompson, 1979; Chini et al., 1980; Hanson et al., 1997). Follow-up modeling with mag returned fits with RMSD values smaller by factors of 1.3—1.5, whereas further reductions by factors of 1.3—1.8 were achieved by fits employing a global mag. Inevitably, we included as a free parameter that was allowed to

vary over the entire field of view. Superficially, both and corrections affect the ratios of data to model intensities. However, whereas the former applies the same factor to all emission lines, the latter has different values for different emission lines. Thus affects the ratios between emission lines from different levels, unlike .
The right panels of Figure 2 present our PDR model mapping results, with a mean RMSD of 0.029, or 7%. Values of are found to be mostly between (2.0—2.5) cm-3, or times higher than the density modeled for the Southern Ridge (SR) in NGC 2023 (Sheffer et al., 2011). Such values are consistent with H2 emission production in high-density clumps immersed in an interclump gas of density lower by 2 or 3 orders of magnitude (Meixner and Tielens, 1993). The (unshown) fixed parameter follows the values of from Eq. 1 by design. The next panel presents model output for , which to our knowledge is the first attempt to derive extinction values from PDR modeling. The mean of visual extinction preferred by the models is 30 mag, about 2—4 times as high as the initially presumed values of 8 and 15 mag. Values of , which range over 15—47 mag, are clearly increasing away from NGC 6618 with a gradient of 21 2 mag pc-1. Such a positive gradient is not unexpected: the structure of M17-SW includes a sequence of H II region, a PDR, and a dense molecular cloud along the same radial direction.
Our high values of modeled are in very good agreement with other indicators of extinction over the M17-SW field, i.e, away from the central region of NGC 6618. For example, determinations based on reddening toward individual M17-SW stellar sources have presented the following values: mag for the optically thickest regions, as well as mag for the molecular cloud core based on the -band luminosity function (Jiang et al., 2002); a range of mag for 55 stars within 0.7 pc of the KW object, as well as of 24 and 30 mag toward the two components of the KW object itself (Chini et al., 2004); and mag for a large number of sources along the reddening vector (Hoffmeister et al., 2008). Furthermore, even higher extinction estimates have been derived from far-IR and mm-wave observations that dissect the entire molecular cloud surrounding our field of view toward M17-SW. For example, Gatley et al. (1979) found mag through the core of the molecular cloud; Thronson & Lada (1983) estimated mag at the peak of 13CO emission; Keene et al. (1985) found mag based on 13CO data; and finally, Wilson et al. (2003) decomposed cloud B into individual clumps with inferred (H— cm-2 for clumps B25, B27, B29, B32, and B34, which are the ones that are either partially or fully overlapped by our Spitzer field of view. Focusing on B27 and B29, the two 13CO clumps wholly enclosed inside our field, and employing the relationship (H mag, values of = 21 and 29 mag can be inferred through these two clumps in cloud B. We consider such a consistent picture as a confirmation that PDR modeling may be employed for reliable mapping of values toward H2 emission obscured by dust.
Although we find here very good agreement between PDR-modeled values and values that have been derived by other means, it is important to cross-check our method toward another well-studied PDR, owing to the novelty involved. NGC 2023 is such a PDR, toward which a previously successful PDR modeling has been achieved with a fixed value of (Sheffer et al., 2011, and references therein). We performed the parameterized- test successfully, resulting in model fits similar to those previously obtained, as well as in output consistent with results from other studies. Whereas our previous modeling employed a fixed value of mag, or equivalently, mag, the new test returns a field-wide median of mag. Our PDR modeling is again indicating a positive radial gradient of extinction across the field, starting with much lower values of in the region between the SR and the exciting star, HD 37903, and reaching mag on the other side of the SR, or deeper into the dense molecular cloud. In this case, as is the case with M17-SW, the larger PDR-modeled values are consistent with previous studies. DePoy et al. (1990) concluded that over small scales, the extinction toward stars in NGC 2023 varies over 0–10 mag. Furthermore, the total extinction through the molecular cloud is expected to be 25 mag (DePoy et al., 1990). Over the SR, the range of values is mag, where the inferred semi-amplitude of the range is comparable to the level of uncertainty in the visual extinction determinations toward heavily obscured targets (e.g., Nielbock et al., 2008). For M17-SW we find a dispersion of mag along the fitted gradient.
5 Visualization of the LOS Dimension
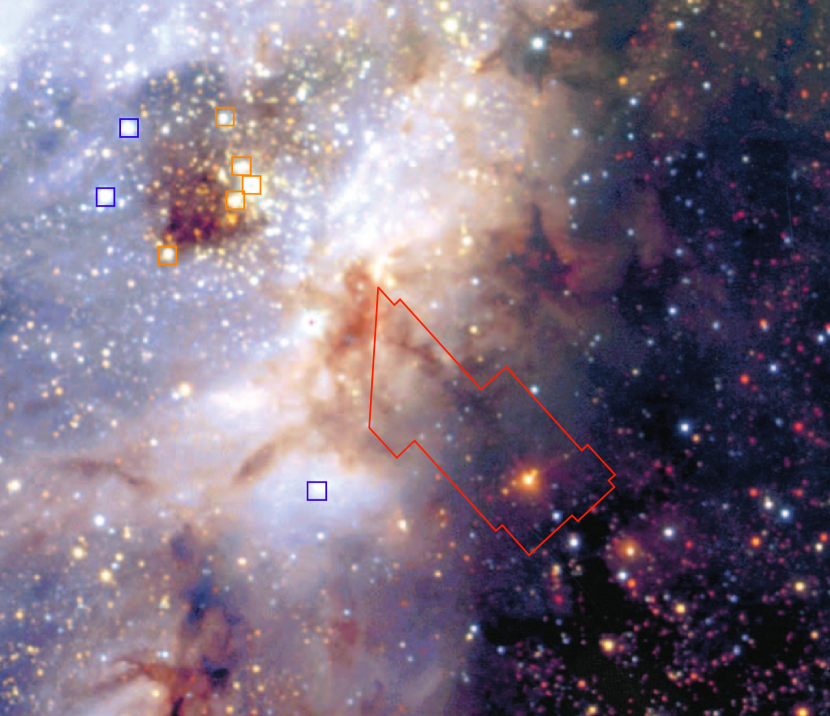
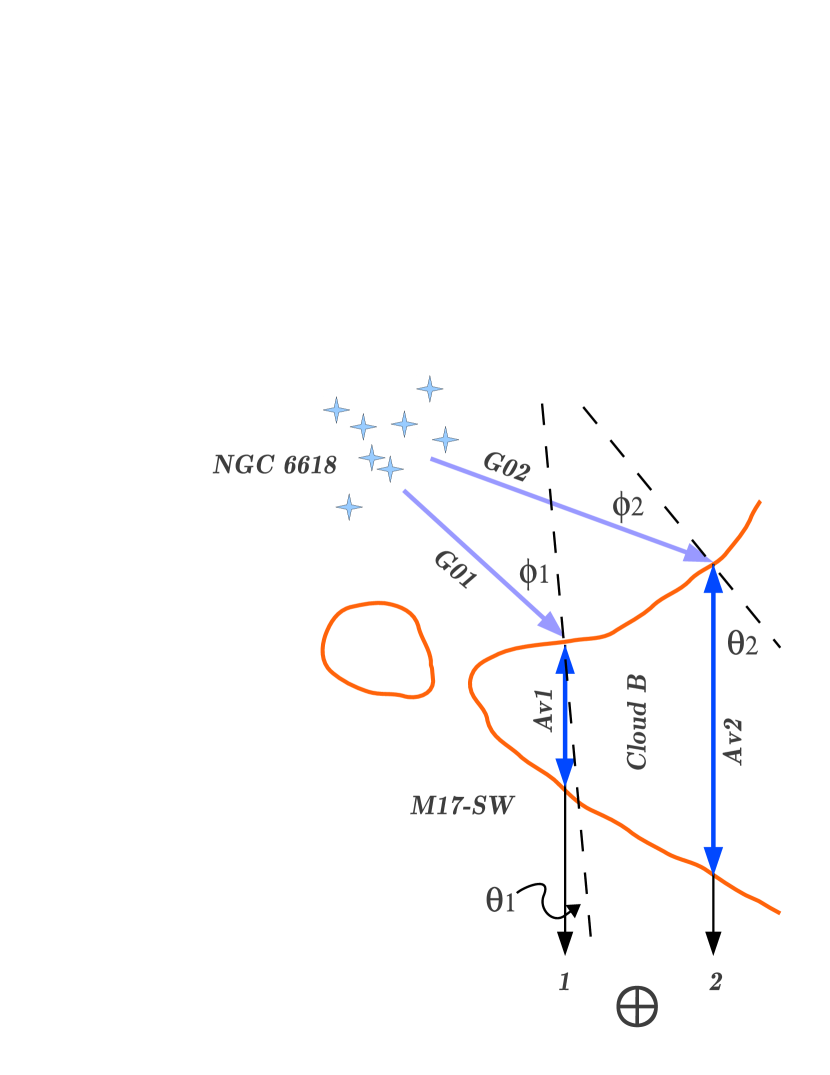
A visually stunning depiction of the radially increasing field is provided in the left panel of Figure 3, which is based on Figure 1 from Jiang et al. (2002). Our basic assumption is that the observed H2 emission originates on a cloud surface facing away from our direction and basking in the FUV starshine of NGC 6618. We thus view the obscured back side of the PDR surface through the bulk of cloud B, as measured by our modeled extinction values along the LOS, see right panel of Figure 3. Any C II or high- CO line emission (e.g., Pérez-Beaupuits et al., 2012) would also be observed from the far side of the intervening molecular cloud and its interpretation should account for the face-on geometry and intervening cold gas layer.
The last panel of Figure 2 showed that , which means that under the assumption of , and therefore a shallow grazing angle for the FUV influx from NGC 6618. We further assume that the cos()/cos() curve is defined by three continuous segments of the PDR surface and not by local variations over pixel-sized scales. Each construction of
a PDR surface begins at any arbitrarily chosen location along the LOS, and proceeds by forcing neighboring segments to be smoothly connected in order to avoid the introduction of FUV shadowing between segments.
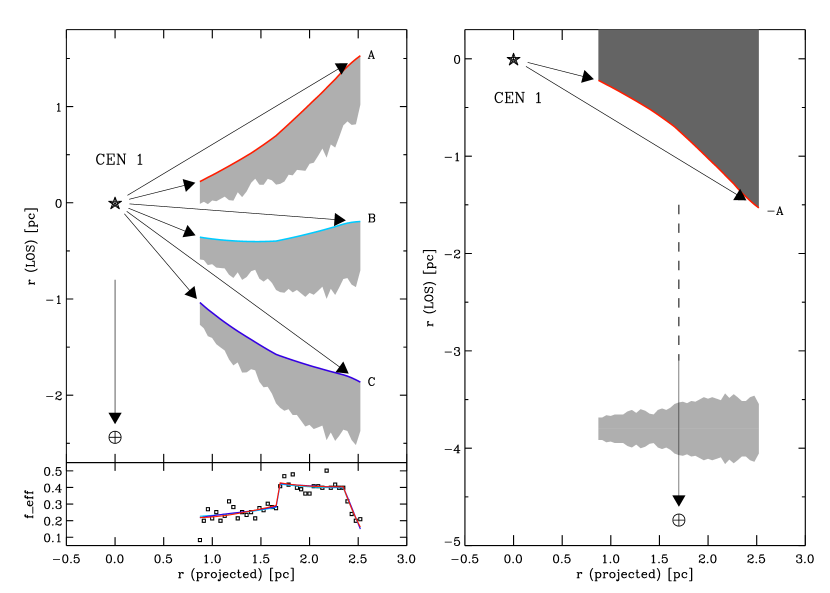
Figure 4 presents four examples of PDR surfaces that share the same curve of values. The first three surfaces, shown in the left panel, belong to our basic assumption that the PDR is viewed from its back side. Each derived concave surface is consistent with the general 3-D configuration of a bowl-shaped interface originally suggested by Meixner et al. (1992), see also Figure 2 of Pellegrini et al. (2006). The right panel show an alternate configuration in which the PDR is viewed from its front side and is physically separated from the layer of foreground extinction. Although the cos()/cos() curve fixes the relative curvature of the surface, and thus provides a ‘3-D view’ of the PDR layer along the LOS, both the absolute location along the LOS and the state of reflection about the abscissa are, unfortunately, degenerate.
Future studies could incorporate additional clues for a more robust characterization of the location and the reflection of the PDR surface. For example, our initial tests involving a freely variable show that its values start to drop significantly below values half way along the mapped radial distance from NGC 6618. Such a behavior may indicate that the line of sight is probing a more extreme case of geometry than derived here. Among the PDR surfaces depicted in Figure 4, only ‘A’, and therefore ‘A’, affect values in a similar fashion, owing to their increasing deviation from the plane of projection. On the other hand, the role of pixel-to-pixel variations, such as those seen in modeling output, remains to be evaluated in terms of orientation and mutual shadowing among individual clumps.
6 Summary
1. Spitzer-IRS spectra were obtained and employed in our quest to measure the intensity of H2 emission lines toward the PDR M17-SW.
2. Following conversion of H2 intensity into column density, we employed our PDR code in order to map physical quantities as a function of distance from the source of FUV radiation.
3. We introduced as a free parameter into the PDR code, and subsequently successfully derived radial mapping of the extinction suffered by H2 lines.
4. Our analysis of the data-to-model column density ratio in terms of provided a ‘3-D view’ of the line-of-sight structure of the PDR surface, showing it to be
globally curved, thus confirming the suggested description of a bowl-shaped PDR in M17-SW.
References
- Beetz et al. (1976) Beetz, M., Elsässer, H., Poulakos, C., & Weinberger, R. 1976, A&A, 50, 41
- Brogan & Troland (2001) Brogan, C. L., & Troland, T. H. 2001, ApJ, 560, 821
- Broos et al. (2007) Broos, P. S., Feigelson, E. D., Townsley, L. K., Getman, K. V., Wang, J., Garmire, G. P., Jiang, Z., & Tsuboi, Y. 2007, ApJS, 169, 353
- Chini et al. (1980) Chini, R., Elsässer, H., & Neckel, Th. 1980, A&A, 91, 186
- Chini et al. (2004) Chini, R., Hoffmeister, V. H., Kämpgen, K., Kimeswenger, S., Nielbock, M., & Siebenmorgen, R. 2004, A&A, 427, 849
- DePoy et al. (1990) DePoy, D. L., Lada, E. A., Gatley, I., & Probst, R. 1990, ApJ, 356, L55
- Dickel (1968) Dickel, H. R. 1968, ApJ, 152, 651
- Felli et al. (1984) Felli, M., Churchwell, E., & Massi, M. 1984, A&A, 136, 53
- Gatley et al. (1979) Gatley, I., Becklin, E. E., Sellgren, K., & Werner, M. W. 1979, ApJ, 233, 575
- Habing (1968) Habing, H. J. 1968, Bull. Astron. Inst. Netherlands, 19, 421
- Hanson et al. (1997) Hanson, M. M., Howarth, I. D., & Conti, P. S. 1997, ApJ, 489, 698
- Hoffmeister et al. (2008) Hoffmeister, V. H., Chini, R., Scheyda, C. M., Schulze, D., Watermann, R, Nürnberger, D., & Vogt, N. 2003, ApJ, 686, 310
- Jiang et al. (2002) Jiang, Z., Yao, Y., Yang, J. et al. 2002, ApJ, 577, 245
- Kaufman et al. (2006) Kaufman, M. J., Wolfire, M. G., & Hollenbach, D. J. 2006, ApJ, 644, 283
- Keene et al. (1985) Keene, J., Blake, G. A., Phillips, T. G., Huggins, P. J., & Beichman, C. A. 1985, ApJ, 299, 967
- Kleinmann & Wright (1973) Kleinmann, D. E., & Wright, E. L. 1973, ApJ, 185, L133
- Mathis (1990) Mathis, J. S. 1990 ARA&A, 28, 37
- Meixner et al. (1992) Meixner, M., Haas, M. R., Tielens, A. G. G. M., Erickson, E. F., & Werner, M. 1992, ApJ, 390, 499
- Meixner and Tielens (1993) Meixner, M., & Tielens, A. G. G. M. ApJ, 405, 216
- Nielbock et al. (2008) Nielbock, M., Chini, R., Hoffmeister, V. H., Nürnberger, D. E. A., Scheyda, C. M., & Steinacker, J. 2008, MNRAS, 388, 1031
- Parravano et al. (2003) Parravano, A., Hollenbach, D. J., & McKee, C. F. 2003, ApJ, 584, 797
- Pellegrini et al. (2006) Pellegrini, E. W., Baldwin, J. A., Brogan, C. L. et al. 2006, ApJ, 658, 1119
- Pérez-Beaupuits et al. (2012) Pérez-Beaupuits, J. P., Wiesemeyer, H., Ossenkopf, V., Stutzki, J., Güsten, R., Simon, R., Hübers, H. W., & Ricken, O. 2012, A&A, 542, L13
- Povich et al. (2007) Povich, M. S., Sone, J. M., Churchwell, E., et al. 2007, ApJ, 660, 346
- Povich et al. (2009) Povich, M. S., Churchwell, E., Bieging, J. H. et al. 2009, ApJ, 696, 1278
- Sheffer et al. (2011) Sheffer, Y., Wolfire, M. G., Hollenbach, D. J., Kaufman, M. J., & Cordier, M. 2011, ApJ, 741, 45
- Smith et al. (2007) Smith, J. D. T., Armus, L., Dale, D. A., et al. 2007, PASP, 119, 1133
- Stutzki et al. (1988) Stutzki, J., Stacey, G. J., Genzel, R., Harris, A. I., Jaffe, D. T., & Lugten, J. B. 1988, ApJ, 332, 379
- Stutzki & Güsten (1990) Stutzki, J., & Güsten, R. 1990, ApJ, 356, 513
- Thronson & Lada (1983) Thronson, H. A., & Lada, C. J. 1983, ApJ, 269, 175
- Tokunaga & Thompson (1979) Tokunaga, A. T., & Thompson, R. I. 1979, ApJ, 229, 583
- Wilson et al. (2003) Wilson, T. L., Hanson, M. M., & Muders, D. 2003, ApJ, 590, 895
- Xu et al. (2011) Xu, Y., Moscadelli, L., Reid, M. J., Menten, K. M., Zhang, B., Zheng, X. W., & Brunthaler, A. 2011, ApJ, 733, 25
| AOR | Date | (J2000) | (J2000) | Exposures |
|---|---|---|---|---|
| (deg) | (deg) | (steps cycles s) | ||
| Module SH: Slit = 47 113, 226/pixel | ||||
| 11543296 | 2004/10/02 | 275.11458 | 16.19700 | 48 1 6.3 |
| 11543552 | 2005/04/23 | 275.11125 | 16.20081 | 48 1 6.3 |
| 11543808 | 2005/04/23 | 275.10792 | 16.20461 | 48 1 6.3 |
| 11544064 | 2005/04/17 | 275.10458 | 16.20842 | 48 1 6.3 |
| 11544320 | 2005/04/17 | 275.10125 | 16.21222 | 48 1 6.3 |
| 11544576 | 2005/04/17 | 275.09792 | 16.21603 | 48 1 6.3 |
| 11544832 | 2005/04/17 | 275.08958 | 16.21572 | 48 1 6.3 |
| 11545088 | 2005/04/17 | 275.08625 | 16.21953 | 48 1 6.3 |
| 11545344 | 2005/04/17 | 275.08292 | 16.22333 | 48 1 6.3 |
| 11545600 | 2005/04/17 | 275.07958 | 16.22714 | 48 1 6.3 |
| 11545856 | 2005/04/17 | 275.07625 | 16.23094 | 48 1 6.3 |
| Module LH: Slit = 111 223, 446/pixel | ||||
| 11546112 | 2005/04/23 | 275.11458 | 16.19700 | 30 1 6.3 |
| 11546368 | 2005/04/17 | 275.10121 | 16.20969 | 30 1 6.3 |
| 11546624 | 2005/04/17 | 275.08563 | 16.22011 | 30 1 6.3 |
| 11546880 | 2005/04/17 | 275.07225 | 16.23281 | 30 1 6.3 |
| Module SL: Slit = 37 57, 185/pixel | ||||
| 17976320 | 2007/10/12 | 275.07213 | 16.22614 | 30 8 14.7 |
| 17976576 | 2007/09/30 | 275.08188 | 16.22347 | 30 8 14.7 |
| 17977344 | 2007/09/30 | 275.09183 | 16.21867 | 30 8 14.7 |
| 17977600 | 2007/09/30 | 275.10083 | 16.20853 | 30 10 6.3 |