Percolation with long-range correlated disorder
Abstract
Long-range power-law correlated percolation is investigated using Monte Carlo simulations. We obtain several static and dynamic critical exponents as function of the Hurst exponent which characterizes the degree of spatial correlation among the occupation of sites. In particular, we study the fractal dimension of the largest cluster and the scaling behavior of the second moment of the cluster size distribution, as well as the complete and accessible perimeters of the largest cluster. Concerning the inner structure and transport properties of the largest cluster, we analyze its shortest path, backbone, red sites, and conductivity. Finally, bridge site growth is also considered. We propose expressions for the functional dependence of the critical exponents on .
pacs:
64.60.ah, 64.60.al, 89.75.DaI Introduction
In percolation on a lattice, each lattice element (site or bond) is occupied with probability or empty with probability . Occupied sites are connected to their nearest neighbors and form clusters, the properties of which depend on Stauffer and Aharony (1994); Sahimi (1994a). There is a threshold value , such that for there exists a cluster spanning between two opposite sides of the lattice. At , a continuous transition occurs between this connected state and the state for , where there is no spanning cluster. The spanning cluster is only fractal at .
Percolation theory and related models have been applied to study transport and geometrical properties of disordered systems Isichenko (1992); Sahimi (1993). Frequently the disorder in the system under study exhibits power-law long-ranged spatial correlations. This fact has motivated some studies of percolation models where the sites of the lattice are not occupied independently, but instead with long-range spatial correlation, in a process named correlated percolation Weinrib (1984); Prakash et al. (1992); Isichenko (1992); Sahimi (1993); Schmittbuhl et al. (1993); Sahimi (1994b); Du et al. (1996); Makse et al. (1995, 1998); Sahimi (1998); Makse et al. (2000); Araújo et al. (2002, 2003); Sandler et al. (2004). The qualitative picture that emerged from those works is that, in the presence of long-range correlations, percolation clusters become more compact and their transport properties change accordingly. These findings have also been confirmed by experimental studies of the transport properties of clusters in correlated invasion percolation Auradou et al. (1999); Schmittbuhl et al. (2000).
The critical exponents of the uncorrelated percolation transition in two dimensions are known rigorously for the triangular lattice Smirnov and Werner (2001). In addition, at the critical point, the correlation-length diverges and universality holds, i.e., critical exponents and amplitude ratios do not depend on short-range details, such as lattice specifics Essam (1980); Isichenko (1992); Sahimi (1993); Stauffer and Aharony (1994); Sahimi (1994a). This statement has been made precise by renormalization group theory, which predicts that the scaling functions within a universality class are the same, while the lattice structure only influences the non-universal metric factors Privman and Fisher (1984); Binney et al. (1992). If, by contrast, infinite-range, power-law correlations are present, according to the extended Harris criterion, the critical exponents can change, depending on how the correlations decay with spatial distance Weinrib and Halperin (1983); Weinrib (1984); Schmittbuhl et al. (1993); Sandler et al. (2004); Janke and Weigel (2004).
Here, we investigate a two-dimensional percolation model where the sites of a lattice are occupied based on power-law correlated disorder generated with the Fourier filtering method Peitgen and Saupe (1988); Prakash et al. (1992); Lauritsen et al. (1993); Makse et al. (1996a); Ballesteros and Parisi (1999); Malamud and Turcotte (1999); Oliveira et al. (2011); Ahrens and Hartmann (2011); Morais et al. (2011). The Hurst exponent of the disorder is related to the exponent of the power-law decay of spatial correlations with the distance; we find that the fractal dimension of the largest cluster, its perimeter, as well as the dimension of its shortest path, backbone, and red sites depend on 111 We note that the correlation parameter in Ref. Prakash et al. (1992) is related to the Hurst exponent used here by . For the analogous parameter of Ref. Weinrib (1984), one has . . Strong dependence on is also found for the electrical conductivity exponent of the largest cluster and the growth of bridge sites in the correlated percolation model. For two-dimensional critical phenomena, conformal field theory has been used to obtain exact values of critical exponents in the form of simple rational numbers Domb and Lebowitz (1987); Di Francesco et al. (1997); Henkel and Karevski (2012). Therefore, we make proposals for the functional dependence of all measured exponents on the Hurst exponent , as being the simplest rational expressions that fit the numerical data.
This work is organized as follows. Section II defines the method of generating long-range correlations and the corresponding correlated percolation model. In Sec. III, we consider the percolation threshold of the used lattice. This result is applied in Sec. IV to measure the fractal dimension of the largest cluster and the scaling behavior of the second moment of the cluster size distribution at the percolation threshold. The complete and accessible perimeters of the largest cluster are investigated in Sec. V. Section VI discusses shortest path, backbone, and red sites of the largest cluster at the threshold. The conductivity of the largest cluster is analyzed in Sec. VII. In Sec. VIII, we discuss the growth exponent of bridge sites in the correlated percolation model. Finally, in Sec. IX, we present some concluding remarks.
II Correlated percolation
To study correlated percolation on a lattice, it is convenient to work with a landscape of random heights , where is the height of the landscape at the lattice site at position Weinrib (1984); Prakash et al. (1992); Isichenko (1992); Schmittbuhl et al. (1993); Kalda (2008); Kondev et al. (2000). Recently, ranked surfaces have been introduced, providing the adequate framework to tackle this problem Schrenk et al. (2012a). The ranked surface of a discrete landscape is constructed as follows: One first ranks all sites in the landscapes according to their height, from the smallest to the largest value. Then, a ranked surface is constructed where each site has a number corresponding to its position in the rank. The following percolation model can then be defined: Initially, all sites of the ranked surface are unoccupied. The sites are occupied one-by-one, following the ranking. At each step, the fraction of occupied sites increases by the inverse of the total number of sites in the surface. By this procedure, a configuration of occupied sites is obtained, the properties of which depend on the landscape. For example, if the heights are distributed uniformly at random, classical percolation with fraction of occupied sites is obtained Newman and Ziff (2000, 2001); Hu et al. (2012).
Here, we study the case where the heights have long-range spatial correlations. Such a power-law correlated disorder can be generated using the Fourier filtering method (Ffm) Peitgen and Saupe (1988); Prakash et al. (1992); Lauritsen et al. (1993); Makse et al. (1996a); Ballesteros and Parisi (1999); Malamud and Turcotte (1999); Sandler et al. (2004); Oliveira et al. (2011); Ahrens and Hartmann (2011); Morais et al. (2011); Fehr et al. (2011a), which is based on the Wiener-Khintchine theorem (WKt) MacDonald (1962); Peitgen and Saupe (1988). The WKt states that the auto-correlation of a time series equals the Fourier transform of its power spectrum, i.e. of the absolute squares of the Fourier coefficients. This fact is exploited in the Ffm by imposing the following power-law form of the power spectrum of the disorder:
| (1) |
where defines the Hurst exponent via . By the WKt, this gives the following correlation function of the heights ,
| (2) |
where the power-law decay of the spatial correlation is described by the Hurst exponent . For correlated percolation, one considers the range Weinrib (1984); Isichenko (1992); Prakash et al. (1992); Schmittbuhl et al. (1993). corresponds to , such that the power spectrum in Eq. (1) is independent on the frequency, and the landscape profile is white noise. This limit recovers uncorrelated percolation. Since , as increases towards zero, the correlation function decays more slowly. In simulations, for a desired value of one can generate random Fourier coefficients of the heights with amplitudes according to the power spectrum in Eq. (1) and then apply an inverse fast Fourier transform to obtain Peitgen and Saupe (1988); Prakash et al. (1992); Lauritsen et al. (1993); Makse et al. (1996a); Ballesteros and Parisi (1999); Malamud and Turcotte (1999); Oliveira et al. (2011); Ahrens and Hartmann (2011); Morais et al. (2011); Fehr et al. (2011a).
The extended Harris criterion, as formulated in Refs. Weinrib and Halperin (1983); Weinrib (1984); Schmittbuhl et al. (1993); Sandler et al. (2004); Janke and Weigel (2004), states that for the range the correlations do not affect the critical exponents of the percolation transition if , where is the correlation-length critical exponent and for , Stauffer and Aharony (1994); Smirnov and Werner (2001). Whereas for the critical exponents are expected to depend on the value of . The quantitative dependence of the critical exponents on , in this regime, is not yet entirely clear. Concerning the correlation-length critical exponent for the correlated case , the analytical works in Refs. Weinrib and Halperin (1983); Weinrib (1984); Schmittbuhl et al. (1993) predict that . In the case of Weinrib and Halperin Weinrib and Halperin (1983); Weinrib (1984) this is a conjecture based on renormalization group calculations; Schmittbuhl et al. Schmittbuhl et al. (1993) found the same result by analyzing hierarchical networks. Therefore, in both analytical approaches, it is not certain that actually behaves as conjectured and there is some controversy regarding this question, as discussed, e.g., in the field-theoretical work of Prudnikov et al. Prudnikov and Fedorenko (1999); Prudnikov et al. (2000). For correlated percolation, the relation has been supported by the numerical work in Refs. Sandler et al. (2004); Abete et al. (2004); Marinov and Lebowitz (2006). Agreement has also been reported by Prakash et al. Prakash et al. (1992), however only approximately for the range . Finally, for there is no percolation transition Schmittbuhl et al. (1993); Olami and Zeitak (1996). In the following, we consider values of the Hurst exponent in the range .
III Percolation threshold
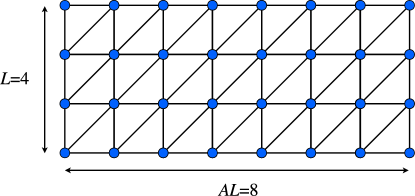
We consider the correlated percolation model defined in Sec. II on triangular lattice stripes of length and aspect ratio , consisting of sites (see Fig. 1). To investigate critical correlated percolation, one first needs to determine the percolation threshold of this lattice. For site percolation on the triangular lattice, it is possible to show that Stauffer and Aharony (1994). The argument of Sykes and Essam Sykes and Essam (1963, 1964) is as follows: For certain lattices, one can find their corresponding matching lattice. In the context of Refs. Sykes and Essam (1963, 1964), this is related to matching expansions of the mean number of clusters for high and low . A more visual explanation of the concept of matching lattice is the following Isichenko (1992): Suppose that for a lattice there exists a different lattice , such that each site in lattice is uniquely related to one site in and the other way around. Also, assume that if a site is occupied in one of the lattices, its partner in the other one can not be occupied. Now, if the presence of a cluster spanning in one direction prevents any cluster spanning in the perpendicular direction and, conversely, there can only be a percolating cluster in if there is no percolation in , then and are matching lattices. For example, the triangular lattice is its own matching lattice, called self-matching, while the square lattice is matched by the star lattice Sykes and Essam (1964). Sykes and Essam argued, based on the uniqueness of the threshold Sykes and Essam (1963, 1964); Kramers and Wannier (1941), that for any lattice and its matching one , the sum of the thresholds of both equals unity:
| (3) |
Then, since the triangular lattice is self-matching, one has and it follows that . The question of which pairs of lattices match each other is independent on the statistical properties of the heights that determine the cluster properties. Therefore, the site percolation threshold of the triangular lattice is , also for correlated percolation. We also checked this statement numerically by measuring for different values of the Hurst exponent , finding that it is compatible with , within error bars 222 We also determined of the square and of the star lattice for various values of and found that, in contrast to the behavior of the triangular lattice, the percolation threshold does depend on . Our results for of the square lattice agree, within error bars, with the ones reported in Ref. Prakash et al. (1992). Also, we have, within error bars, , consistent with the matching property. Besides , an additional advantage of the triangular lattice is that the cluster perimeters (see Sec. V) are well-defined, avoiding common problems encountered on the square lattice Grossman and Aharony (1987); Saberi (2009); Adams et al. (2010); Chatelain (2010). .
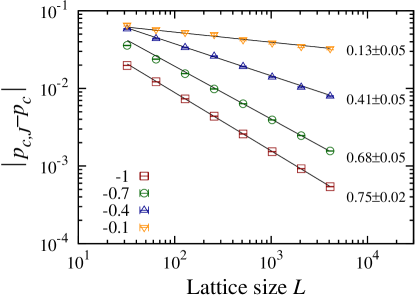
As a first check of the theory presented in Refs. Weinrib and Halperin (1983); Weinrib (1984); Schmittbuhl et al. (1993) regarding the dependence of on , we consider here the convergence of a threshold estimator, namely the value at which the maximum change in the size of the largest cluster occurs Nagler et al. (2011); Chen and D’Souza (2011); Manna (2012); Schrenk et al. (2012b); Reis et al. (2012); Zhang et al. (2012); Cho et al. (2013); Chen et al. (2013). The expected scaling behavior Manna (2012); Schrenk et al. (2013) is
| (4) |
where . Figure 2 shows as function of the lattice size for different values of . Within error bars, the data is compatible with for the considered values of .
IV Maximum cluster size and second moment
At the threshold, , the largest cluster is a fractal of fractal dimension , i.e., its size scales with the lattice size as
| (5) |
This is also related to the order parameter of the percolation transition, which is defined as the fraction of sites in the largest cluster,
| (6) |
and is expected to scale at as
| (7) |
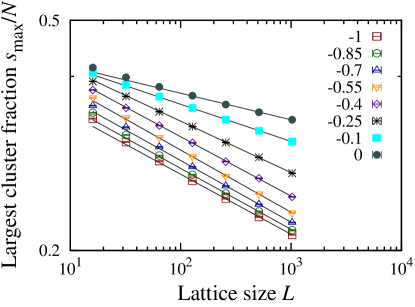
where is the order parameter critical exponent and is the spatial dimension Stauffer and Aharony (1994). For uncorrelated percolation, and , such that Stauffer and Aharony (1994). To measure as function of , we considered the scaling of the size of the largest cluster with the lattice size [see Fig. 3(a) and Eq. (5)]. For different values of , we measured and calculated the local slopes of the data (see e.g. Ref. Grassberger (1999)),
| (8) |
Finally, is extrapolated to the thermodynamic limit, , to obtain , see Fig. 4(a). The fractal dimension is, within error bars, independent on , for . For approaching zero, the value of does increase. While this behavior is in agreement with Ref. Prakash et al. (1992), it is in strong contrast to the behavior of all other fractal dimensions considered in this work, whose values depend strongly on . Based on the data, we propose the following dependence of on (in the range ) as being the simplest rational expression that fits the numerical data:
| (9) |
| (a) |
 |
| (b) |
 |
| (a) |
 |
| (b) |
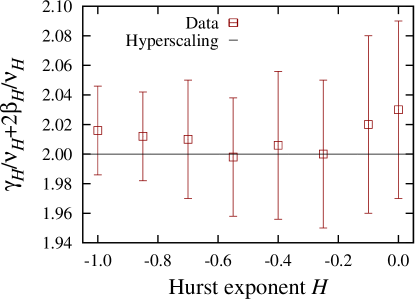 |
The hyperscaling,
| (10) |
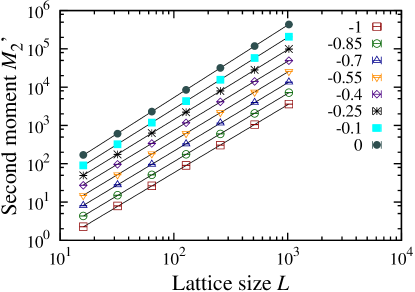
relates the fractal dimension to the susceptibility critical exponent and the correlation-length critical exponent Stauffer and Aharony (1994). For uncorrelated percolation, and therefore Stauffer and Aharony (1994). To test the validity of Eq. (10) for different values of , we measure , where and are the susceptibility and correlation length critical exponents for a certain , by considering the scaling behavior of the second moment , defined as,
| (11) |
where
| (12) |
and the sum goes over all clusters with being the number of sites in cluster . At , the following scaling with the lattice size is expected Stauffer and Aharony (1994); Ziff (2010):
| (13) |
In Fig. 3(b), one sees as function of for different values of . Figure 4(a) shows , while is plotted in Fig. 4(b) for different values of . One observes that the hyperscaling relation, Eq. (10), is fulfilled, within error bars. Based on this result, we propose for the functional dependence of on the Hurst exponent , in the range , as being the simplest rational expression that fits the numerical data:
| (14) |
V Cluster perimeters
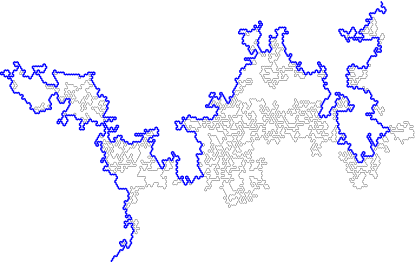
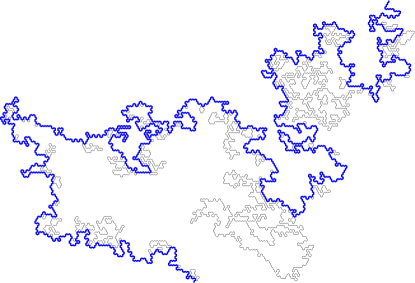
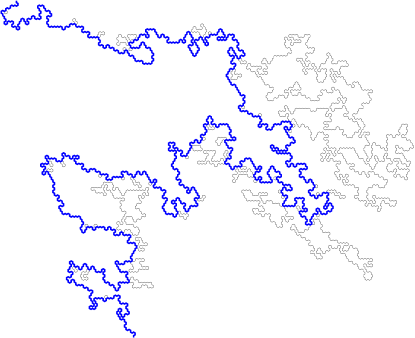
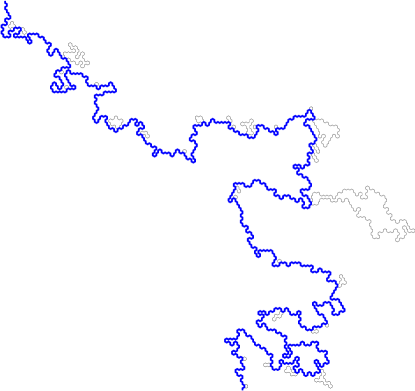
Here, we consider triangular lattice stripes of aspect ratio (Fig. 1). For every largest cluster that spans the lattice vertically (between the long sides of the lattice, Fig. 1) and does not touch its vertical boundaries, there are two contours that can be defined: the complete and accessible perimeters Voss (1984); Sapoval et al. (1985); Ziff et al. (1984); Weinrib and Trugman (1985); Grassberger (1986); Lawler et al. (2001a, b); Asikainen et al. (2003); Adams et al. (2010); Kalda (2001, 2008); Mandre and Kalda (2011). Figure 5 shows the definition of the two perimeters, which live on the honeycomb lattice, in the case of the triangular lattice: The complete perimeter consists of all bonds of the honeycomb lattice that separate sites belonging to the spanning cluster from unoccupied sites that can be reached from the vertical boundaries of the lattice without crossing sites belonging to the largest cluster. If, in addition, fjords of the perimeter with diameter less than (lattice units) are inaccessible, the accessible perimeter is obtained.
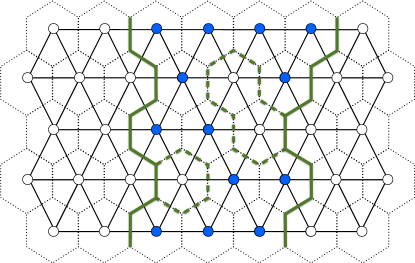
Figure 6 shows the left hand side complete and accessible perimeters of a percolating cluster on a lattice of size .
| (a) | (b) |
 |
 |
| (c) | (d) |
 |
 |
In the upper inset of Fig. 7, the length of the complete perimeter is observed to scale with the lattice size as,
| (15) |
where for the uncorrelated case, given by , it is known that Voss (1984); Sapoval et al. (1985); Lawler et al. (2001a, b).
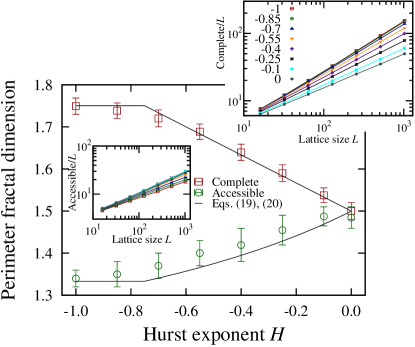
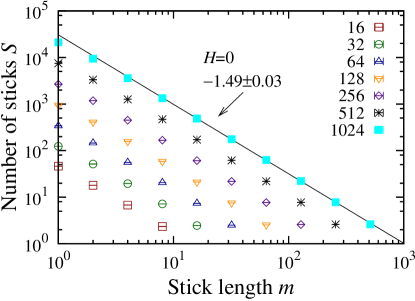
In addition to considering the scaling of with , we also determined the fractal dimension using the yardstick method Mandelbrot (1983); Tricot et al. (1988). There, one measures the number of sticks of size needed to follow the perimeter from one end to the other. Figure 8 shows that, for intermediate stick lengths, scales as
| (16) |
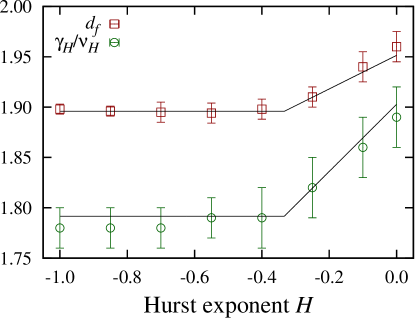
We measured the value of the fractal dimension with this method for different lattice sizes (see Fig. 8) and then extrapolated the results to to obtain . The fractal dimension determined by this method is compatible with the one obtained from the scaling of the length of the perimeter [see Eq. (15)] and we combined both measurements for the final estimates: In Fig. 7, one sees the fractal dimension of the complete perimeter as function of the . For approaching zero, decreases and finally converges towards , in agreement with previous results Kalda (2001, 2008); Mandre and Kalda (2011).
The fractal dimension of the accessible perimeter is defined by the scaling of the length of the accessible perimeter with (see lower inset of Fig. 7),
| (17) |
For uncorrelated percolation the fractal dimension of the accessible perimeter is known to be Grossman and Aharony (1987); Saleur and Duplantier (1987); Lawler et al. (2001a, b). Figure 7 shows , determined using the scaling of and the yardstick method.
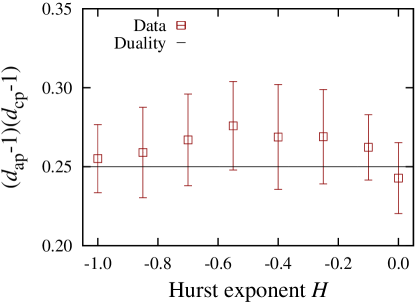
For the critical -state Potts model Wu (1982), Duplantier Duplantier (2000); Janke and Schakel (2004) established the following duality relation between the fractal dimension of the complete perimeter and of the accessible perimeter :
| (18) |
The case corresponds to uncorrelated percolation Fortuin and Kasteleyn (1972). Having measured and as functions of , we see in Fig. 9 that the duality relation of Eq. (18) holds, within error bars, for . Therefore, taking the known results for and into account, we propose the following functional dependence of the complete perimeter fractal dimension on (in the range , see Ref. Mandre and Kalda (2011)):
| (19) |
which, assuming the validity of the duality relation also for correlated percolation, implies the following form of the accessible perimeter fractal dimension:
| (20) |
VI Shortest path, backbone, and red sites
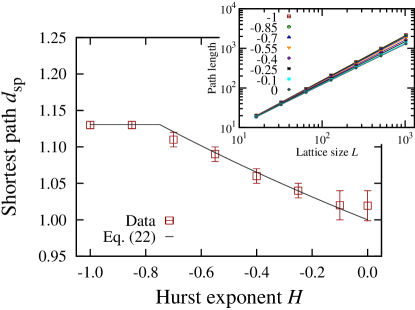
For uncorrelated percolation, the shortest path between two sites in the largest cluster is a fractal of dimension Herrmann et al. (1984); Herrmann and Stanley (1988); Grassberger (1992); Zhou et al. (2012). For a given configuration, it can be identified using the burning method Herrmann et al. (1984): On the cluster spanning the lattice vertically [with aspect ratio (see Fig. 1)], we select one cluster site in the top row and one in the bottom row, such that their Euclidean distance is minimized and find the number of sites in the shortest path between them. The following scaling of the length with the lattice size is observed:
| (21) |
which can be used to determine the fractal dimension using the local slopes [see Eq. (8)], shown in Fig. 10. These results are also compatible with the ones obtained using the yardstick method (not shown). For increasing correlation, deceases and is compatible with unity for , as also reported in Ref. Makse et al. (1996b). Using this observation and the literature results for uncorrelated percolation Herrmann et al. (1984); Herrmann and Stanley (1988); Grassberger (1992); Zhou et al. (2012), we propose the following dependence of on the Hurst exponent (in the range ):
| (22) |
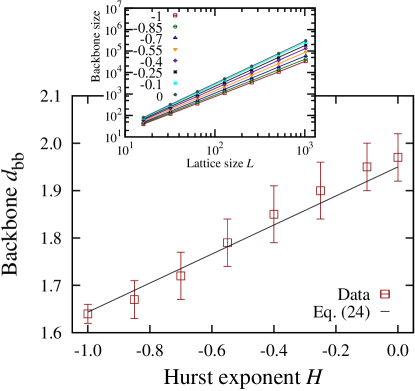
In addition to measuring the length of the shortest path between two sites in the largest cluster, one can also ask which sites would carry non-zero current if the occupied sites would be resistors and a potential difference were applied between these two sites. This subset of sites of the largest cluster is called backbone and it is the union of all non-self-crossing paths between these two sites Stauffer and Aharony (1994); Herrmann and Stanley (1984); Herrmann et al. (1984); Grassberger (1992); Rintoul and Nakanishi (1992); Grassberger (1999); Lawler et al. (2002); Deng et al. (2004). Some sites of the backbone are singly connected, i.e., the connectivity between the two ends of the backbone is broken if any one of these sites is removed. These sites are called red sites Coniglio (1989); Scholder (2009); Schrenk et al. (2012a). Algorithmically, for a given cluster, the backbone and its red sites can be found with the burning method Herrmann et al. (1984). The total number of sites in the backbone scales with the lattice size ,
| (23) |
where is the backbone fractal dimension, see inset of Fig. 11. With increasing , increases and is compatible with the fractal dimension of the largest cluster for approaching zero. Similarly to Ref. Prakash et al. (1992), for the functional dependence of on , we propose to interpolate linearly between the best known value for uncorrelated percolation, Deng et al. (2004) and the fractal dimension of the largest cluster for [see Eq. (9)]:
| (24) |
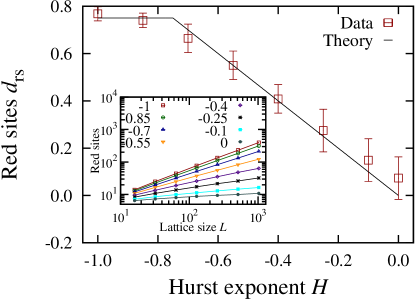
The backbone becomes more compact with increasing correlation, which is also compatible with the fact that the shortest path fractal dimension is decreasing in this limit (see Fig. 10). For the same reason, one would expect the fractal dimension of the set of red sites to decrease with increasing . Coniglio Coniglio (1989) has shown that the red site fractal dimension is related to the correlation-length critical exponent by . To test the theoretical predictions in Refs. Weinrib and Halperin (1983); Weinrib (1984); Schmittbuhl et al. (1993) for , we measured the red site fractal dimension as function of , see Fig. 12. Although for approaching zero the finite size effects become more severe, see inset of Fig. 12, the relation seems to be compatible with the data, in agreement with the results in Refs. Prakash et al. (1992); Schmittbuhl et al. (1993); Sandler et al. (2004); Abete et al. (2004); Marinov and Lebowitz (2006). This is consistent with the finite-size scaling in the percolation threshold estimation (see Sec. III).
VII Cluster conductivity
At the percolation threshold, the backbone of the largest cluster is a fractal and the conductivity between its ends has a power-law dependence on the Euclidean distance of the end sites,
| (25) |
where is the conductivity exponent and we call the reduced conductivity exponent Hong et al. (1984); Derrida and Vannimenus (1982); Zabolitzky (1984); Normand et al. (1988); Lobb and Frank (1984); Frank and Lobb (1988); Prakash et al. (1992); Grassberger (1999); Posé et al. (2012). For uncorrelated percolation, Grassberger (1999). As the backbone becomes more compact with increasing correlation (see Sec. VI), one might expect the conductivity to decay more slowly with the spatial separation, and, consequently, that decreases Prakash et al. (1992); Andrade Jr. et al. (2011).
To measure the conductivity of the backbone, we solved Kirchhoff’s laws and obtained for every site in the backbone:
| (26) |
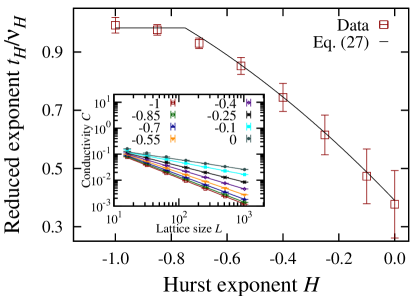
where the sum runs over the nearest neighbors belonging to the backbone of site , and the conductivity is unity between neighboring sites. The boundary conditions are chosen such that on the top end of the backbone and on its bottom end. Solving the sparse linear system of equations one obtains the conductivity and the value of the potential at each site of the backbone (for details, see e.g. Ref. Posé et al. (2012)). The inset of Fig. 13 shows the conductivity as function of the lattice size , for different values of . Since in our setup the distance between the end points , we use this scaling to determine the reduced conductivity exponent , see Fig. 13. Our result for uncorrelated percolation agrees with the literature and one observes to decrease with increasing . We propose the following functional dependence of the reduced conductivity exponent on (in the range ):
| (27) |
VIII Bridge site growth
To explore further the impact of correlations on the structure of percolation clusters, we analyze the bridge sites, which are related to red sites, at the percolation threshold Schrenk et al. (2012a); Fehr et al. (2012); Coniglio (1989). Consider the following modification of the percolation model: While the sites are sequentially occupied, starting from the empty lattice, if a site would lead to the emergence of a spanning cluster between the top and bottom sides of the lattice, this site does not become occupied and is labeled as a bridge site Schrenk et al. (2012a, c, 2013). While the fraction of occupied sites is lower than the percolation threshold , the set of bridge sites is empty, since there would be no percolating cluster in classical percolation for Stauffer and Aharony (1994). At the threshold, the number of bridge sites behaves identically to the number of red sites and diverges with the lattice size as
| (28) |
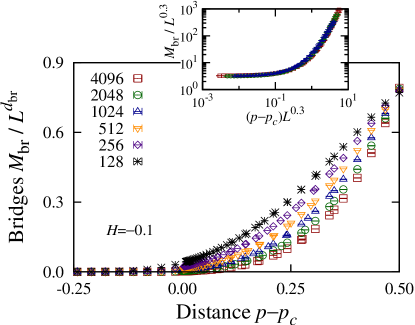
where is the correlation-length critical exponent of percolation Schrenk et al. (2012a); Coniglio (1989); Scholder (2009). For uncorrelated disorder, at , the number of bridge sites grows as a power law with the distance from the threshold,
| (29) |
where Schrenk et al. (2012a) is called the bridge growth exponent (see also Fig. 14). When goes to unity, the set of bridge sites merge to a singly connected line, spanning the lattice horizontally, which is the watershed of the landscape of considered heights , if the top and bottom sides of the lattice would be connected to water outlets Fehr et al. (2009, 2011b); Daryaei et al. (2012); Andrade and Herrmann (2013); Daryaei and Rouhani ; Daryaei . For uncorrelated landscapes, this watershed is a fractal path of dimension Fehr et al. (2012).
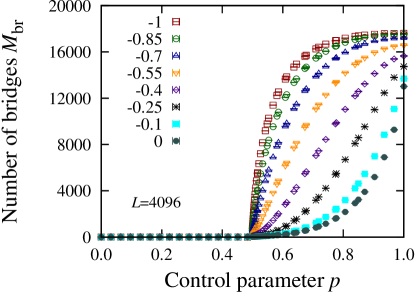
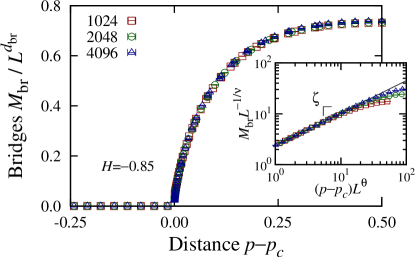
To determine how the bridge site growth depends on , we measured the number of bridge sites as function of , for different values of , see Fig. 14. For values of , we observe that the data for different lattice sizes collapses, when rescaled by , for all values of (see Fig. 15). This suggests that the same crossover scaling as in the uncorrelated case Schrenk et al. (2012a) can be applied to extract the growth exponent :
| (30) |
where the scaling function for large and the power-law behavior of in the lattice size and yields
| (31) |
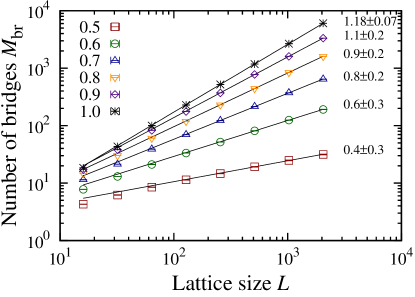
For , the rescaled data is shown in the inset of Fig. 15 and the growth exponent is , larger than for . The corresponding value of yielding the best collapse of the data is , in agreement with the scaling relation of Eq. (31), given the known dependence of the watershed fractal dimension on Oliveira et al. (2011); Fehr et al. (2011a, 2012).
For , the behavior of bridge sites is qualitatively different from the uncorrelated case. The rescaled number of bridge sites does not overlap for different lattice sizes for any value of , except when the complete fractal line has emerged, i.e. for . An example of this behavior, for , is shown in Fig. 16. To analyze this size effect in more detail, we plot in Fig. 17 the number of bridges as function of the lattice size , for different values of . One observes that, in contrast to the uncorrelated case Schrenk et al. (2012a), for , there is no crossover to the fractal dimension of the continuous bridge line . Precisely at the critical point, the expected behavior is still observed.
IX Final remarks
Concluding, we studied percolation with long-range correlation in the site occupation probabilities, as characterized by the Hurst exponent . The site percolation threshold of the triangular lattice was argued to be , independent of . For approaching zero the fractal dimension of the largest cluster, as well as the exponent ratio where found to increase in accordance with the hyperscaling relation. The fractal dimensions of the complete and the accessible perimeter were observed to approach for , while the duality relation between both exponents seems to hold independently on the value of . As increased, the backbone of the largest cluster was observed to become more compact, consistent with the scaling behavior of shortest path, red sites, and conductivity. Finally, we found the bridge growth exponent to increase with increasing . While the qualitative picture is consistent with previous studies in the literature, we proposed quantitative relations for the dependence of the critical exponents of the percolation transition on , as being the simplest rational expressions that fit the numerical data.
Acknowledgements.
We acknowledge financial support from the ETH Risk Center, the Brazilian institute INCT-SC, and grant number FP7-319968 of the European Research Council.References
- Stauffer and Aharony (1994) D. Stauffer and A. Aharony, Introduction to Percolation Theory, 2nd ed. (Taylor and Francis, London, 1994).
- Sahimi (1994a) M. Sahimi, Applications of Percolation Theory (Taylor and Francis, London, 1994).
- Isichenko (1992) M. B. Isichenko, Rev. Mod. Phys. 64, 961 (1992).
- Sahimi (1993) M. Sahimi, Rev. Mod. Phys. 65, 1393 (1993).
- Weinrib (1984) A. Weinrib, Phys. Rev. B 29, 387 (1984).
- Prakash et al. (1992) S. Prakash, S. Havlin, M. Schwartz, and H. E. Stanley, Phys. Rev. A 46, R1724 (1992).
- Schmittbuhl et al. (1993) J. Schmittbuhl, J.-P. Vilotte, and S. Roux, J. Phys. A 26, 6115 (1993).
- Sahimi (1994b) M. Sahimi, J. Phys. I France 4, 1263 (1994b).
- Du et al. (1996) C. Du, C. Satik, and Y. C. Yortsos, AIChE Journal 42, 2392 (1996).
- Makse et al. (1995) H. A. Makse, S. Havlin, and H. E. Stanley, Nature 377, 608 (1995).
- Makse et al. (1998) H. A. Makse, J. S. Andrade Jr., M. Batty, S. Havlin, and H. E. Stanley, Phys. Rev. E 58, 7054 (1998).
- Sahimi (1998) M. Sahimi, Phys. Rep. 306, 213 (1998).
- Makse et al. (2000) H. A. Makse, J. S. Andrade Jr., and H. E. Stanley, Phys. Rev. E 61, 583 (2000).
- Araújo et al. (2002) A. D. Araújo, A. A. Moreira, H. A. Makse, H. E. Stanley, and J. S. Andrade Jr., Phys. Rev. E 66, 046304 (2002).
- Araújo et al. (2003) A. D. Araújo, A. A. Moreira, R. N. Costa Filho, and J. S. Andrade Jr., Phys. Rev. E 67, 027102 (2003).
- Sandler et al. (2004) N. Sandler, H. R. Maei, and J. Kondev, Phys. Rev. B 70, 045309 (2004).
- Auradou et al. (1999) H. Auradou, K. J. Måløy, J. Schmittbuhl, A. Hansen, and D. Bideau, Phys. Rev. E 60, 7224 (1999).
- Schmittbuhl et al. (2000) J. Schmittbuhl, A. Hansen, H. Auradou, and K. J. Måløy, Phys. Rev. E 61, 3985 (2000).
- Smirnov and Werner (2001) S. Smirnov and W. Werner, Math. Res. Lett. 8, 729 (2001).
- Essam (1980) J. W. Essam, Rep. Prog. Phys. 43, 833 (1980).
- Privman and Fisher (1984) V. Privman and M. E. Fisher, Phys. Rev. B 30, 322 (1984).
- Binney et al. (1992) J. J. Binney, N. J. Dowrick, A. J. Fisher, and M. E. J. Newman, The Theory of Critical Phenomena (Oxford University Press, New York, 1992).
- Weinrib and Halperin (1983) A. Weinrib and B. I. Halperin, Phys. Rev. B 27, 413 (1983).
- Janke and Weigel (2004) W. Janke and M. Weigel, Phys. Rev. B 69, 144208 (2004).
- Peitgen and Saupe (1988) H.-O. Peitgen and D. Saupe, eds., The Science of Fractal Images (Springer, New York, 1988).
- Lauritsen et al. (1993) K. B. Lauritsen, M. Sahimi, and H. J. Herrmann, Phys. Rev. E 48, 1272 (1993).
- Makse et al. (1996a) H. A. Makse, S. Havlin, M. Schwartz, and H. E. Stanley, Phys. Rev. E 53, 5445 (1996a).
- Ballesteros and Parisi (1999) H. G. Ballesteros and G. Parisi, Phys. Rev. B 60, 12912 (1999).
- Malamud and Turcotte (1999) B. D. Malamud and D. L. Turcotte, J. Stat. Plan. Infer. 80, 173 (1999).
- Oliveira et al. (2011) E. A. Oliveira, K. J. Schrenk, N. A. M. Araújo, H. J. Herrmann, and J. S. Andrade Jr., Phys. Rev. E 83, 046113 (2011).
- Ahrens and Hartmann (2011) B. Ahrens and A. K. Hartmann, Phys. Rev. B 84, 144202 (2011).
- Morais et al. (2011) P. A. Morais, E. A. Oliveira, N. A. M. Araújo, H. J. Herrmann, and J. S. Andrade Jr., Phys. Rev. E 84, 016102 (2011).
- Note (1) We note that the correlation parameter in Ref. Prakash et al. (1992) is related to the Hurst exponent used here by . For the analogous parameter of Ref. Weinrib (1984), one has .
- Domb and Lebowitz (1987) C. Domb and J. L. Lebowitz, eds., Phase Transitions and Critical Phenomena, Vol. 11 (Academic, London, 1987).
- Di Francesco et al. (1997) P. Di Francesco, P. Mathieu, and D. Sénéchal, Conformal Field Theory (Springer, New York, 1997).
- Henkel and Karevski (2012) M. Henkel and D. Karevski, eds., Conformal invariance: An introduction to loops, interfaces and Stochastic Loewner Evolution, Lecture Notes in Physics, Vol. 853 (Springer, Heidelberg, 2012).
- Kalda (2008) J. Kalda, EPL 84, 46003 (2008).
- Kondev et al. (2000) J. Kondev, C. L. Henley, and D. G. Salinas, Phys. Rev. E 61, 104 (2000).
- Schrenk et al. (2012a) K. J. Schrenk, N. A. M. Araújo, J. S. Andrade Jr., and H. J. Herrmann, Sci. Rep. 2, 348 (2012a).
- Newman and Ziff (2000) M. E. J. Newman and R. M. Ziff, Phys. Rev. Lett. 85, 4104 (2000).
- Newman and Ziff (2001) M. E. J. Newman and R. M. Ziff, Phys. Rev. E 64, 016706 (2001).
- Hu et al. (2012) H. Hu, H. W. J. Blöte, and Y. Deng, J. Phys. A 45, 494006 (2012).
- Fehr et al. (2011a) E. Fehr, D. Kadau, N. A. M. Araújo, J. S. Andrade Jr., and H. J. Herrmann, Phys. Rev. E 84, 036116 (2011a).
- MacDonald (1962) D. K. C. MacDonald, Noise and Fluctuations (Wiley, New York, 1962).
- Prudnikov and Fedorenko (1999) V. V. Prudnikov and A. A. Fedorenko, J. Phys. A 32, L399 (1999).
- Prudnikov et al. (2000) V. V. Prudnikov, P. V. Prudnikov, and A. A. Fedorenko, Phys. Rev. B 62, 8777 (2000).
- Abete et al. (2004) T. Abete, A. de Candia, D. Lairez, and A. Coniglio, Phys. Rev. Lett. 93, 228301 (2004).
- Marinov and Lebowitz (2006) V. I. Marinov and J. L. Lebowitz, Phys. Rev. E 74, 031120 (2006).
- Olami and Zeitak (1996) Z. Olami and R. Zeitak, Phys. Rev. Lett. 76, 247 (1996).
- Sykes and Essam (1963) M. F. Sykes and J. W. Essam, Phys. Rev. Lett. 10, 3 (1963).
- Sykes and Essam (1964) M. F. Sykes and J. W. Essam, J. Math. Phys. 5, 1117 (1964).
- Kramers and Wannier (1941) H. A. Kramers and G. H. Wannier, Phys. Rev. 60, 252 (1941).
- Note (2) We also determined of the square and of the star lattice for various values of and found that, in contrast to the behavior of the triangular lattice, the percolation threshold does depend on . Our results for of the square lattice agree, within error bars, with the ones reported in Ref. Prakash et al. (1992). Also, we have, within error bars, , consistent with the matching property. Besides , an additional advantage of the triangular lattice is that the cluster perimeters (see Sec. V) are well-defined, avoiding common problems encountered on the square lattice Grossman and Aharony (1987); Saberi (2009); Adams et al. (2010); Chatelain (2010).
- Nagler et al. (2011) J. Nagler, A. Levina, and M. Timme, Nat. Phys. 7, 265 (2011).
- Chen and D’Souza (2011) W. Chen and R. M. D’Souza, Phys. Rev. Lett. 106, 115701 (2011).
- Manna (2012) S. S. Manna, Physica A 391, 2833 (2012).
- Schrenk et al. (2012b) K. J. Schrenk, A. Felder, S. Deflorin, N. A. M. Araújo, R. M. D’Souza, and H. J. Herrmann, Phys. Rev. E 85, 031103 (2012b).
- Reis et al. (2012) S. D. S. Reis, A. A. Moreira, and J. S. Andrade Jr., Phys. Rev. E 85, 041112 (2012).
- Zhang et al. (2012) Y. Zhang, W. Wei, B. Guo, R. Zhang, and Z. Zheng, Phys. Rev. E 86, 051103 (2012).
- Cho et al. (2013) Y. S. Cho, S. Hwang, H. J. Herrmann, and B. Kahng, Science 339, 1185 (2013).
- Chen et al. (2013) W. Chen, J. Nagler, X. Cheng, X. Jin, H. Shen, Z. Zheng, and R. M. D’Souza, Phys. Rev. E 87, 052130 (2013).
- Schrenk et al. (2013) K. J. Schrenk, N. A. M. Araújo, and H. J. Herrmann, Phys. Rev. E 87, 032123 (2013).
- Hoshen and Kopelman (1976) J. Hoshen and R. Kopelman, Phys. Rev. B 14, 3438 (1976).
- Grassberger (1999) P. Grassberger, Physica A 262, 251 (1999).
- Ziff (2010) R. M. Ziff, Phys. Rev. E 82, 051105 (2010).
- Voss (1984) R. F. Voss, J. Phys. A 17, L373 (1984).
- Sapoval et al. (1985) B. Sapoval, M. Rosso, and J. F. Gouyet, J. Phys. Lett. 46, L149 (1985).
- Ziff et al. (1984) R. M. Ziff, P. T. Cummings, and G. Stell, J. Phys. A 17, 3009 (1984).
- Weinrib and Trugman (1985) A. Weinrib and S. A. Trugman, Phys. Rev. B 31, 2993 (1985).
- Grassberger (1986) P. Grassberger, J. Phys. A 19, 2675 (1986).
- Lawler et al. (2001a) G. F. Lawler, O. Schramm, and W. Werner, Acta Math. 187, 237 (2001a).
- Lawler et al. (2001b) G. F. Lawler, O. Schramm, and W. Werner, Acta Math. 187, 275 (2001b).
- Asikainen et al. (2003) J. Asikainen, A. Aharony, B. Mandelbrot, E. Rausch, and J.-P. Hovi, Eur. Phys. J. B 34, 479 (2003).
- Adams et al. (2010) D. A. Adams, L. M. Sander, and R. M. Ziff, J. Stat. Mech. , P03004 (2010).
- Kalda (2001) J. Kalda, Phys. Rev. E 64, 020101(R) (2001).
- Mandre and Kalda (2011) I. Mandre and J. Kalda, Eur. Phys. J. B 83, 107 (2011).
- Grossman and Aharony (1987) T. Grossman and A. Aharony, J. Phys. A 20, L1193 (1987).
- Saleur and Duplantier (1987) H. Saleur and B. Duplantier, Phys. Rev. Lett. 58, 2325 (1987).
- Aizenman et al. (1999) M. Aizenman, B. Duplantier, and A. Aharony, Phys. Rev. Lett. 83, 1359 (1999).
- Duplantier (2000) B. Duplantier, Phys. Rev. Lett. 84, 1363 (2000).
- Kondev and Henley (1995) J. Kondev and C. L. Henley, Phys. Rev. Lett. 74, 4580 (1995).
- Mandelbrot (1983) B. B. Mandelbrot, The Fractal Geometry of Nature (Freeman, New York, 1983).
- Tricot et al. (1988) C. Tricot, J. F. Quiniou, D. Wehbi, C. Roques-Carmes, and B. Dubuc, Revue Phys. Appl. 23, 111 (1988).
- Wu (1982) F. Y. Wu, Rev. Mod. Phys. 54, 235 (1982).
- Janke and Schakel (2004) W. Janke and A. M. J. Schakel, Nucl. Phys. B 700, 385 (2004).
- Fortuin and Kasteleyn (1972) C. M. Fortuin and P. W. Kasteleyn, Physica 57, 536 (1972).
- Herrmann et al. (1984) H. J. Herrmann, D. C. Hong, and H. E. Stanley, J. Phys. A 17, L261 (1984).
- Herrmann and Stanley (1988) H. J. Herrmann and H. E. Stanley, J. Phys. A 21, L829 (1988).
- Grassberger (1992) P. Grassberger, J. Phys. A 25, 5475 (1992).
- Zhou et al. (2012) Z. Zhou, J. Yang, Y. Deng, and R. M. Ziff, Phys. Rev. E 86, 061101 (2012).
- Makse et al. (1996b) H. A. Makse, S. Havlin, P. C. Ivanov, P. R. King, S. Prakash, and H. E. Stanley, Physica A 233, 587 (1996b).
- Herrmann and Stanley (1984) H. J. Herrmann and H. E. Stanley, Phys. Rev. Lett. 53, 1121 (1984).
- Rintoul and Nakanishi (1992) M. D. Rintoul and H. Nakanishi, J. Phys. A 25, L945 (1992).
- Lawler et al. (2002) G. F. Lawler, O. Schramm, and W. Werner, Electron. J. Probab. 7, 1 (2002).
- Deng et al. (2004) Y. Deng, H. W. J. Blöte, and B. Nienhuis, Phys. Rev. E 69, 026114 (2004).
- Coniglio (1989) A. Coniglio, Phys. Rev. Lett. 62, 3054 (1989).
- Scholder (2009) O. Scholder, Int. J. Mod. Phys. C 20, 267 (2009).
- Roux (1994) S. Roux, in Non-linearity and breakdown in soft condensed matter, Lecture Notes in Physics, Vol. 437, edited by K. K. Bardhan, B. K. Chakrabarti, and A. Hansen (Springer, Heidelberg, 1994) p. 235.
- Hong et al. (1984) D. C. Hong, S. Havlin, H. J. Herrmann, and H. E. Stanley, Phys. Rev. B 30, 4083 (1984).
- Derrida and Vannimenus (1982) B. Derrida and J. Vannimenus, J. Phys. A 15, L557 (1982).
- Zabolitzky (1984) J. G. Zabolitzky, Phys. Rev. B 30, 4077 (1984).
- Normand et al. (1988) J.-M. Normand, H. J. Herrmann, and M. Hajjar, J. Stat. Phys. 52, 441 (1988).
- Lobb and Frank (1984) C. J. Lobb and D. J. Frank, Phys. Rev. B 30, 4090 (1984).
- Frank and Lobb (1988) D. J. Frank and C. J. Lobb, Phys. Rev. B 37, 302 (1988).
- Posé et al. (2012) N. Posé, N. A. M. Araújo, and H. J. Herrmann, Phys. Rev. E 86, 051140 (2012).
- Andrade Jr. et al. (2011) J. S. Andrade Jr., H. J. Herrmann, A. A. Moreira, and C. L. N. Oliveira, Phys. Rev. E 83, 031133 (2011).
- Fehr et al. (2012) E. Fehr, K. J. Schrenk, N. A. M. Araújo, D. Kadau, P. Grassberger, J. S. Andrade Jr., and H. J. Herrmann, Phys. Rev. E 86, 011117 (2012).
- Schrenk et al. (2012c) K. J. Schrenk, N. A. M. Araújo, and H. J. Herrmann, Sci. Rep. 2, 751 (2012c).
- Fehr et al. (2009) E. Fehr, J. S. Andrade Jr., S. D. da Cunha, L. R. da Silva, H. J. Herrmann, D. Kadau, C. F. Moukarzel, and E. A. Oliveira, J. Stat. Mech. , P09007 (2009).
- Fehr et al. (2011b) E. Fehr, D. Kadau, J. S. Andrade Jr., and H. J. Herrmann, Phys. Rev. Lett. 106, 048501 (2011b).
- Daryaei et al. (2012) E. Daryaei, N. A. M. Araújo, K. J. Schrenk, S. Rouhani, and H. J. Herrmann, Phys. Rev. Lett. 109, 218701 (2012).
- Andrade and Herrmann (2013) R. F. S. Andrade and H. J. Herrmann, Phys. Rev. E 87, 042113 (2013).
- (113) E. Daryaei and S. Rouhani, arXiv:1308.5692 .
- (114) E. Daryaei, arXiv:1309.1207 .
- Saberi (2009) A. A. Saberi, J. Stat. Mech. , P07030 (2009).
- Chatelain (2010) C. Chatelain, J. Stat. Mech. , P08004 (2010).