The properties of cross-correlation and spectra of the low-mass X-ray binary 4U 1608-52
Abstract
With RXTE data, we analyzed the cross-correlation function between the soft and hard X-rays of the transient atoll source 4U 1608-52. We found anti-correlations in three outbursts occurred in 1998, 2002 and 2010, and significant time lags of several hundreds of seconds in the latter two outbursts. Our results show no correlation between the soft and hard X-rays in the island state, and a dominated positive correlation in the lower banana state. Anti-correlations are presented at the upper banana state for the outburst of 2010 and at the lower left banana states for the other two outbursts. So far for atoll sources the cross-correlation has been studied statistically only for 4U 1735-44, where anti-correlations showed up in the upper banana state. Here our investigation upon 4U 1608-52 provides a similar result in its 2010 outburst. In addition, we notice that the luminosities in the upper banana of of 1998 and 2002 outbursts are about 1.5 times that of 2010 outburst whose luminosity in the upper banana is close to that of 4U 1735-44. The results suggest that the states in color-color diagram of a source could be correlated with the luminosity of the source. A further spectral analysis shows that, during the 2010 outburst, although an anti-correlation presents at the highest fluxes, the contemporary spectrum is not the softest one along the outburst evolution. This suggests that the observed anti-correlation may be relevant to the transition between the hard and soft states, which is consistent with the previous results on 4U 1735-44 and several black hole X-ray binaries that anti-correlations are observed during the transition states.
1 Introduction
Low-mass X-ray binaries (LMXBs) with a neutron star (NS) primary can be divided into two subclasses, atoll and Z sources, according to their X-ray spectral and timing properties which depend on the position of the source in the color-color diagram (CCD) (Hasinger & van der Klis, 1989). It is suggested that the accretion rate and magnetic field are different for atoll and Z sources (Zhang, 2007). The luminosity is about 0.001 - 0.5 for atoll sources, while 0.5-1 for Z sources (e.g., Ford et al., 2000; van der Klis, 2006). Also the magnetic field is low for atoll sources ( ), and high for Z sources ( ) (Hasinger & van der Klis, 1989). An obvious morphology difference in CCD is that, the typical atoll source forms a C-shaped track (e.g., Di Salvo et al., 2001), whereas the Z source traces out a Z track (e.g., Jonker et al., 2000).
The atoll sources contain the extreme island state (EIS), the island state (IS), and the banana branch, which is usually subdivided into lower left banana (LLB), lower banana (LB), and upper banana (UB) states. The movement of an atoll source from IS to UB is accompanied with an increasing luminosity which usually denotes an increasing accretion rate . The Z source track in the CCD is divided into three main branches: horizontal branch (HB), the normal branch (NB) and flaring branch (FB). The accretion rate is assumed to increase along the direction of HB-NB-FB (Hasinger et al., 1990). However, recently, the results of studying the source XTE J1701-462 suggest that the branches of the Z track might correspond to a roughly constant accretion rate (Lin et al., 2009; Homan et al., 2010). In addition, Jackson et al. (2009) analyzed the spectra of the Z source GX 5-1, and indicated that the mass accretion rate at the soft apex reaches its minimum. For Z sources, the low frequency quasi-periodic oscillations (QPOs) of 5-60 Hz and Kilohertz (kHz) QPOs are usually detected on the HB and upper NB (e.g., van der Klis, 2000; Casares et al., 2006; van der Klis, 2006).
Usually, there are three models that have been used to explore the spectral properties of NS LMXBs: eastern, western and hybrid models. In the Eastern model, a multicolor disk blackbody (MCD) and a weakly Comptonized blackbody are used for describing the thermal and Comptonized components (e.g., Mitsuda et al., 1989; Agrawal & Sreekumar, 2003). In the Western model, a single-temperature blackbody (BB) from the boundary layer represents the thermal component and Comptonized emission is from the accretion disk (e.g., White et al., 1988; Church & Balucinska-Church, 1995). Lin et al. (2007) suggested a hybrid model, BB plus a broken power law (BPL) are used for the hard state, and two thermal components (MCD and BB) plus a constrained BPL are suit for the soft state. In present, the hybrid model is the most proper for NS LMXBs. At low luminosities, the spectra of atoll sources are hard, which are similar to the low/hard of black hole X-ray binaries (BHXBs) (e.g., van Paradijs & van der Klis, 1994). and at high luminosities, the spectra are much soft (e.g., Di Salvo et al., 2000). However, the spectra of Z source are always soft during its three branches.
Both the spectral and timing analyses are approaches for understanding physical changes in the sources emission. The evolution of cross-correlation function between different X-ray energy bands is a useful means for exploring geometrical structure of the accretion disk. Earlier works show already detection of anti-correlations for Z sources and BHXBs. The cross-correlations of two Z sources (Cyg X-2, GX 5-1) have been analyzed and anti-correlated lags of several 10-100 s are found in the HB and upper NB (Lei et al., 2008; Sriram et al., 2012; Lei et al., 2013a). BHXBs consist of three states, hard, thermal, and steep power law (SPL) states, where SPL state represents the intermediate state (McClintock & Remillard, 2006). Such anti-correlated lags of a few hundred seconds are also detected in the SPL states of a few BHXBs (Choudhury et al., 2005; Sriram et al., 2007, 2009, 2010). The large timescale of lags could be interpreted by the viscous timescales of the inner accretion disk (Sriram et al., 2012). Sriram et al. (2010) suggested in their simulations that the observed phenomena of an anti-correlation should be relevant to some real physical processes, of which we know little from the current observations.
A tip of the iceberg of having anti-correlations for atoll sources was firstly revealed in 4U 1735-44 (Lei et al. 2013a), and then on 4U 1608-52 from one outburst (Lei et al., 2013b). To probe the whole, it is obvious that one needs more observations to consolidate the results. In the paper, we study the cross-correlations of 4U 1608-52 statistically with all available RXTE data . 4U 1608-52 is a transient source that undergoes outburst with a waiting period of varying from 70 days to years, and a flux variability of about 2 orders of magnitude. 4U 1608-52 has a distance of 5.8 kpc, neutron star mass of M = 1.74 0.14 (Güver et al., 2010). Its X-ray spectra have been studied in some works (e.g., Gierliński & Done, 2002; Chen et al., 2006; Lin et al., 2007). The timing properties of 4U 1608-52 have been analyzed, and kHz QPOs have been detected with frequencies ranging from 500 to 1050 Hz (e.g., Berger et al., 1996; Mendez et al., 1998; van Straaten et al., 2003). Vaughan et al. (1997, 1998) and de Avellar et al. (2013) show the energy and frequency dependence of the Fourier time lags and intrinsic coherence of the kHz QPOs. The organization of the paper is that, the observations and data analysis of RXTE are introduced in Sec.2, the results derived from investigating the evolution of the cross-correlation between the soft (2-3.3 keV) and hard (12-30 keV) X-rays along the CCD are shown in Sec.3, and these findings are compared with those from 4U 1735-44, Z sources and a few BHXBs in Sec.4.
2 Observation and Data Reduction
The long-term light curves of 4U 1608-52 from the RXTE All-Sky Monitor (ASM) are shown in Figure 1 (Levine et al. 1996). Embedded in light curves are a variety of outbursts showing up with different morphology in amplitude and duration. We analyzed all data available from the RXTE proportional counter array (PCA) observations, covering a time period of 1996 March 3 – 2011 December 28. PCA contains 5 non-imaging, co-aligned Xe multiwire proportional counter units (PCUs) (Jahoda et al., 2006). We exclude data of those with earth limb elevation angle less than , pointing offset greater than , or influence by the type I bursts. Only PCU2 data are adopted because PCU2 is the best calibrated unit and has the longest observational duration. The light curves are extracted from the data of standard 2 mode with bin size of 16 s, and prepared for carrying out the cross-correlation function after excluding those with duration shorter than 2000 s. The cross-correlation function is obtained with the XRONOS tool “crosscor” which computes the cross correlation by a FFT algorithm. With this tool, the coefficient and time lag are estimated simultaneously between different energy bands (Brinkman et al., 1974; Weisskopf et al., 1975). In this work we take two energy bands, defined as the soft at 2-3.3 keV and the hard at 12-30 keV.
The cross-correlation results are divided into three groups in the same way of the previous work: positive, ambiguous and anti-correlated cases (also see Lei et al., 2008). The correlated coefficient and time lag can be obtained by fitting the anti-correlated part of the cross-correlation function with an inverted Gaussian function. For the observations detected with anti-correlation, Figure 2 shows the background subtracted light curves, the anti-correlations between soft and hard X-rays, and the pivoting spectra. The pivoting spectra are obtained from the hard regions (hardness ratio being 10% more than the average at 12-30 keV/2-3.3 keV) and the soft regions (hardness ratio being 10% less than the average at 12-30 keV/2-3.3 keV).
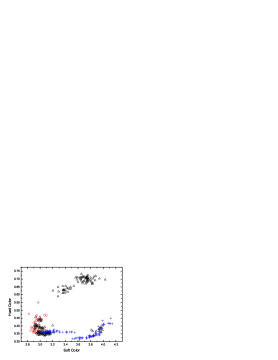
For building the CCDs and studying the distribution of cross-correlated results, the soft and hard colors are defined as the count-rate ratios 3.5-6.0 keV/2.0-3.5 keV and 9.7-16 keV/6.0-9.7 keV (also see O’Brien et al., 2004). The background subtracted light curves are extracted from standard 2 mode data at 2.0-3.5 keV, 3.5-6.0 keV, 6.0-9.5 keV and 9.5-16 keV, respectively. Figure 3 shows the CCDs of the outbursts where the anti-correlations are found in 512 s time bins. For spectral analysis, the PCA background is subtracted with the latest versions of the appropriate background models for Epoch 3 of the mission (1996 April 15 -1999 March 22). A systematic error of 0.6% is added to the spectrum to account for the calibration uncertainties in spectral fitting with software version 12.8.0 (Schafer, 1991; Arnaud, 1996).
3 Results
3.1 The results of cross-correlations and their distribution on the CCD
With all the data of RXTE, for each segment of the light curves of the transient atoll source 4U 1608-52, we have analyzed the cross-correlation function between the soft (2-3.3 keV) and hard (12-30 keV) X-rays. The anti-correlations are detected in these outbursts occurred in 1998, 2002 and 2010, and the results are listed in Table 1 for those observations with positive or ambiguous correlations, their average hardness ratios and the time lag estimated from the positive correlations. One sees from Figure 3 that, for the 1998 and 2002 outbursts, ambiguous correlations are for all IS and dominant for LLB, but the positive correlations show up in LB by 50 percents. For the 2010 outburst, we have both positive and anti-correlations in the UB, and the results in LLB and LB are similar to the other two outbursts. We notice that, the time lags are detected in general insignificant for all the three outbursts. The most significant detection is at about 3 level, derived from one observation in LLB of 1998 outburst (see Table 1 and Figure 2), with a positively correlated lags of several hundred seconds.
The anti-correlations are detected from two observations in 1998 outburst, one observation in 2002 outburst and one observation in 2010 outburst, as shown in Figure 2 for their light curves and anti-correlations. The corresponding results are presented in Table 2 and Figure 3. We notice the different locations in CCD for the detected anti-correlations: in LLB (i.e., the transient state between IS and LB) for the 1998 and 2002 outbursts and in UB for the 2010 outburst. The time lags are not obvious in the 1998 outburst but significantly presenting in 2002 and 2010 outbursts. The hard X-rays are found to lag to soft X-rays by 168 32 s on October 1, 2002, and 628 43 s on March 8, 2010. Similar results were reported previously from the the atoll source 4U 1735-44, the Z sources Cyg X-2 and GX 5-1 (Lei et al., 2008; Sriram et al., 2012; Lei et al., 2013a). We show in Figure 2 the spectral evolution of the soft and hard regions of the light curves and in Table 2 the pivoting energies.
3.2 Spectral variation
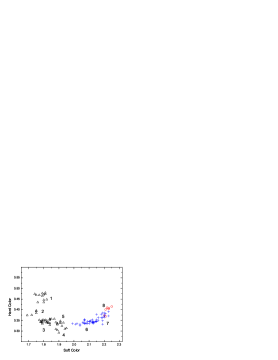
Both the spectrum and the cross-correlation function are strongly correlated with the position in the CCD. For understanding the spectral dependence of the cross-correlation function, we divide the CCD of the 2010 outburst into 8 regions, as shown in the right panel of Figure 3, and perform spectral fitting for the data clumped within each region. Based on the so-called hybrid model of Lin et al. (2007), we fit these spectra at 2.5-25 keV with the multi-color disk model ( in XSPEC), blackbody ( in XSPEC) plus broken power-law ( in XSPEC). The iron line is fitted by a Gaussian function with a center energy constrained within 6.2-7.3 keV and a width fixed at 0.1 keV (Lin et al., 2007). The photo-electric absorption column ( in XSPEC) is fixed at the value of = 1.0 cm-2 (Penninx et al., 1989), since the low energy coverage makes it hard to estimate the absorption with PCA observation alone. In practice of the spectral fitting with BPL, the broken energies are constrained to 10 keV and the initial photon index to 2.5 (Lin et al., 2007). Figure 4 shows the fitted spectra.
The spectral fitting results are listed in Table 3. The source is in LLB for regions 1-3, where the Comptonized components are found to contribute to about 20% - 50% (Lin et al., 2007). Along with the flux increasing in regions 4-7, the soft X-ray components (disk blackbody and blackbody) start to play a role, which is in accordance with an increasing accretion rate in CCD. Both the temperatures of the disk and blackbody increase with the flux till the region 7, beyond of which the temperature starts to decrease in region 8 where the flux reaches to a maximum. This is similar to that observed in 4U 1735-44: the spectrum of the highest flux is not the softest, which suggests undergoing a state transition.
4 Discussions
4.1 Comparison to the atoll source 4U 1735-44
For probing the cross-correlated evolution of atoll sources, which was hinted firstly from 4U 1735-44, we analyzed the cross-correlations of X-ray transient atoll source 4U 1608-52 systematically, and found results similar to those from 4U 1735-44: the ambiguous correlation dominates the IS and LB are dominated respectively by correlations of the ambiguous and the positive. In general, the cold photons are supposed to come from the accretion disk, and the high energy photons from the hot corona. In the IS, the low accretion rate leads to the accretion disk boundary be blocked away from the hot corona, and hence the ambiguity soft and hard X-rays. In the LB, the accretion rate increases and the accretion disk moves inward. The closer corona and inner disk favor a response of the corona to the disk seed photons and hence a positive correlation between the soft and hard X-rays.
There are 4 observations with anti-correlation detected through 1998, 2002 and 2010 outbursts, among them 2 show significant time lags. For the 1998 and 2002 outbursts, the anti-correlations are detected in the LLB, which are corresponding to the transitions between the hard state (IS) and soft state (LB). For the 2010 outburst, the anti-correlation is detected in the top of UB, which corresponds to the maximum flux for the outburst. According to the results of (Lin et al., 2007), for atoll sources, at the highest flux, the Comptonized component is at the lowest and negligible level. From the results of spectral fitting of 2010 outburst, in the top of UB where anti-correlation is detected, i.e., at the highest flux, the Comptonized component is not the lowest. Therefore, the top of UB could be corresponding to the transition states. These results of 4U 1608-52 are consistent with the results of atoll source 4U 1735-44 whose anti-correlation are also detected in the UB. In addition, we notice that the highest luminosity of 2010 outburst is close to that of 4U 1735-44, and the highest luminosities of 1998 and 2002 outbursts are nearly 1.5 times higher than that of 2010 outburst. Therefore, the position of anti-correlation could be related to the range of the luminosity, which could be affected by the geometry and physical condition of the accretion disk. When the highest luminosity of the outburst is large, the anti-correlation occurs in LLB, and vice versi, the anti-correlation occurs in UB. The anti-correlation and luminosity could have a certain correlation. These results suggest that the transition states in CCD of a source may be in evolution with the luminosity of the source. For exploring the relation, more sources need to be studied.
4.2 Comparison to Z sources (Cyg X-2 and GX 5-1)
There are two Z sources (Cyg X-2, GX 5-1) whose cross-correlations have been studied, and the anti-correlations were detected in the HB and the upper NB (Lei et al., 2008; Sriram et al., 2012). However, the anti-correlated observations of atoll sources are found in LLB or UB. For atoll source, the accretion rate increases from IS to UB. Therefore, the relation between the accretion rate and the cross-correlation of soft and hard X-rays is relatively clear. For Z sources, the relation between the accretion rate and the position of CCD is controversial. Assuming that the accretion rate increases along the HB-NB-FB on the CCD, then the anti-correlations should be corresponding to the lower accretion rate. However, Jackson et al. (2009)’s model for Z track suggested that the accretion rate is low in the soft apex between NB and FB, in this case, the anti-correlations are consistent with the high accretion rate. There’s also the perception that the accretion rate could be constant along the Z track (Lin et al., 2009). For Z sources, the distribution of cross-correlation in the CCD is known, but the relation between it and the accretion rate is still an open question.
For Z sources, a movement along CCD is in general accompanied with different evolution of radio activities. The radio emission become stronger in the HB. Therefore, the structure of accretion disk of Z sources could be correlated with the jet where radio emissions come from. Most of atoll sources usually show radio luminosity lower than Z sources, thus our understanding is still rather vague. Migliari et al. (2003)’s studies about atoll source 4U 1728-34 show that, weaker and persistent radio emission is observed when the source is steadily in the hard X-ray state, and the strongest and most variable emission seems to be associated with the transitions between hard (IS) and softer (LB) X-ray states. If a similar situation is also held for 4U 1608-52, the anti-correlations that are detected in the transient states may be relevant to with radio flaring, which in turn suggests that the structural changes of the accretion disk could be coupled with the jet activity.
4.3 Comparison to some BHXBs in a context of the truncated disk model
Based on the timing and spectral characteristics, BHXBs can be divided into five distinct states: quiescent state, low/hard state(LHS), intermediate state (IMS), high/soft state (HSS), and very high state (VHS) (Remillard, 2005; Remillard & McClintock, 2006; Belloni, 2010). Due to similar spectral and timing features, the VHS is also taken as IMS, and represents the transitions between LHS and HSS (Done et al., 2007). Atoll sources share lots of properties with BHXBs. A few BHXBs were reported with several 100-1000 s anti-correlated lags in the CCF of soft and hard X-ray bands in the SPL/IM states (Choudhury et al., 2005; Sriram et al., 2007, 2009, 2010). We find for atoll source 4U 1608-52 anti-correlations in LLB and UB. Similar to those in the atoll source 4U 1735-44, for 4U 1608-52, the LB could be responsible to the HSS of a black hole, and the UB to the VHS. Therefore, our results of atoll sources are similar with those of BHXBs: both of their anti-correlations are detected in the transition states.
For BHXBs, the truncated accretion disk model is popularly used to explain the spectral and temporal features (Done et al., 2007). It is proposed that an accretion flow of BHXB consists of two zones with a transition radius, an inner advection-dominated accretion flow (ADAF) and an outer standard thin disk (Esin et al., 1997). The disk is usually considered to be truncated at a large radial distance in the LHS, and it becomes non-truncated in the HSS. For the SPL/IM state, the spectral and temporal results of the studying various black hole sources suggest that the accretion disk is truncated in a radius very close to the black hole (e.g, Sriram et al., 2010). In the BHXBs, the detected anti-correlation indicates that the ADAF condenses and expands to the inner disk, resulting in that the anti-correlation in flux between the soft and hard X-rays. The IMS has been considered as the most probably spectral state in which the condensation of the inner hot matter can transform into an inner disk (Liu et al., 2007; Meyer et al., 2007; Sriram et al., 2010). However, the truncated accretion disk is not supported by some observational results (Miller et al., 2006; Rykoff et al., 2007). Analysis of iron line is helpful for understanding the structure and physics of the innermost accretion disk (Stella, 1990). Done & Gierliński (2006) suggested that the detected smeared iron emission line can be explained with truncated disk models. In addition, the instead narrow iron line of GX 339-4 is consistent with the truncated disk geometry (Done & Diaz Trigo, 2010). In the high/soft states of the atoll source 4U 1705-44, a similar profile of iron emission line was found, which suggests that the accretion disk could be also truncated in the high/soft states of atoll source (di Salvo et al., 2009). The alternative view is that the narrow iron line might also come from the outflows in BHXBs (Laurent & Titarchuk, 2007). The physical condition of NS is more complex, our study about anti-correlation is helpful for exploring the geometry of the accretion disk in LMXBs. The spectral and timing characteristics derived for the different states suggest that the accretion disk is dynamically changing. The anti-correlated lags of several hundred seconds can not be explained by only the Comptonization process which only accounts for 1 second timescale lags (Hasinger, 1987; Nowak et al., 1999; Böttcher & Liang, 1999). The timescale of the anti-correlated lag corresponds to the viscous timescale of the inner accretion disk, which suggests the viscous re-adjustment timescale of a hypothetical truncation radius. The observed time lag and spectral changes sustain that the truncated accretion disk is the most probable physical configuration (Sriram et al., 2012).
The NS systems are different from the BHXBs, which is complex due to a solid surface and magnetic field of compact object. In LMXBs, the hard X-ray emission is usually considered to origin from the Comptonization of the soft seed photons. The soft seed photons could origin from the accretion disk or jets in BHXBs (Markoff & Nowak, 2004). However in NS systems, both the surface of the NS and the accretion disk can provide the soft seed photons. The Comptonized region might correspond to a hot corona, a hot flared inner disk, or even the boundary layer between the NS and accretion disk (also see Popham & Sunyaev, 2001; Qu et al., 2001). Weng & Zhang (2011) suggested that the magnetosphere of NS LMXB might go inside the innermost stable circular orbit (ISCO) when the luminosity go beyond a critical luminosity, and in this case, the NS systems will follow the same evolutionary pattern in the disk of BHXBs. If the luminosity is beyond a critical luminosity, the Comptonizing cloud shrinks, as the soft seed photons increases, it cools the Compton cloud and hard flux decreases. The luminosity of the UB is higher, and the accretion disk can extend down to ISCO, which can result in the anti-correlations of the soft and hard X-rays. According to our spectral analysis, it can be seen that the inner radius of the accretion disk decreases at higher accretion rate. These results are consistent with BHXBs whose anti-correlations are detected in the SPL/IM state where the accretion disk could be truncated very close to the compact object (Sriram et al., 2010).
In summary, our studies of 4U 1608-52 provide further evidences for having anti-correlations in atoll source apart from those hinted firstly in 4U 1735-44. The anti-correlations are found to occur in CCD at the regions of the LLB or UB, which could be decided by the luminosity. These results are in align with those discovered in BHXBs in a sense that, these anti-correlations are responding to the state transitions of the source spectral evolution. A time lag of several hundred seconds as discovered in the data of anti-correlations is consistent with the re-adjustment timescale of truncation disk. In short, what we found currently upon 4U 1608-52 may reveal so far only a tip of the iceberg for the atoll sources in general, and definitely more observations are expected in future to tell us more.
References
- Agrawal & Sreekumar (2003) Agrawal, V. K., & Sreekumar, P. 2003, MNRAS, 346, 933
- Arnaud (1996) Arnaud, K. A. 1996, Astronomical Data Analysis Software and Systems V, 101, 17
- Belloni (2010) Belloni, T. M. 2010, Lecture Notes in Physics, Berlin Springer Verlag, 794, 53
- Berger et al. (1996) Berger, M., van der Klis, M., van Paradijs, J., et al. 1996, ApJ, 469, L13
- Böttcher & Liang (1999) Böttcher, M., & Liang, E. P. 1999, ApJ, 511, L37
- Brinkman et al. (1974) Brinkman, A. C., Parsignault, D. R., Schreier, E., et al. 1974, ApJ, 188, 603
- Casares et al. (2006) Casares, J., Cornelisse, R., Steeghs, D., et al. 2006, MNRAS, 373, 1235
- Chen et al. (2006) Chen, X., Zhang, S. N., & Ding, G. Q. 2006, ApJ, 650, 299
- Choudhury & Rao (2004) Choudhury, M., & Rao, A. R. 2004, ApJ, 616, L143
- Choudhury et al. (2005) Choudhury, M., Rao, A. R., Dasgupta, S., et al. 2005, ApJ, 631, 1072
- Church & Balucinska-Church (1995) Church, M. J., & Balucinska-Church, M. 1995, A&A, 300, 441
- de Avellar et al. (2013) de Avellar, M. G. B., Méndez, M., Sanna, A., & Horvath, J. E. 2013, MNRAS, 433, 3453
- Di Salvo et al. (2000) Di Salvo, T., Iaria, R., Burderi, L., & Robba, N. R. 2000, ApJ, 542, 1034
- Di Salvo et al. (2001) Di Salvo, T., Méndez, M., van der Klis, M., Ford, E., & Robba, N. R. 2001, ApJ, 546, 1107
- di Salvo et al. (2009) di Salvo, T., D’Aí, A., Iaria, R., et al 2009, MNRAS, 398, 2022
- Done & Gierliński (2006) Done, C., & Gierliński, M. 2006, MNRAS, 367, 659
- Done et al. (2007) Done, C., Gierliński, M., & Kubota, A. 2007, A&A Rev., 15, 1
- Done & Diaz Trigo (2010) Done, C., & Diaz Trigo, M. 2010, MNRAS, 407, 2287
- Esin et al. (1997) Esin, A. A., McClintock, J. E., & Narayan, R. 1997, ApJ, 489, 865
- Ford et al. (2000) Ford, E. C., van der Klis, M., Méndez, M., et al. 2000, ApJ, 537, 368
- Gierliński & Done (2002) Gierliński, M., & Done, C. 2002, MNRAS, 337, 1373
- Güver et al. (2010) Güver, T., Özel, F., Cabrera-Lavers, A., & Wroblewski, P. 2010, ApJ, 712, 964
- Hasinger (1987) Hasinger, G. 1987, IAU Symp. 125: The Origin and Evolution of Neutron Stars, 125, 333
- Hasinger & van der Klis (1989) Hasinger, G., & van der Klis, M. 1989, A&A, 225, 79
- Hasinger et al. (1990) Hasinger, G., van der Klis, M., Ebisawa, K., Dotani, T., & Mitsuda, K. 1990, A&A, 235, 131
- Homan et al. (2010) Homan, J., van der Klis, M., Fridriksson, J. K., et al. 2010, ApJ, 719, 201
- Jackson et al. (2009) Jackson, N. K., Church, M. J., & Bałucińska-Church, M. 2009, A&A, 494, 1059
- Jahoda et al. (2006) Jahoda, K., Markwardt, C. B., Radeva, Y., et al. 2006, ApJS, 163, 401
- Jonker et al. (2000) Jonker, P. G., van der Klis, M., Wijnands, R., et al. 2000, ApJ, 537, 374
- Laurent & Titarchuk (2007) Laurent, P., & Titarchuk, L. 2007, ApJ, 656, 1056
- Lei et al. (2008) Lei, Y. J., Qu, J. L., Song, L. M., et al. 2008, ApJ, 677, 461
- Lei et al. (2013b) Lei, Y. J., Zhang, H. T., Luo, A. L., & Zhao, Y. H. 2013, IAU Symposium, 290, 249
- Lei et al. (2013a) Lei, Y.-J., Zhang, H.-T., Zhang, C.-M., et al. 2013, AJ, 146, 60
- Lin et al. (2007) Lin, D., Remillard, R. A., & Homan, J. 2007, ApJ, 667, 1073
- Lin et al. (2009) Lin, D., Remillard, R. A., & Homan, J. 2009, ApJ, 696, 1257
- Liu et al. (2007) Liu, B. F., Taam, R. E., Meyer-Hofmeister, E., & Meyer, F. 2007, ApJ, 671, 695
- Markoff & Nowak (2004) Markoff, S., & Nowak, M. A. 2004, ApJ, 609, 972
- McClintock & Remillard (2006) McClintock, J. E., & Remillard, R. A. 2006, Compact stellar X-ray sources, 157
- Mendez et al. (1997) Mendez, M., et al. 1997, ApJ, 485, L37
- Mendez et al. (1998) Mendez, M., van der Klis, M., Wijnands, R., et al. 1998, ApJ, 505, L23
- Meyer et al. (2007) Meyer, F., Liu, B.F., & Meyer-Hofmeister, E. 2007, A&A, 463, 1
- Miller et al. (2006) Miller, J. M., et al. 2006, ApJ, 653, 525
- Migliari et al. (2003) Migliari, S., Fender, R. P., Rupen, M., et al. 2003, MNRAS, 342, L67
- Mitsuda et al. (1989) Mitsuda, K., Inoue, H., Nakamura, N., & Tanaka, Y. 1989, PASJ, 41, 97
- Nowak et al. (1999) Nowak, M. A., Wilms, J., & Dove, J. B. 1999, ApJ, 517, 355
- O’Brien et al. (2004) O’Brien, K., Horne, K., Gomer, R. H., Oke, J. B., & van der Klis, M. 2004, MNRAS, 350, 587
- Penninx et al. (1989) Penninx, W., Damen, E., van Paradijs, J., Tan, J., & Lewin, W. H. G. 1989, A&A, 208, 146
- Popham & Sunyaev (2001) Popham, R., & Sunyaev, R 2001, AIP Conf. Proc. 599: X-ray Astronomy: Stellar Endpoints, AGN, and the Diffuse X-ray Background, 599, 870
- Qu et al. (2001) Qu, J. L., Yu, W., & Li, T. P. 2001, ApJ, 555, 7
- Remillard (2005) Remillard, R. A. 2005, in AIP Conf. Proc. 797, Interacting Binaries: Accretion, Evolution, and Outcomes, ed. L. Burderi et al. (Melville, NY: AIP),231
- Remillard & McClintock (2006) Remillard, R. A., & McClintock, J. E. 2006, ARA&A, 44, 49
- Rykoff et al. (2007) Rykoff, E. S., Miller, J. M., Steeghs, D., & Torres, M. A. P. 2007, ApJ, 666, 1129
- Schafer (1991) Schafer, R. A. 1991, XSPEC, an X-ray spectral fitting package: version 2 of the user’s guide (ESA TM, 1013-7076, 09; Paris: European Space Agency)
- Sriram et al. (2007) Sriram, K., Agrawal, V. K., Pendharkar, Jayant K., Rao, A. R. 2007, ApJ, 661, 1055
- Sriram et al. (2009) Sriram, Kandulapati; Kiron, Yellapragada Ravi; Vivekananda Rao, Pasagada 2009, RAA, 9, 901
- Sriram et al. (2010) Sriram, K., Rao, A. R., Choi, C. S. 2010, ApJ, 725, 1317
- Sriram et al. (2012) Sriram, K., Choi, C. S., Rao, A. R. 2012, ApJS, 200, 16
- Stella (1990) Stella, L. 1990, Nature, 344, 747
- van der Klis (2000) van der Klis, M. 2000, ARA&A, 38, 717
- van der Klis (2006) van der Klis, M. 2006, in Compact stellar X-ray sources, W.H.G. Lewin & M. van der Klis (Cambridge: Cambridge University Press) 39
- van Paradijs & van der Klis (1994) van Paradijs, J., & van der Klis, M. 1994, A&A, 281, L17
- van Straaten et al. (2003) van Straaten, S., van der Klis, M., & Méndez, M. 2003, ApJ, 596, 1155
- Vaughan et al. (1997) Vaughan, B. A., van der Klis, M., Mendez, M., et al. 1997, ApJ, 483, L115
- Vaughan et al. (1998) Vaughan, B. A., van der Klis, M., Méndez, M., et al. 1998, ApJ, 509, L145
- Weisskopf et al. (1975) Weisskopf, M. C., Kahn, S. M., & Sutherland, P. G. 1975, ApJ, 199, L147
- Weng & Zhang (2011) Weng, S.S., & Zhang, S.N. 2011, ApJ, 739, 42
- White et al. (1988) White, N. E., Stella, L., & Parmar, A. N. 1988, ApJ, 324, 363
- Zhang (2007) Zhang, C. 2007, Advances in Space Research, 40, 1480


| ObsID | Date | Delay (s) | CC | Hardness Ratio | |
|---|---|---|---|---|---|
| 1998 outburst | |||||
| positive-correlation | |||||
| 30188-01-01-00 | 1998-02-03 | 3087 | 0.410.02 | 0.361/3.467 | |
| 30188-01-04-00 | 1998-02-05 | 1426 | 0.410.04 | 0.338/3.811 | |
| 30062-03-01-00 | 1998-02-06 | -3.07.7 | 0.400.06 | 0.338/3.840 | |
| 30062-03-01-02_1 | 1998-02-06 | 17.319.0 | 0.260.04 | 0.388/3.938 | |
| 30062-03-01-02_2 | 1998-02-06 | 11.112.1 | 0.340.03 | 0.409/4.058 | |
| 30062-03-01-02_3 | 1998-02-06 | -8.420.5 | 0.270.04 | 0.365/3.936 | |
| 30062-03-01-03_1 | 1998-02-06 | 18.119.0 | 0.440.04 | 0.330/3.798 | |
| 30062-03-01-03_2 | 1998-02-06 | -27.028.1 | 0.310.08 | 0.326/3.625 | |
| 30502-01-10-00 | 1998-02-07 | -1128 | 0.700.05 | 0.333/3.799 | |
| 30062-02-01-02_2 | 1998-03-26 | 24877 | 0.110.02 | 0.361/3.087 | |
| 30062-01-02-02 | 1998-04-04 | -101236 | 0.140.03 | 0.364/3.135 | |
| 30062-01-02-00_1 | 1998-04-05 | 4653 | 0.250.03 | 0.362/3.241 | |
| 30062-01-02-00_2 | 1998-04-05 | -7.517.9 | 0.200.05 | 0.368/3.207 | |
| 30062-01-02-00_3 | 1998-04-05 | -5.112.0 | 0.270.07 | 0.365/3.142 | |
| ambiguous | |||||
| 30188-01-11-00 | 1998-02-08 | 0.382/3.958 | |||
| 30062-02-01-01_1 | 1998-03-25 | 0.389/3.037 | |||
| 30062-02-01-01_2 | 1998-03-25 | 0.400/2.948 | |||
| 30062-02-01-01_3 | 1998-03-25 | 0.403/2.929 | |||
| 30062-02-01-01_4 | 1998-03-25 | 0.389/2.945 | |||
| 30062-02-01-02_1 | 1998-03-26 | 0.359/3.130 | |||
| 30062-01-01-00_2 | 1998-03-27 | 0.355/3.097 | |||
| 30062-01-01-01_2 | 1998-03-28 | 0.354/3.002 | |||
| 30062-01-01-02 | 1998-03-29 | 0.362/2.992 | |||
| 30062-01-01-04_1 | 1998-03-31 | 0.620/3.377 | |||
| 30062-01-01-04_2 | 1998-03-31 | 0.627/3.396 | |||
| 30062-01-01-04_3 | 1998-03-31 | 0.647/3.396 | |||
| 30062-01-02-01 | 1998-04-03 | 0.441/2.993 | |||
| 30062-01-02-03 | 1998-04-07 | 0.353/3.023 | |||
| 30062-01-02-04_1 | 1998-04-09 | 0.349/3.110 | |||
| 30062-01-02-04_2 | 1998-04-09 | 0.346/3.073 | |||
| 30062-02-02-01 | 1998-04-20 | 0.690/3.713 | |||
| 30062-02-02-00 | 1998-04-22 | 0.678/3.784 | |||
| 30062-01-03-00_1 | 1998-06-03 | 0.708/3.708 | |||
| 30062-01-03-00_2 | 1998-06-03 | 0.712/3.708 | |||
| 30062-01-03-00_3 | 1998-06-03 | 0.706/3.735 | |||
| 30062-01-03-00_4 | 1998-06-03 | 0.712/3.692 | |||
| 2002 outburst | |||||
| positive-correlation | |||||
| 70058-01-15-00 | 2002-07-27 | 3.36.1 | 0.520.08 | 0.3200/2.106 | |
| 70059-01-03-01 | 2002-08-02 | 1924 | 0.320.04 | 0.3139/2.026 | |
| 70059-01-03-02 | 2002-08-02 | -1212 | 0.430.03 | 0.3140/2.051 | |
| 70058-01-20-00 | 2002-08-03 | -2.130.7 | 0.380.05 | 0.3159/2.056 | |
| 70059-01-04-00_1 | 2002-08-04 | -1145 | 0.270.05 | 0.3115/1.960 | |
| 70059-01-04-00_2 | 2002-08-04 | 1518 | 0.520.02 | 0.3059/1.931 | |
| 70058-01-21-00 | 2002-08-05 | 9.410.1 | 0.600.02 | 0.3133/2.031 | |
| 70059-01-05-00_1 | 2002-08-06 | 2.38.2 | 0.450.06 | 0.3153/2.035 | |
| 70059-01-05-00_2 | 2002-08-06 | -3.616.6 | 0.320.07 | 0.3178/2.061 | |
| 70058-01-23-01 | 2002-08-07 | 1319 | 0.230.08 | 0.3206/1.954 | |
| 70058-01-23-00 | 2002-08-10 | 5.16.2 | 0.530.06 | 0.3190/2.007 | |
| 70059-01-07-00_1 | 2002-08-11 | -6.39.3 | 0.520.06 | 0.3211/2.032 | |
| 70059-01-07-00_2 | 2002-08-11 | 0.79.3 | 0.560.03 | 0.3354/2.083 | |
| 70058-01-25-00 | 2002-08-12 | -2530 | 0.260.04 | 0.3192/1.897 | |
| 70059-01-08-00_2 | 2002-08-13 | 4.39.6 | 0.440.06 | 0.3224/2.028 | |
| 70059-01-08-00_4 | 2002-08-13 | -5.38.1 | 0.510.05 | 0.3278/2.041 | |
| 70058-01-24-00 | 2002-08-14 | -1315 | 0.260.04 | 0.3542/2.076 | |
| 70059-01-09-00_1 | 2002-08-16 | 1119 | 0.480.08 | 0.3293/2.048 | |
| 70059-01-09-00_3 | 2002-08-16 | 1.48.6 | 0.250.08 | 0.3456/2.069 | |
| 70058-01-26-00 | 2002-08-17 | 8.016.5 | 0.320.04 | 0.3193/1.8005 | |
| 70059-01-10-00_1 | 2002-08-18 | 2642 | 0.190.04 | 0.3242/1.899 | |
| 70059-01-10-00_2 | 2002-08-18 | -2032 | 0.240.05 | 0.3212/1.952 | |
| 70059-01-10-00_3 | 2002-08-18 | 1925 | 0.350.04 | 0.3390/2.051 | |
| 70058-01-27-00 | 2002-08-19 | -1617 | 0.340.04 | 0.3259/1.847 | |
| 70059-01-11-00_1 | 2002-08-20 | 85106 | 0.410.03 | 0.3230/1.838 | |
| 70059-01-11-00_2 | 2002-08-20 | -1515 | 0.320.05 | 0.3223/1.916 | |
| 70059-01-11-00_3 | 2002-08-20 | 2.214.4 | 0.590.03 | 0.3230/1.922 | |
| 70058-01-28-00 | 2002-08-21 | -2.637.1 | 0.220.05 | 0.3243/1.909 | |
| 70059-01-12-00 | 2002-08-22 | -7.714.0 | 0.310.05 | 0.3385/2.019 | |
| 70059-01-12-01_1 | 2002-08-22 | -6.718.7 | 0.250.07 | 0.3405/1.984 | |
| 70059-01-12-01_2 | 2002-08-22 | 2.44.1 | 0.410.15 | 0.3757/2.003 | |
| 70058-01-29-00 | 2002-08-23 | -4.024.5 | 0.180.05 | 0.3529/2.021 | |
| 70058-01-30-00 | 2002-08-25 | 0.54.7 | 0.430.15 | 0.3262/1.873 | |
| 70059-01-14-01 | 2002-08-26 | -6.312.2 | 0.360.06 | 0.3303/1.949 | |
| 70059-01-14-00_1 | 2002-08-26 | -1310 | 0.590.02 | 0.3348/2.017 | |
| 70058-01-31-00 | 2002-08-27 | 2323 | 0.250.06 | 0.3309/1.884 | |
| 70059-01-15-00_1 | 2002-08-28 | -1929 | 0.410.03 | 0.3413/1.996 | |
| 70059-01-15-00_2 | 2002-08-28 | -0.39.4 | 0.460.09 | 0.3276/1.977 | |
| 70059-01-15-00_3 | 2002-08-28 | 9.59.8 | 0.220.05 | 0.3567/2.021 | |
| 70058-01-32-00 | 2002-08-29 | 2013 | 0.380.06 | 0.3274/1.904 | |
| 70059-01-16-00_1 | 2002-08-30 | -1.032.0 | 0.250.03 | 0.3223/1.803 | |
| 70059-01-16-00_2 | 2002-08-30 | -7.213.1 | 0.260.13 | 0.3238/1.803 | |
| 70059-01-16-00_3 | 2002-08-30 | -1624 | 0.190.06 | 0.3265/1.863 | |
| 70059-01-17-01 | 2002-09-01 | 4751 | 0.230.03 | 0.3337/1.756 | |
| 70059-01-17-00 | 2002-09-01 | 2323 | 0.200.05 | 0.3295/1.782 | |
| 70059-01-18-00_2 | 2002-09-03 | -2219 | 0.200.07 | 0.3299/1.841 | |
| 70058-01-35-00 | 2002-09-04 | 3.622.5 | 0.420.15 | 0.3290/1.910 | |
| 70059-01-19-00_1 | 2002-09-05 | -1521 | 0.320.03 | 0.3282/1.756 | |
| 70059-01-19-00_2 | 2002-09-05 | 4.315.2 | 0.310.10 | 0.3282/1.777 | |
| 70058-01-36-00 | 2002-09-06 | -5044 | 0.260.03 | 0.3341/1.756 | |
| 70059-01-21-00_2 | 2002-09-09 | 1115 | 0.150.03 | 0.3349/1.903 | |
| 70058-01-38-00 | 2002-09-10 | 1529 | 0.230.06 | 0.3342/1.954 | |
| 70059-01-22-00_1 | 2002-09-11 | 0.99.8 | 0.350.06 | 0.3338/1.888 | |
| 70059-01-22-00_2 | 2002-09-11 | 2256 | 0.360.03 | 0.3346/1.784 | |
| 70059-01-22-00_3 | 2002-09-11 | 2743 | 0.160.04 | 0.3317/1.737 | |
| 70059-03-01-00 | 2002-09-12 | 1919 | 0.250.05 | 0.3270/1.708 | |
| 70059-01-23-00 | 2002-09-21 | 6.318.4 | 0.170.05 | 0.3217/1.773 | |
| ambiguous | |||||
| 70058-01-09-00 | 2002-05-30 | 0.6446/1.926 | |||
| 70059-01-08-00_1 | 2002-08-13 | 0.3528/2.078 | |||
| 70059-01-09-00_2 | 2002-08-16 | 0.3647/2.083 | |||
| 70059-01-13-00 | 2002-08-24 | 0.3558/2.003 | |||
| 70059-01-14-00_2 | 2002-08-26 | 0.3412/2.024 | |||
| 70059-01-20-00 | 2002-09-07 | 0.3468/1.714 | |||
| 70058-01-37-00 | 2002-09-08 | 0.3404/1.733 | |||
| 70059-03-01-01 | 2002-09-11 | 0.3336/1.705 | |||
| 70059-03-02-00 | 2002-09-14 | 0.3296/1.744 | |||
| 70059-03-02-02 | 2002-09-14 | 0.3286/1.741 | |||
| 70059-03-02-07 | 2002-09-15 | 0.3271/1.707 | |||
| 70069-01-01-01 | 2002-09-20 | 0.3250/1.751 | |||
| 70059-01-23-00 | 2002-09-21 | 0.3229/1.726 | |||
| 70069-01-01-03 | 2002-09-24 | 0.3711/1.682 | |||
| 70069-01-01-00 | 2002-09-25 | 0.4922/1.746 | |||
| 70069-01-01-04 | 2002-09-26 | 0.5884/1.798 | |||
| 70069-01-02-00 | 2002-09-27 | 0.6174/1.729 | |||
| 70059-01-26-00 | 2002-09-29 | 0.3156/1.698 | |||
| 70069-01-03-03 | 2002-10-02 | 0.4932/1.793 | |||
| 70059-01-28-00 | 2002-10-03 | 0.5097/1.770 | |||
| 70069-01-03-00 | 2002-10-05 | 0.5676/1.811 | |||
| 70059-01-24-00 | 2002-10-05 | 0.5640/1.778 | |||
| 70069-01-03-04 | 2002-10-07 | 0.4357/1.740 | |||
| 70069-01-03-07 | 2002-10-08 | 0.4000/1.716 | |||
| 70059-01-29-00 | 2002-10-09 | 0.2754/1.770 | |||
| 70069-01-03-08 | 2002-10-10 | 0.2943/1.850 | |||
| 70069-01-04-00 | 2002-10-11 | 0.2591/1.786 | |||
| 70069-01-04-01 | 2002-10-12 | 0.5530/1.807 | |||
| 70069-01-04-07 | 2002-10-12 | 0.5795/1.827 | |||
| 70069-01-04-02 | 2002-10-13 | 0.6205/1.849 | |||
| 70069-01-04-03 | 2002-10-14 | 0.6135/1.768 | |||
| 70069-01-07-05 | 2002-11-17 | 0.3381/1.859 | |||
| 2010 outburst | |||||
| positive-correlation | |||||
| 95334-01-02-04 | 2010-03-07 | -1763 | 0.290.06 | 0.3404/2.102 | |
| 95334-01-02-14 | 2010-03-07 | 1112 | 0.380.05 | 0.3412/2.134 | |
| 95334-01-02-08_1 | 2010-03-08 | -9.522.0 | 0.290.06 | 0.3757/2.187 | |
| 95334-01-02-01 | 2010-03-09 | -0.311.9 | 0.290.05 | 0.3330/2.037 | |
| 95334-01-02-11 | 2010-03-10 | 1833 | 0.380.04 | 0.3694/2.203 | |
| 95334-01-03-00 | 2010-03-12 | 8.712.1 | 0.400.05 | 0.3444/2.123 | |
| 95334-01-03-01 | 2010-03-13 | -7693 | 0.140.04 | 0.3496/2.082 | |
| ambiguous | |||||
| 95334-01-01-00 | 2010-03-04 | 0.3098/1.910 | |||
| 95334-01-02-03 | 2010-03-05 | 0.3378/1.884 | |||
| 95334-01-03-03 | 2010-03-15 | 0.3535/1.838 | |||
| 95334-01-03-04 | 2010-03-16 | 0.3492/1.790 | |||
| 95334-01-03-05 | 2010-03-17 | 0.3411/1.801 | |||
| 95334-01-03-06 | 2010-03-18 | 0.4626/1.789 | |||
| 95334-01-04-01 | 2010-03-20 | 0.3860/1.742 |
We label the segments ( 2000 s) of the light curves by , , and so on.
| ObsID | Date | Location | Delay (s) | CC | Hardness Ratio | Pivoting |
|---|---|---|---|---|---|---|
| 30062-01-01-03 | 1998-03-30 | LLB | 136136 | -0.180.01 | 0.4468/2.978 | 8.5 |
| 30062-01-02-05 | 1998-04-11 | LLB | -100102 | -0.150.02 | 0.3866/2.943 | 10 |
| 70059-01-27-00 | 2002-10-01 | LLB | 16832 | -0.220.01 | 0.4712/1.741 | 6 |
| 95334-01-02-08_2 | 2010-03-08 | UB | 62843 | -0.180.02 | 0.4000/2.223 | 4 |
| Parameters | (keV) | (keV) | (d.o.f) | |||||
|---|---|---|---|---|---|---|---|---|
| 1 | 0.44/2.56 (17.2%) | 1.00/2.56 (39.1%) | 1.11/2.56(43.4%) | 1.01(47) | ||||
| 2 | 0.34/1.50 (22.7%) | 0.87/1.50 (58.0%) | 0.29/1.50(19.3%) | 0.75(46) | ||||
| 3 | 1.04/4.73 (22.0%) | 1.97/4.73 (41.6%) | 1.70/4.73(35.9%) | 1.12(46) | ||||
| 4 | 0.18/0.94 (19.0%) | 0.72/0.94 (72.3%) | 0.08/0.94(8.5%) | 1.08(41) | ||||
| 5 | 0.37/1.53 (24.2%) | 1.02/1.53 (66.7%) | 0.14/1.53(9.2%) | 0.99(40) | ||||
| 6 | 5.87/10.5 (55.9%) | 2.67/10.5 (25.4%) | 1.92/10.5(18.3%) | 0.89(40) | ||||
| 7 | 7.66/13.28 (57.7%) | 4.11/13.28 (30.9%) | 1.47/13.28(11.1%) | 0.92(40) | ||||
| 8 | 6.18/14.23 (43.4%) | 5.72/14.23 (40.2%) | 2.29/14.23(16.1%) | 0.76(40) |
The flux is calculated in the energy band 2.5-25 keV, and is in unit of 10-9 ergs cm-2 s-1. Errors are quoted at a 90% confidence level. The letters 1, 2, 3 and so on are labeled as the segments in the light curve.