Infrared absorption by graphene-hBN heterostructures
Abstract
We propose a theory of optical absorption in monolayer graphene-hexagonal boron nitride (hBN) heterostructures. In highly oriented heterostructures, the hBN underlay produces a long-range moiré superlattice potential for the graphene electrons which modifies the selection rules for absorption of incoming photons in the infrared to visible frequency range. The details of the absorption spectrum modification depend on the relative strength of the various symmetry-allowed couplings between the graphene electrons and the hBN, and the resulting nature of the reconstructed band structure.
pacs:
78.67.Wj 73.20.-r 78.20.BhHeterostructures of graphene with hexagonal boron nitride (hBN) feature moiré patterns [1, 2, 4, 3, 5, 6] which are the result of the slight incommensurability of the periods of these two crystals, or of their misalignment. For Dirac electrons in graphene, a periodic geometrical pattern in the atomic arrangement of the two superimposed honeycomb lattices translates into a hexagonal superlattice with the period , determined by the lattice constants of graphene and of hBN (), and the misalignment angle . Due to the Bragg scattering from this long-period superlattice, Dirac electrons in graphene acquire a miniband spectrum, which is reflected in tunneling [2, 3] and magnetotransport characteristics, including the recent observation of a fractal Hofstadter spectrum in such heterostructures subjected to a strong magnetic field [5, 6].
In general, there are three characteristic types of moiré miniband structures for graphene electrons predicted by recent theories [3, 5, 6, 7, 8, 9]: miniband spectra without a distinct separation between the lowest and other minibands; quite exceptionally, a case where the first miniband is separated from the next miniband by a triplet of secondary Dirac points (sDPs) in both of the graphene valleys; and more generically, the case where a single sDP in the first miniband appears in one of the two inequivalent corners of hexagonal miniature Brollouin zone (mBZ) of moiré superlattice. Also, a generic moiré superlattice potential violates the electron-hole symmetry in the otherwise symmetric Dirac spectrum of graphene electrons, making the appearance of minibands different in the valence and conduction band sides of the graphene spectrum [7]. In this paper, we investigate how these three chracteristic moiré miniband types are reflected in the absorption spectra in the infrared to visible optical range. It has been noticed in recent tight-binding model studies [10, 11] that, as compared to the universal absorption coefficient per graphene layer, the absorption of light by Dirac electrons in twisted two-layer graphenes (which also feature a moiré superlattice) acquires the most robust features due to the edges and van Hove singularities of the first minibands. These are affected by both the modulation of the density of states and the sublattice structure of the electron Bloch states in graphene modified by the superlattice. Here, we employ the recently proposed phenomenological theory of generic moiré superlattices in graphene on hexagonal substrates [7] to analyse the absorption spectrum of the modified Dirac electrons, with a view to using optical transmission spectroscopy to narrow down the parameter set describing the moiré superlattice in graphene-hBN heterostructures.
The phenomenological model for moiré superlattices in graphene-hBN heterostructures is described by the Hamiltonian [7]
| (1) | |||||
where
The reciprocal lattice vectors are related by rotations, and . This Hamiltonian acts on four-component wavefunctions describing the electron amplitudes on graphene sublattices and (acted upon by Pauli matrices ) and in the two principal valleys and , accounted for by respectively in Equation (1). The first term in Equation (1) is the unperturbed Hamiltonian of graphene where is the momentum of the electron. Among the other three contributions towards , the first describes a simple potential modulation; the second the - sublattice asymmetry, locally imposed by the substrate; and the third the modulation of - hopping associated with a pseudo-magnetic field. In each of these contributions, the first and second terms inside the round brackets respectively describe the inversion symmetric and antisymmetric parts of the moiré perturbation. Here, we use the energy scale , so that are dimensionless parameters.
The inversion-symmetric perturbation in Equation (1) determines a gapless miniband spectrum, with the sDP singularities either at the edge of the first miniband, or embedded into a continuous spectrum at higher energies, whereas the asymmetric part opens a ‘zero-energy’ gap and gaps at the secondary Dirac points in the conduction and valence bands ( respectively),
However, recent transport experiments [5, 6] did not show any pronounced gap at the miniband edges, and either no gap [5] or a small gap [6] at zero energy (), telling us that the inversion-asymmetric part of the moiré superlattice potential is weak. This agrees with the ansatz made in Reference [7] that only one out of the two sublattices (either N or B atoms) of the honeycomb lattice of hBN top layer dominates in the coupling with the graphene electrons, thus making the effective lattice of the hBN perturbation simple hexagonal and prescribing inversion symmetry to the moiré potential. Therefore, in the following we assume that and neglect the inversion asymmetric terms in the analysis of optical absorption in the infrared-to-visible range.
Besides the above described dominance of the inversion-symmetric part in the moiré superlattice potential, very little is known for definite about the values of the superlattice parameters in Equation (1). Two microscopic models, based on either hopping between the graphene carbon atoms and the hBN atoms [8], or on scattering of graphene electrons by the quadropole electric moments of nitrogen atoms [7] predict similar a relationship between coupling constants , , and in Equation (1),
| (2) |
with , to compare with for and for . However, rather simplistic approximations are used in these models, and one must assume much larger values of superlattice potential parameters to relate the theory to the recent magneto-transport data [7]. This suggests that what these models show is that all three inversion-symmetric interaction terms in the Hamiltonian in Equation (1) should be taken into account in a comprehensive phenomenological theory of moiré superlattice in graphene-hBN heterostructures. Having all this in mind, the purpose of the following analysis is to establish what characteristic features in the heterostructure absorption spectrum can be attributed to one or another combination of moiré parameters, with a view to narrowing down their choice based on the combination of the transport data with the forthcoming optical studies. Note that the deviation of the optical absorption by electrons in a heterostructure from the universal graphene absorption coefficient would be most pronounced in a spectral range around (from infrared at to visible at ): for much lower photon frequencies, electron states are almost the same as in the unperturbed Dirac spectrum [7], whereas photons of much higher energies involve transitions between numerous overlapping minibands such that individual spectral features would be smeared out by the faster inelastic relaxation of photoexcited electrons and holes.
The coefficient of absorption of light described by energy and polarization is
where , stands for the miniband energy found by diagonalization of the Hamiltonian in Equation (1), are the occupation numbers, is the normalization area of the miniband plane wave states, and is the broadening of the energy states (we take unless otherwise stated). We also find numerically the eigenstates of to calculate the matrix elements of the current operator,
where are Dirac current operators. The above equation gives the selection rules for optical transitions between the miniband states (we neglect the momentum transfer due to absorption of the photon), and take into account the spin and valley degeneracy. The symmetry of the moiré pattern implies that there is no dependence of on the polarization angle of the light, and after taking into account the fact that the two valleys in the graphene spectrum are related by time-inversion symmetry, we conclude that the absorption spectrum is independent of the polarization state of photons.
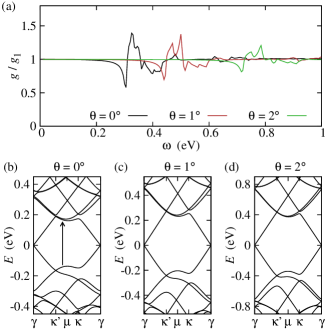
Figure 1(a) shows the features of the absorption spectrum when the Fermi energy is at the Dirac point, calculated for the realization of the moiré superlattice with substantially sizeable amplitudes and the weight of parameters , , and set in Equation (2). In this case, the electron spectrum belongs to the most generic type: it features a sDP at the corner of the first miniband on the valence band side and overlapping bands on the conduction band side. It is strongly electron-hole asymmetric, which makes the spectral features of the superlattice less pronounced. The optically active transitions which provide the deviation from the standard absorption come from the edge of the mBZ, as shown by the arrow in Figure 1(b). This figure also shows the tendency of the spectral features to stretch into higher energies and gradually decrease in size with increasing misalignment angle.
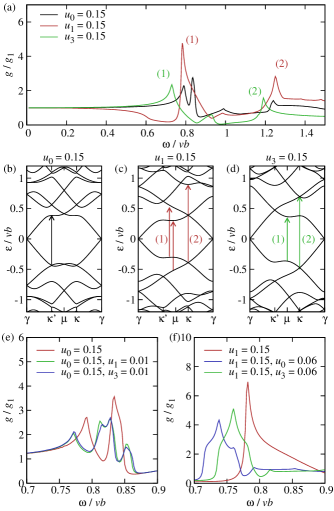
It is also instructive to analyse spectra for more peculiar realizations of moiré superlattice, starting only with one of the three terms in the perturbation, and then increasing the size of the others. The corresponding evolution of the absorption spectra for is shown in Figure 2(a) for each of the three interaction terms. The distinctive feature of a pure interaction [black line, band structure shown in Figure 2(b)] is the double peak structure near . Figure 2(e) shows the spectra for the same interaction with a small or interaction added for the frequency interval near the double peak. For both added interactions, each part of the double peak is split in two destroying this simple structure. Therefore, the most obvious identifying feature of a strong interaction is masked by even weak additions of the other two interactions. The red line in Figure 2(a) is the spectrum for the interaction, with the associated band structure in Figure 2(c). There are two key features to this spectrum, the first being that the initial deviation from the standard result for low is downwards, not upwards as for the pure and interactions. The second key feature is the strong single peak at due to the electron-hole symmetry of the interaction allowing van Hove singularities in both the valence and conduction bands to contribute to the absorption simultaneously, as indicated by the double arrow marked ‘(1)’ in Figure 2(c). In Figure 2(f) we show this peak with a strong mixture of the and interactions [compare the size of the perturbation to that in Figure 2(e)]. For both additional interactions, the position of the peak has shifted a little and decreased slightly in height, but the peak is still clearly identifiable indicating that this spectral feature is rather robust against perturbation by the other two interactions. Finally, the interaction is shown by the green line in Figure 2(a) and the band structure in Figure 2(d). The identifying feature in this case is the small peak followed by a large frequency range where the absorption is suppressed substantially below the value of .
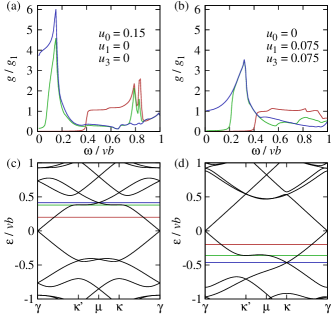
Figure 3 illustrates several examples of how the absorption spectrum would be modified by change in the carrier density (and Fermi energy ) in the heterostructure. In contrast to unperturbed graphene (where Pauli blocking simply suppresses absorption at ) here, due to Bragg scattering of electrons by the superlattice potential, empty states in higher minibands of the valence band or filled states in higher minibands of the conduction band open new absoption channels.
In conclusion, we have demonstrated that optical spectroscopy with infra-red and visible radiation may be used to gain insight into the detailed characterization of the interaction between layers in graphene-hBN heterostructures with a small misalignment angle. Since the exact parameters of this interaction are unknown, we have described the general features of optical spectroscopy due to each of the interaction terms allowed by symmetry, and linked these parameters to the formation of secondary Dirac points in the heterostructure spectrum and nearby van Hove singularities in the moiré miniband spectra. We also show that the modification of the optical transitions rules, due to the Bragg scattering of graphene electrons off the moiré superlattice, modify the doping dependence of graphene absorption spectrum, in a manner very sensitive to the detailed structure of moiré superlattice potential.
References
References
- [1] Dean CR et al. 2010 Nat. Nano 5 722.
- [2] Xue J, Sanchez-Yamagishi J, Bulmash D, Jacquod P, Deshpande A, Watanabe K, Taniguchi T, Jarillo-Herrero P and Leroy BJ 2011 Nat. Mater. 10 282.
- [3] Yankowitz M, Xue J, Cormode D, Sanchez-Yamagishi JD, Watanabe K, Taniguchi T, Harillo-Herrero P, Jacquod P and LeRoy BJ 2012 Nat. Phys. 8 382.
- [4] Decker R, Wang Y, Brar VW, Regan W, Tsai H-Z, Wu Q, Gannett W, Zettl A and Crommie MF 2011 Nano Letters 11 2291.
- [5] Ponomarenko LA et al. 2013 Nature 497 594.
- [6] Hunt B, et al. 2013 Science 340 1427.
- [7] Wallbank JR, Patel AA, Mucha-Kruczyński M, Geim AK and Fal’ko VI 2013 Phys. Rev. B 87 245408.
- [8] Kindermann M, Uchoa B and Miller DL 2012 Phys. Rev. B 86 115415.
- [9] Ortix C, Yang L and van den Brink J 2012 Phys. Rev. B 86 081405.
- [10] Moon P and Koshino M 2013 Phys. Rev. B 87 205404.
- [11] Moon P and Koshino M 2013 Optical probing of the Hofstadter butterfly Preprint arXiv:1308.0713.