Direct observation of dynamic charge stripes in La2-xSrxNiO4
The insulator-to-metal transition continues to be a challenging subject, especially when electronic correlations are strong. In layered compounds, such as La2-xSrxNiO4 and La2-xBaxCuO4, the doped charge carriers can segregate into periodically-spaced charge stripes separating narrow domains of antiferromagnetic order. Although there have been theoretical proposals of dynamically fluctuating stripes, direct spectroscopic evidence of charge-stripe fluctuations has been lacking. Here we report the detection of critical lattice fluctuations, driven by charge-stripe correlations, in La2-xSrxNiO4 using inelastic neutron scattering. This scattering is detected at large momentum transfers where the magnetic form factor suppresses the spin fluctuation signal. The lattice fluctuations associated with the dynamic charge stripes are narrow in q and broad in energy. They are strongest near the charge stripe melting temperature. Our results open the way towards the quantitative theory of dynamic stripes and for directly detecting dynamical charge stripes in other strongly-correlated systems, including high-temperature superconductors such as La2-xSrxCuO4.
In a phase with a spontaneously broken symmetry, it is possible to have well-defined collective modes associated with the new order at temperatures far below the ordering temperature . For example, a system that develops magnetic order will typically exhibit transverse spin-wave excitations. Above , it is often possible to detect order-parameter fluctuations; if the interactions that drive the order are relatively isotropic, then the temperature range where these fluctuations are strong will be narrow. In the case of lower-dimensional systems, however, it is possible to have a regime of order-parameter fluctuations that extend over a wide range of temperatures. Examples include the layered, quasi-two-dimensional antiferromagnets K2NiF4 and La2CuO4, which exhibit dynamic antiferromagnetic spin correlations (with a temperature-dependent correlation length) to temperatures several times .birg71 ; birg90 ; kast98
On doping layered transition-metal-oxide antiferromagnets with holes, it is possible for a stripe phase to develop, with the holes segregating to charge stripes that form antiphase domain walls between antiferromagnetic strips.zaan01 ; kive03 ; vojt09 ; tran12c While the original proposals for the stripe phase focused on the ordered state,zaan89 ; mach89 ; kato90 it has been proposed that fluctuating order of this type (“dynamic charge stripes”) plays a key role in the physics of various interesting, strongly-correlated electronic materials.zaan01 ; cast95 ; kive98 ; frad10 Here we report direct measurement of dynamic charge stripes by inelastic neutron scattering.
Results
We have chosen to study the model system La2-xSrxNiO4 (LSNO), which is isostructural with the family of cuprates in which high-temperature superconductivity was first discovered.bedn86 In particular, we focus on the dopant concentrations and .lee97 ; du00 ; wu02 The stripes develop within two-dimensional (2D) NiO2 layers in which Ni atoms form a square lattice, with O atoms bridging the nearest neighbors. The stripes form along the diagonal direction with respect to the Ni-O bonds. While the average structure of both compositions is tetragonal, it is convenient to choose a unit cell containing two Ni atoms per layer, with in-plane lattice parameter Å. The 3D spin-order wave vector is then , while for charge order the wave vector is , in terms of reciprocal lattice units . (The presence of stripe order should, through striction, cause the lattice parameters parallel and perpendicular to the stripes to become inequivalent. This has not yet been detected in stripe-ordered LSNO, where the correlation length remains finite; however, stripes choose a unique orientation in orthorhombic Sr0.33NiO4 with Pr, Nd.huck06 ) The charge stripe period in real space equals . Experimentyosh00 has shown that .
Neutrons do not couple directly to charge. The intensity at a charge-order superlattice peak is due to atomic displacements that help to screen the charge modulation. In terms of the dynamical structure factor, , the static charge stripe order corresponds to an elastic peak, centered at , where G is a fundamental reciprocal lattice vector and the peak width is the inverse of the correlation length. In contrast, the inelastic portion of for Q close to is not strongly peaked at ; its Q-space structure reflects the periodicity and correlation length, and its frequency dependence reflects the persistence time of the fluctuating order.
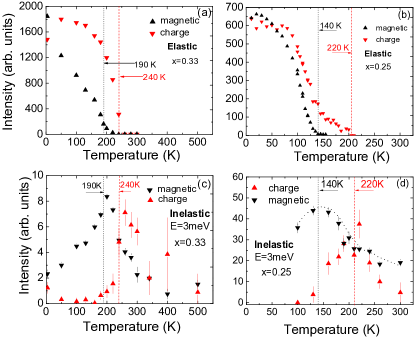
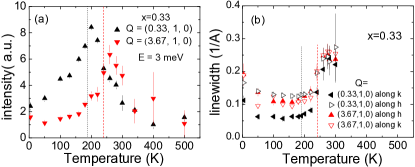
To distinguish the dynamic lattice response associated with charge stripe fluctuations from the spin fluctuations known to be present,tran97c ; lee02 ; bour03 we rely on distinct signatures of the two types of scattering as a function of both and ; we will explain these distinctions in the following. The charge and spin order parameters have distinct temperature dependences: Magnetic and charge Bragg peaks disappear at different temperatures, Tso and Tco respectively, as shown in Fig. 1a,b. The charge and spin stripe fluctuations also have distinct temperature dependences, as summarized in Fig. 1c,d. For fluctuations at an excitation energy of 3 meV, the charge and spin responses each peak near the temperature where the associated order disappears, and . The charge fluctuations, in particular, are detected over a wide range of temperature above .
Neutron scattering study on an optimally-doped sample. We began our investigation with the sample, the optimally-doped composition corresponding to the highest magnetic and charge-ordering temperatures in the La2-xSrxNiO4 family.yosh00 For , the spin and charge modulations are characterized by the same size unit cell, as indicated in the inset of Fig. 2a; it follows that diffraction measurements of these modulations are characterized by the same wave vector, . The modulation wave vector for a 2D layer is then . Because of the tetragonal symmetry of the average lattice, it is equally probable to have stripe domains rotated by and characterized by . For simplicity, we will use to represent the wave vectors for both stripe domains.
Because of the coincidence of the charge and spin wave vectors in this case ( when ), special care has to be taken to properly separate the scattering associated with charge fluctuations from the magnetic response. The magnetic scattering intensity is proportional to the square of the magnetic form factor, which decreases with and has fallen to 25% of its maximum by .wang92 In contrast, inelastic scattering from lattice deformations increases with (in fact, as if the structure factor is ignored). So one way to isolate dynamic charge stripes from spin stripes is by measuring the former at large momentum transfers.
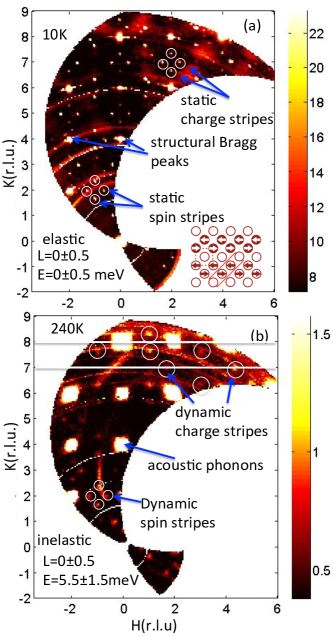
Figure 2a shows an intensity map for elastic neutron scattering measured at 10 K, which is well below the charge-ordering temperature,lee97 K. It is plotted in the plane of reciprocal space, with integrated from to 0.5 and integrated from to 0.5 meV. The energy interval is smaller than the experimental resolution, so this cut probes only elastic () diffraction intensity. In terms of the space group, the crystal structure of La2-xSrxNiO4 allows fundamental Bragg peaks with indices , , all even or all odd. Strong fundamental Bragg peaks, associated with the average atomic structure, appear at , with , integers. Spin-order peaks appear at . Charge-order peaks of the type will appear in the planes, but not at ; however, there are also fundamental Bragg peaks at , so that charge order peaks at appear in the plane, overlapping spin-order peaks. To summarize, peaks at , or equivalently should be spin only (if the peak widths along are narrowlee97 ), while all other superlattice peaks in the plane have mixed spin and charge contributions.
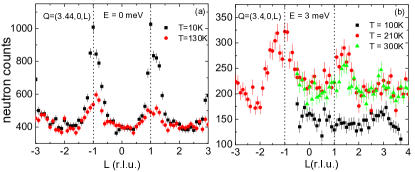
As discussed above, scattering from dynamic stripes should appear in the inelastic channel. At 10 K, the low-energy inelastic scattering near the superlattice wave vectors falls off with increasing in a manner consistent with the magnetic form factor, and it is independent of . These observations indicate fluctuations from the spin stripes,lee02 ; woo05 with no dynamic spin correlations between the NiO2 layers. Charge-stripe fluctuations become apparent in the inelastic data ( meV) shown in Fig. 2b, measured at , where the elastic charge-stripe peaks disappear. Here, the strongest scattering comes from acoustic phonons centered on wave vectors . One can also see weak scattering about some of the superlattice positions . The excitations seen at smaller values are due to spin fluctuations; note that the spin-only scattering at is negligible due to the magnetic form factor.
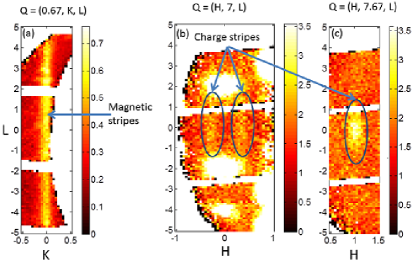
As a further test, representative examples of the -dependence of scattering from small- and large- positions are shown in Fig. 3. The small- example, Fig. 3a, shows no structure in , consistent with the response from 2D spin fluctuations. In contrast, the large- examples exhibit a broad peak about . This is consistent with lattice distortions induced by charge modulation, as the structure factor involves atoms both within the NiO2 planes and outside of them, such as the apical O atoms. (We will give further examples below for the case of .) Thus, we conclude that the peaks at very large , with resurgent intensity that is modulated in , are associated with charge-stripe fluctuations.
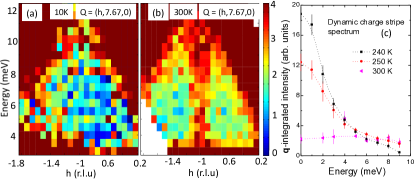
Having determined the character of the high excitations, we next consider their energy dependence. Figure 4a and b compare measurements about at temperatures of 10 K and 300 K, respectively. At this large Q the magnetic form factor is negligibly small and all the signal originated from the atomic lattice fluctuations induced by dynamic charge stripes. Here the data are plotted as a function of and . At 300 K, well above one can see excitations rising almost vertically at , while the same excitations are undetectable above the background at 10 K. The temperature-dependence of excitations for K is shown in Fig. 4c, where the intensity as a function of has been integrated over Q about , and the background has been subtracted. While the low-energy excitations become strongly enhanced on cooling towards , developing a quasi-elastic distribution, the excitations at 300 K clearly indicate a dynamical charge-stripe phase.
To obtain a better measure of the temperature dependence of the excitations, a second set of measurements was done on a different instrument using a lower incident energy. This provided better energy resolution, but also limited the range that could be reached. As a consequence, it is necessary to correct these data for coexisting spin- and charge-stripe contributions, as we will explain.
The measurements were performed at one superlattice position dominated by spin scattering, , and a second dominated by charge-stripe scattering, . The temperature dependence of the elastic scattering at these positions is shown in Fig. 1a (labeled “magnetic” and “charge”, respectively). One can see that the signal disappears on warming through the spin-ordering temperature, K, whereas the peak drops off at , consistent with previous studies.lee97 ; rami96
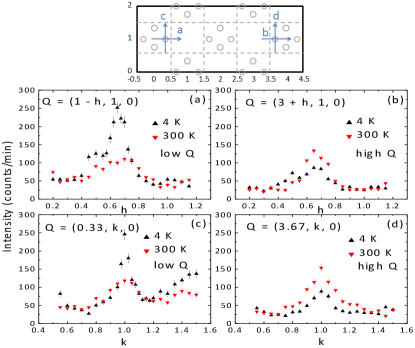
The inelastic scattering at these positions was measured along orthogonal cuts in reciprocal space, as indicated in the top inset of Fig. 5. Panels a and c show the scans at meV obtained at K and 300 K along the orthogonal directions through . The signal here should be dominated by spin fluctuations, and the decrease in peak intensity at 300 K compared to 4 K is consistent with that expectation. (Note that the peaks observed when the scans cross the dashed lines of the inset correspond to one-dimensional spin correlations within the charge stripes; see Boothroyd et al.boot03b ) Panels b and d show scans through . The scattering near should be dominated by charge-stripe correlations. Indeed, we see a very different behavior from : the inelastic intensity increases at 300 K compared to 4 K.
The full temperature dependence of the integrated intensities at meV is presented in Fig. 6a. The fitted peak widths are plotted in Fig. 6b; above 300 K, where the peaks have become broad and the peak intensity becomes comparable to background, the widths were fixed (and hence are not shown) in order to obtain a reasonable integrated intensity. Focusing on the intensities in Fig. 6a, we see that the inelastic intensity at peaks just above , while the signal at peaks near .
To be more quantitative, we need to correct for mixed contributions. Let and represent the magnetic and charge contributions respectively; then, we can write
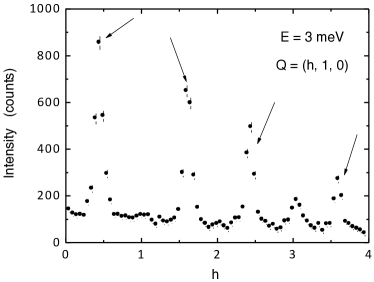
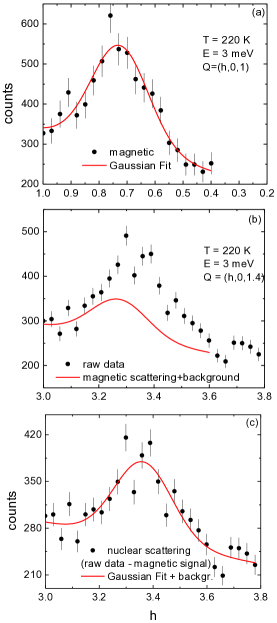
where accounts for the change in the magnetic form factor (as well as differences in geometrical factors associated with the scattering cross section for spin fluctuations). To get an estimate of , we make use of inelastic scattering data obtained on a crystal of LSNO with , for which the magnetic scattering is well separated in Q from the charge-stripe scattering. Figure 7 shows a scan at meV along . From the peak intensities at and 3.45, which are close to our and , we obtain . The parameter accounts for the difference in scattering strength for the atomic displacements. We set , which roughly corresponds to ; the precise value has little impact on our results as long as . Inverting the pair of equations yields the results for and plotted in Fig. 1c.
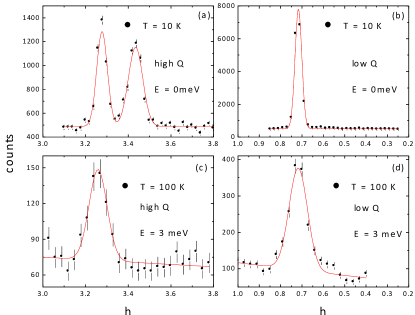
Neutron scattering study of an underdoped sample. To confirm our identification of charge-stripe fluctuations, we have done related measurements on an underdoped crystal of LSNO with . In this case, the representative wave vectors studied are and . From the elastic scans at 10 K shown in Fig. 8b and a, respectively, we see that and that the charge-stripe peak at has a magnetic neighbor at . The temperature dependences of the and peak intensities are plotted in Fig. 1b as “magnetic” and “charge”, respectively. We see that K and K. Inelastic scans at meV for K, shown in Fig. 8d and c, indicate that below only magnetic fluctuations are readily apparent.
The -dependence of the charge-stripe scattering measured around is presented in Fig. 9. Panel a shows the elastic scattering at two temperatures below ; the fact that the scattering peaks at and is controlled by the correlations between stripes in neighboring layers,tran96a while the intensity is also influenced by the structure factor. The inelastic scans at meV in Fig. 9b show that there is -dependent structure in the inelastic scattering at temperatures near and above . The modulated part of the signal we attribute to the structure factor associated with the fluctuating charge stripes.
Because of broad widths and shifts in with temperature,ishi04 it is still necessary to correct for magnetic scattering in order to establish the magnitude of the charge-stripe fluctuations. The analysis process is illustrated in Fig. 10. Again, we are analyzing the response at meV. We take the magnetic scattering centered near to be purely magnetic, and parametrize it as a Gaussian peak plus linear background. We scale this contribution by , obtained from the inelastic scans at 100 K shown in Fig. 8c and d; the scaled result, plus background, is indicated by the solid curve in Fig. 10b. Subtracting the scaled magnetic contribution yields the nuclear fluctuation scattering in Fig. 10c, from which we can determine the intensity of the charge-stripe fluctuations by fitting a Gaussian peak plus a linear background. The temperature dependent data extracted in this way are plotted in Fig. 1d.
Discussion
Optical conductivity measurementskats96 ; home03 ; poir05 ; cosl13 of the stripe-ordered phase in La2-xSrxNiO4+y reveal a broad peak centered at 0.6–0.8 eV, with a gap (measured at the peak half-height) about half that size, consistent with localization of the charge. While nickelates develop a finite conductivity (qualifying them as bad metals) on warming through , a pseudogap remains, which only gradually decreases on heating to .kats96 ; home03 ; cosl13 ; lloy08 The pseudogap indicates a partial localization of charge at . Indirect evidence for residual charge-stripe correlations was provided by a recent neutron powder diffraction study that found excess disorder of in-plane Ni and O sites whose temperature dependence was well correlated with the pseudogap.abey13 Our results provide direct evidence that dynamic charge stripes survive above , and thus appear to resolve the nature of the pseudogap. They also provide an explanation for the fact that spin fluctuations observed above remain incommensuratetran97c ; lee02 ; woo05 : the charge and spin stripes can maintain an instantaneous correlation even when static order is absent. Similar conclusions regarding the coupling of spin and charge stripes and their survival as dynamic entities have been inferred from recent time-resolved pump-probe studies, involving an optical pump and a probe by resonant x-ray diffraction.lee12 ; kung13 ; chua13
In a terahertz spectroscopy study of La1.67Sr0.33NiO4,lloy08 the temperature-dependent change in the conductivity at meV was interpreted as evidence of impurity-pinned charge collective modes, by analogy with behavior in quasi-one-dimensional (quasi-1D) charge-density-wave (CDW) systems.grun88 While such a picture would seem to be consistent with our observation of fluctuating charge stripes for , we note that there are significant differences between charge stripes in a doped Mott insulator and CDW order in a quasi-1D metal. In the former case, sliding of the charge stripes is prevented by the presence of the intervening spin stripes. The fact that the magnetically-ordered Ni sites have , rather than in cuprates, helps to localize the charge stripes.zaan94 ; tran98c When the charge stripes start to move, the spin fluctuations become strongly damped.lee02 ; bour03 ; woo05 In fact, the THz resultslloy08 show that the low frequency conductivity begins a rapid growth near the spin-disordering temperature, , consistent with the rise in charge-stripe fluctuations found in our Fig. 1(c).
The fact that the intensity of the fluctuations is strong for is consistent with the fluctuations representing a soft collective mode that turns into the charge-stripe order below . It appears to be an example of an electronic nematic phase,kive98 which is correlated with a pseudogap. The situation is rather different from a conventional Peierls transition in a quasi-one-dimensional metal.renk74
These low-energy excitations have the character of critical fluctuations, but with a broad critical regime on the disordered side of the transition. We do not know of any calculations that properly describe the charge-stripe fluctuations that we observe. Using a model appropriate for cuprates, Kaneshita et al.kane02 calculated charge collective modes that disperse steeply from the charge-order wave vector and leave detectable anomalies when they cross (and mix with) phonon branches, however there was no prediction of a low-energy lattice response independent of the phonon modes. Presumably, one must account for the strong electron-lattice coupling in nickelates.zaan94 The possible connection between the low-energy stripe fluctuations and the anomaly in a bond-stretching phonon branchtran02 and other possible phonon anomalies requires further exploration.
Our results suggest that it may be possible to detect charge-stripe fluctuations in superconducting cuprates; however, this will be challenging because the smaller atomic displacements in the ordered statetran96b suggest a weaker signal in the fluctuating state. There have been recent optical pump-probe experiments on cuprates that have detected oscillations interpreted as evidence for collective excitations of charge-density wavestorc13 ; hint13 ; however, those measurements provide no information on the spatial periodicity of such modes. Inelastic neutron scattering has the potential to characterize both the spatial modulation and the dynamics of disordered charge stripes.
Finally, our observations have some relevance to the current discussion concerning CDW correlationswu11 ; ghir12 ; chan12a in underdoped YBa2Cu3O6+x. Evidence for CDW order was initially detected by nuclear magnetic resonance (NMR) below the superconducting transition temperature, , and at high magnetic field. X-ray scattering measurementsghir12 ; chan12a discovered broad CDW reflections in zero field, setting in at . Under the assumption that all of the measurements are probing the same CDW correlations, it has been proposed that the x-ray measurements might be integrating over fluctuating CDW correlations, which would not be detectable by NMR.ghir12 ; chan12a There are problems with such an interpretation, however. A recent studytham13 has shown that the integrated intensity of a CDW peak in YBa2Cu3O6.6 is quite similar to one in charge-stripe-ordered La1.875Ba0.125CuO4. Could integrated fluctuations really provide as much intensity as static order? In the case of La1.67Sr0.33NiO4, our results directly demonstrate that charge-stripe fluctuations exist far above , whereas elastic x-ray scattering measurementsdu00 lost the signal by K. This strongly suggests that the x-ray studies of YBa2Cu3O6+x are measuring static correlations. (Note that recent inelastic x-ray scattering measurementsleta14 have narrowed the possible energy range of fluctuations to something less than 1 meV.) As suggested in a recent theory paper,nie14 the short-range character of the CDW correlations seen with x-raysghir12 ; chan12a is likely a consequence of disorder. NMR may have detected a transition to a distinct state, with longer-range order or a more commensurate wave vector.
Methods
Samples. Single crystals of La2-xSrxNiO4 (, and also 0.25 and 0.45) were grown by the floating-zone method. 4 cm-long samples were cut from rods of 6 mm diameter.
Neutron scattering experiments. Preliminary measurements as well as magnetic form factor measurement (Fig. 7) were carried out on the 1T spectrometer at the ORHPEE reactor at the Laboratoire Leon Brillouin at Saclay, France, using a fixed final energy of 14.8 meV. Inelastic neutron scattering experiments were carried out on the time-of-flight (TOF) Wide Angular-Range Chopper Spectrometer (ARCS) at the Spallation Neutron Source (SNS) at the Oak Ridge National Laboratory (ORNL) with the samples mounted with the -axis vertical. Incident energies were 65meV with the chopper speed of 360Hz (data in figs. 2,3) and 60 meV with the chopper speed of 460Hz (data in Fig. 4). In order to map a region in the 4-dimensional reciprocal space, data were taken in the rotating sample mode. Measurements of the temperature dependence of low energy excitations (Fig. 1,5,6,8,9,10) were carried out using the HB-3 triple-axis spectrometer at the High Flux Isotope Reactor (HFIR), ORNL.
References
- (1) Birgeneau, R. J., Skalyo, J. & Shirane, G. Critical Magnetic Scattering in K2NiF4. Phys. Rev. B 3, 1736–1749 (1971).
- (2) Birgeneau, R. J. Spin correlations in the two-dimensional S=1 Heisenberg antiferromagnet. Phys. Rev. B 41, 2514–2516 (1990).
- (3) Kastner, M. A., Birgeneau, R. J., Shirane, G. & Endoh, Y. Magnetic, transport, and optical properties of monolayer copper oxides. Rev. Mod. Phys. 70, 897 (1998).
- (4) Zaanen, J., Osman, O. Y., Kruis, H. V., Nussinov, Z. & Tworzydło, J. The geometric order of stripes and luttinger liquids. Phil. Mag. B 81, 1485–1531 (2001).
- (5) Kivelson, S. A. et al. How to detect fluctuating stripes in the high-temperature superconductors. Rev. Mod. Phys. 75, 1201 (2003).
- (6) Vojta, M. Lattice symmetry breaking in cuprate superconductors: Stripes, nematics, and superconductivity. Adv. Phys. 58, 699–820 (2009).
- (7) Tranquada, J., Kivelson, S., ichi Uchida, S., Fink, J. & Tajima, S. Preface to Stripes and Electronic Liquid Crystals in Strongly Correlated Materials. Physica C 481, 1–2 (2012).
- (8) Zaanen, J. & Gunnarsson, O. Charged magnetic domain lines and the magnetism of high- oxides. Phys. Rev. B 40, 7391 (1989).
- (9) Machida, K. Magnetism in La2CuO4 based compounds. Physica C 158, 192 (1989).
- (10) Kato, M., Machida, K., Nakanishi, H. & Fujita, M. Soliton Lattice Modulation of Incommensurate Spin Density Wave in Two Dimensional Hubbard Model: A Mean Field Study. J. Phys. Soc. Jpn. 59, 1047–1058 (1990).
- (11) Castellani, C., Di Castro, C. & Grilli, M. Singular Quasiparticle Scattering in the Proximity of Charge Instabilities. Phys. Rev. Lett. 75, 4650–4653 (1995).
- (12) Kivelson, S. A., Fradkin, E. & Emery, V. J. Electronic liquid-crystal phases of a doped Mott insulator. Nature 393, 550–553 (1998).
- (13) Fradkin, E., Kivelson, S. A., Lawler, M. J., Eisenstein, J. P. & Mackenzie, A. P. Nematic Fermi Fluids in Condensed Matter Physics. Annu. Rev. Condens. Matter Phys. 1, 153–178 (2010).
- (14) Bednorz, J. & Müller, K. Possible high superconductivity in the Ba–La–Cu–O system. Z. Phys. B 64, 189–193 (1986).
- (15) Lee, S.-H. & Cheong, S.-W. Melting of Quasi-Two-Dimensional Charge Stripes in . Phys. Rev. Lett. 79, 2514–2517 (1997).
- (16) Du, C.-H. et al. Critical Fluctuations and Quenched Disordered Two-Dimensional Charge Stripes in La5/3Sr1/3NiO4. Phys. Rev. Lett. 84, 3911–3914 (2000).
- (17) Wu, G., Neumeier, J. J., Ling, C. D. & Argyriou, D. N. Temperature evolution of the crystal structure of and as revealed through neutron powder diffraction. Phys. Rev. B 65, 174113 (2002).
- (18) Hucker, M. et al. Unidirectional diagonal order and three-dimensional stacking of charge stripes in orthorhombic Pr1.67Sr0.33NiO4 and Nd1.67Sr0.33NiO4. Phys. Rev. B 74, 085112 (2006).
- (19) Yoshizawa, H. et al. Stripe order at low temperatures in La2-xSrxNiO4 with . Phys. Rev. B 61, R854–R857 (2000).
- (20) Tranquada, J. M., Wochner, P. & Buttrey, D. J. Spin Dynamics in an Ordered Stripe Phase. Phys. Rev. Lett. 79, 2133–2136 (1997).
- (21) Lee, S.-H. et al. Freezing of a Stripe Liquid. Phys. Rev. Lett. 88, 126401 (2002).
- (22) Bourges, P., Sidis, Y., Braden, M., Nakajima, K. & Tranquada, J. M. High-Energy Spin Dynamics in La1.69Sr0.31NiO4. Phys. Rev. Lett. 90, 147202 (2003).
- (23) Wang, X.-L. et al. Neutron-diffraction study of the antiferromagnetic form factor of La2NiO4. Phys. Rev. B 45, 5645–5653 (1992).
- (24) Woo, H. et al. Mapping spin-wave dispersions in stripe-ordered La2-xSrxNiO4 (, 0.333). Phys. Rev. B 72, 064437 (2005).
- (25) Ramirez, A. P., Gammel, P. L., Cheong, S.-W., Bishop, D. J. & Chandra, P. Charge Modulation in La1.67Sr0.33NiO4: A Bulk Thermodynamic Study. Phys. Rev. Lett. 76, 447–450 (1996).
- (26) Boothroyd, A. T. et al. Spin Correlations among the Charge Carriers in an Ordered Stripe Phase. Phys. Rev. Lett. 91, 257201 (2003).
- (27) Tranquada, J. M., Buttrey, D. J. & Sachan, V. Incommensurate stripe order in La2-xSrxNiO4 with . Phys. Rev. B 54, 12318–12323 (1996).
- (28) Ishizaka, K. et al. Commensurate-Incommensurate Crossover of Charge Stripe in La2-xSrxNiO4 (). Phys. Rev. Lett. 92, 196404 (2004).
- (29) Katsufuji, T. et al. Optical spectroscopy of the charge-ordering transition in . Phys. Rev. B 54, R14230–R14233 (1996).
- (30) Homes, C. C., Tranquada, J. M., Li, Q., Moodenbaugh, A. R. & Buttrey, D. J. Mid-infrared conductivity from mid-gap states associated with charge stripes. Phys. Rev. B 67, 184516 (2003).
- (31) Poirot, N., Phuoc, V. T., Gruener, G. & Gervais, F. Dependence of optical conductivity with in La2NiO4+δ single crystals. Solid State Sciences 7, 1157–1162 (2005).
- (32) Coslovich, G. et al. Ultrafast charge localization in a stripe-phase nickelate. Nat. Commun. 4, 2643 (2013). URL http://dx.doi.org/10.1038/ncomms3643.
- (33) Lloyd-Hughes, J., Prabhakaran, D., Boothroyd, A. T. & Johnston, M. B. Low-energy collective dynamics of charge stripes in the doped nickelate La2-xSrxNiO4+δ observed with optical conductivity measurements. Phys. Rev. B 77, 195114 (2008).
- (34) Abeykoon, A. M. M. et al. Evidence for Short-Range-Ordered Charge Stripes Far above the Charge-Ordering Transition in La1.67Sr0.33NiO4. Phys. Rev. Lett. 111, 096404 (2013).
- (35) Lee, W. S. et al. Phase fluctuations and the absence of topological defects in a photo-excited charge-ordered nickelate. Nat. Commun. 3, 838 (2012). URL http://dx.doi.org/10.1038/ncomms1837.
- (36) Kung, Y. F. et al. Time-dependent charge-order and spin-order recovery in striped systems. Phys. Rev. B 88, 125114 (2013).
- (37) Chuang, Y. D. et al. Real-Time Manifestation of Strongly Coupled Spin and Charge Order Parameters in Stripe-Ordered La1.75Sr0.25NiO4 Nickelate Crystals Using Time-Resolved Resonant X-Ray Diffraction. Phys. Rev. Lett. 110, 127404 (2013).
- (38) Grüner, G. The dynamics of charge-density waves. Rev. Mod. Phys. 60, 1129–1181 (1988).
- (39) Zaanen, J. & Littlewood, P. B. Freezing electronic correlations by polaronic instabilities in doped . Phys. Rev. B 50, 7222–7225 (1994).
- (40) Tranquada, J. M. Charge stripes and antiferromagnetism in insulating nickelates and superconducting cuprates. J. Phys. Chem. Solids 59, 2150–2154 (1998).
- (41) Renker, B. et al. Neutron-Scattering Study of the Structural Phase Transition in the One-Dimensional Conductor K2Pt(CN)4BrD2O. Phys. Rev. Lett. 32, 836–839 (1974).
- (42) Kaneshita, E., Ichioka, M. & Machida, K. Phonon Anomalies due to Collective Stripe Modes in High Cuprates. Phys. Rev. Lett. 88, 115501 (2002).
- (43) Tranquada, J. M., Nakajima, K., Braden, M., Pintschovius, L. & McQueeney, R. J. Bond-Stretching-Phonon Anomalies in Stripe-Ordered . Phys. Rev. Lett. 88, 075505 (2002).
- (44) Tranquada, J. M. et al. Neutron-scattering study of stripe-phase order of holes and spins in La1.48Nd0.4Sr0.12CuO4. Phys. Rev. B 54, 7489–7499 (1996).
- (45) Torchinsky, D. H., Mahmood, F., Bollinger, A. T., Bozovic, I. & Gedik, N. Fluctuating charge-density waves in a cuprate superconductor. Nat. Mater. 12, 387–391 (2013).
- (46) Hinton, J. P. et al. New collective mode in YBa2Cu3O6+x observed by time-domain reflectometry. Phys. Rev. B 88, 060508 (2013).
- (47) Wu, T. et al. Magnetic-field-induced charge-stripe order in the high-temperature superconductor YBa2Cu3Oy. Nature 477, 191–194 (2011).
- (48) Ghiringhelli, G. et al. Long-Range Incommensurate Charge Fluctuations in (Y,Nd)Ba2Cu3O6+x. Science 337, 821–825 (2012).
- (49) Chang, J. et al. Direct observation of competition between superconductivity and charge density wave order in YBa2Cu3O6.67. Nat. Phys. 8, 871–876 (2012).
- (50) Thampy, V. et al. Comparison of charge modulations in La1.875Ba0.125CuO4 and YBa2Cu3O6.6. Phys. Rev. B 88, 024505 (2013).
- (51) Le Tacon, M. et al. Inelastic X-ray scattering in YBa2Cu3O6.6 reveals giant phonon anomalies and elastic central peak due to charge-density-wave formation. Nat. Phys. 10, 52–58 (2014).
- (52) Nie, L., Tarjus, G. & Kivelson, S. A. Quenched disorder and vestigial nematicity in the pseudo-gap regime of the cuprates. arXiv:1311.5580 (2013).
Acknowledgments We are grateful for helpful comments from J. Zaanen. S.A., D.P., and D.R. (G.D.G. and J.M.T.) were supported by the Office of Basic Energy Sciences, Division of Materials Sciences and Engineering, U.S. Department of Energy (DOE), through Contract No. DE-SC0006939 (DE-AC02-98CH10886). The experiments at Oak Ridge National Laboratory’s High Flux Isotope Reactor and Spallation Neutron Source were sponsored by the Division of Scientific User Facilities, US DOE Office of Basic Energy Sciences.
Competing Interests The authors declare that they have no competing financial interests.
Author contributions Sample preparation: G.D.G.; neutron scattering: S.A., D.P., K.M., M.D.L., S.C., J.F.B., D.L.A., D.L., J.M.T., D.R.; paper writing: S.A., J.M.T., D.R.
Additional information Correspondence and requests for materials should be addressed to D.R. (email: dmitry.reznik@colorado.edu).