Finding role communities in directed networks using Role-Based Similarity, Markov Stability and the Relaxed Minimum Spanning Tree
Abstract
We present a framework to cluster nodes in directed networks according to their roles by combining Role-Based Similarity (RBS) and Markov Stability, two techniques based on flows. First we compute the RBS matrix, which contains the pairwise similarities between nodes according to the scaled number of in- and out-directed paths of different lengths. The weighted RBS similarity matrix is then transformed into an undirected similarity network using the Relaxed Minimum-Spanning Tree (RMST) algorithm, which uses the geometric structure of the RBS matrix to unblur the network, such that edges between nodes with high, direct RBS are preserved. Finally, we partition the RMST similarity network into role-communities of nodes at all scales using Markov Stability to find a robust set of roles in the network. We showcase our framework through a biological and a man-made network.
I Introduction
Among the many systems that can be formalised as networks, there are important examples where the directionality of the network is crucial, e.g., the web, ecological systems, information and transport networks. However, directionality brings in subtle mathematical complexities and is often neglected in many approaches for network analysis. Such directed networks naturally lend themselves to be analysed from the perspective of flows. An important aspect of directed networks is the notion of roles, e.g., leader vs follower or hub vs authority. Here we show that a nuanced classification of nodes in terms of their role in the network may be obtained from the analysis of directed flows. In other words, we seek to find nodes that are similarly positioned in the network–with respect to flows–and obtain broad categories into which they can be classified. In this paper, we present a method to find role clusters in directed networks based on the analysis of flow patterns, and show examples of its application to a selection of networks. Section II contains a brief introduction and references to the specific techniques we use and an overview of the method. Section III provides examples of our method.
II Methodology
Let be an unweighted and directed network with node set , , edge set , and adjacency matrix where denotes the existence of a directed edge from node to . Each node has in-degree (the number of nodes that link to it) and out-degree (the number of nodes to which it links). The vectors of in- and out-degrees are denoted by and .
We find the role-communities of following three steps:
-
1.
From the adjacency matrix , construct a node similarity matrix based on the directed connectivity profile of the nodes, as given by RBS (Sec. II-A).
-
2.
From this RBS matrix, obtain a (new) undirected similarity network using the RMST algorithm such that two nodes are connected if their connectivity profiles are highly similar (Sec. II-B).
-
3.
Find robust partitions of this RMST similarity network into communities of nodes with the same roles at several levels of resolution using Markov Stability, a multiscale community detection method (Sec. II-C).
II-A Role-Based Similarity in directed networks
In a directed network the in- and out-connectivities of the nodes contain information about the role of each node in the network. The simplest categorisation of nodes into “leaders” and “followers”, according to the predominance of their in- or out-degree, is often illustrative but limited as it neglects the full topology and complexity of the network. Other methods that harness further information from the network structure can be used to compute the “status” index [1], PageRank [2], or the “Hub”/“Authority” score [3]. Though powerful, these methods are limited by the fact that they split the nodes into at most two categories (or further categories according to a one-dimensional classification).
To go beyond the ‘leader-follower’ dichotomy, we employ Role-Based Similarity (RBS) [4, 5], a method that calculates how similar nodes are to each other in terms of the scaled number of adjacent directed paths of all meaningful lengths (i.e., no longer than ). The idea is to create a feature vector for each node, , whose entries are the weighted number of paths of lengths from 1 to originating and ending in node . All the feature vectors are stored as the rows of the matrix:
| (1) |
where . Note that the number of originating paths of length from all nodes is given by , and the number of arriving paths , where is the vector of ones. Here, we use , where is the largest eigenvalue of and , which assures convergence of the sequence as . Hence the columns of contain the number of in- (or out-) paths of length for each node weighted by .
In addition to guaranteeing convergence, the parameter also determines the weight given to each path length: smaller values of give more weight to shorter paths than to longer ones. If , the columns of converge rapidly (because ), which results in feature vectors based only on local properties based on short paths (i.e., in the limit , the feature vector only contains and ). As is increased, we incorporate more global features of the network in our analysis. Results in [4] indicate that provides a good balance between the information gathered from the local and global flow structure in the network. However, the systematic determination of for each network is currently the focus of further investigation.
From we then compute the RBS matrix , whose entries contain the cosine-similarity between all rows of :
| (2) |
When nodes and have an identical pattern of path flows at all lengths in , then and are collinear and . On the contrary, when nodes and do not have any number of paths in common at any length (e.g., when is a source and a sink node) then . The RBS matrix is symmetric, usually full, and could be used to find groups of nodes with similar connectivity. However, as is usually the case with correlation or distance matrices, clustering directly is problematic because of its lack of sparsity and the unstructured nature of geometric distances in high-dimensional spaces. To unblur the structure of , we extract a similarity network that select links between nodes with strong similarity while discarding weak similarities that can be explained in terms of other relationships in the network, as we explain now.
II-B Obtaining the similarity network from the RBS matrix
The feature vectors containing the flow profiles of the nodes are defined in a high-dimensional space of dimensions. However, because the coordinates of the vectors are smoothly related to each other, we expect that the vectors of all nodes will lie in a lower dimensional manifold whose structrure can be well captured by a graph with a geometric structure. Here we use the Relaxed Minimum-Spanning Tree (RMST) algorithm, a method that incorporates local and global features of the data to recover such a network from the RBS matrix.
First, we define the ‘dissimilarity’ (or ‘distance’) matrix , with , i.e., the more similar and are to each other, the smaller the value of and the closer and lie. The RMST algorithm constructs a network with adjacency matrix from as follows. First, consider to be the adjacency matrix of a weigthed graph and obtain a Minimum Spanning Tree (MST) in it, setting if nodes and are neighbours in the tree. Each node pair is connected by a path (or sequence of edges) in the MST. We then find the maximal weight in along the MST path:
If is significantly smaller than then the MST-path is considered to be a good model to explain the similarity between nodes and and discard the direct link between them, i.e., we leave . If is comparable to then there is not sufficient evidence to believe that the MST-path is a better model and we include the direct link More precisely, we set when
| (3) |
where and is a parameter ( here). The term approximates the local distribution of points (in ) around and is motivated by the Perturbed Minimum Spanning Tree algorithm [6].
The RMST similarity network is an unweighted, undirected graph where two nodes are connected only if their flow feature vectors are highly similar, regardless of whether they are neighbours in the original graph or not. We can also obtain a weighted similarity graph by Hadamard-multiplying and . The RMST network is sparse if the data in results from a local geometric structure (which the RMST tries to recover), and is more amenable to analysis using network analysis techniques such as the community detection method we describe below.
II-C Role-communities with Markov Stability
Community detection in networks has been studied extensively and there exist a wide variety of methods, each with their own advantages [8]. Here, we use the method known as Markov Stability [9, 10] to detect ‘role-communities’ in the RMST similarity network. There are a number of advantages to using Markov Stability in this case, key among them is the ability to detect communities in the network at all scales via a continous-time Markov process evolving in time. Due to this dynamic zooming, Markov Stability does not impose an a priori number of roles (i.e., role-communities) in the network, but rather detects the presence of robust partitions at all levels of resolution. Hence we learn the number of roles by exploring the network with a continuous-time diffusion process and finding robust, optimised partitions across scales.
Consider , the adjacency matrix of the undirected RMST similarity network, which by construction is connected. Define , the vector of degrees, and so that is a row-stochastic matrix. The normalised Laplacian of the system is then , and the transition matrix of the continuous-time Markov process of duration (the Markov time) is (giving the probability of transitioning form node to in a process of duration ) [11]. A hard partition of the network into groups of nodes can be encoded in a matrix (i.e., is node belongs to community , and ). The Markov Stability of the partition at time is defined as the trace of the clustered autocovariance of the diffusion process [9]:
| (4) |
where is the steady-state distribution of the process, and . We find the communities in the similarity network for a given by maximising over the space of partitions; that is, we find the network partitions that maximise the retention of flows over a timescale.
Maximising equation (4) is an NP-hard problem, with no guarantees of global optimality. The optimised partitions are found using the Louvain algorithm [12], a greedy heuristic that has been shown to give good results in practice. To find the relevant partitions of the network at any time scale, we use a robustness criterion based on the consistency of the optimisation quantified through an information-theoretical measure. At each Markov time, we obtain optimised partitions of the network by running the Louvain method 100 times, each time using a random initial guess. To gauge the robustness of the set of optimised partitions, we calculate the mean pairwise Variation of Information (VI) of the ensemble of Louvain solutions [10]. The VI between two partitions and is [13]:
with . When the optimisation algorithm finds partitions of the network that are consistently similar (a hallmark of robust community structure), the mean pairwise VI is low; when there is no clear community structure the optimisation produces partitions that are different to each other, resulting in a high mean VI. Finally, to make sure we detect all the relevant role-communities, we optimise equation (4) for all Markov times, keeping track of the mean VI as a function of , and detecting communities that are also persistent across Markov times. We now provide examples of finding node roles in different networks using the RBS/RMST/Markov Stability methodology explained in this section.
III Examples
III-A C. elegans neural network
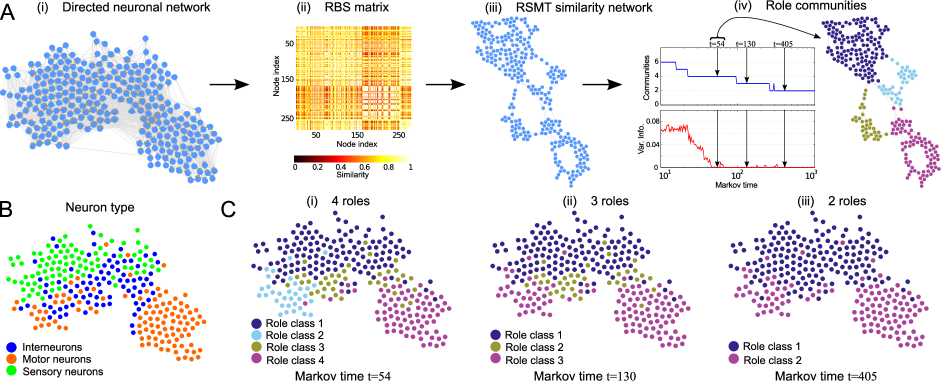
The directed neural network of C. elegans records the chemical synapses and the junctions between 279 neurons [7]. Figure 1A shows the steps of the analysis: the original unweighted directed neuronal network; computation of the RBS matrix with and ; generate the RMST similarity network; and find role-communities in it using Markov Stability. As shown in Fig. 1A-(iv), our analysis finds meaningful partitions of the RMST network into up to four role-classes.
C. elegans is known to have three types of neurons: sensory, motor, and interneurons [7], shown in Figure 1B with different colours. We display the neural network on the plane as in Ref. [7]: the horizontal axis corresponds to the entries of the Fiedler vector reflecting mostly body position, and the vertical axis corresponds to processing depth with respect to information flow. Fig. 1C shows that the partition into four, three and two roles broadly reflects the biological groups. Among the four roles, we find one group (Role 1, dark blue) which corresponds mostly to sensory neurons and some interneurons. Role 3 is formed by a subset of the interneurons. Interestingly, motor neurons are split in two classes (Roles 2 and 4) clearly separated along the body of the worm (x-axis). The motor neurons in Roles 2 and 4 are merged into a common role when we cluster the RMST network into 3 role-communities. Finally, the partition into two roles separates the groups along the lines of sensory and motor neurons—interneurons are split in both, with slightly more interneurons in the sensory group.
III-B US airport network
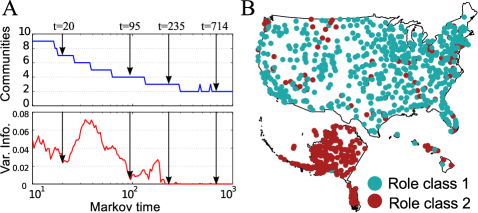
We also investigated the roles in the unweighted network of airports in the United States [14, 15]. The analysis proceeds as before and we calculate the RBS matrix with and . Figure 2A shows the number of roles found at different levels of resolution. We find partitions into seven or fewer role classes—the VI has pronounced dips at , , , and , corresponding to 7, 4, 3 and 2 role-communities. Interestingly, there is always a distinctive role for a large group of Alaskan airports across all levels of resolution which persists separately up to the highest level of resolution. As shown in Fig. 2B, where we show the US map with nodes coloured according to the two role classes at , the most striking attribute is that practically all airports in Alaska (including the two largest, Anchorage and Fairbanks) belong to role class 2. Transport in Alaska, a large and sparsely populated region with many remote settlements scantily connected by roads, relies on local airports and airstrips. These ingredients contribute to create a distinct (and less reciprocal) air-transportation connectivity, which sets Alaska apart from most of the rest of the US. The few nodes in the mainland and Hawaii that belong to role class 2 are mostly small airfields and industrial airports, which are embedded in local air route patterns.
IV Conclusion
We show how directed flow patterns at all scales in directed networks can be harnessed using a combination of flow-based and structural approaches to uncover the different types of nodes that exist in a directed network. Both RBS and Markov Stability at their core rely on flows but each from a different stance: the former compares how the similarly nodes are positioned with respect to incoming and outgoing flows, while the latter establishes where flows tend to be trapped on a given timescale. The RSMT algorithm allows us to project complex datasets with local structure as true networks, facilitating its analysis with graph theoretical tools. Together, these techniques form a powerful framework for the analysis of directed networks which, as the examples here show, is applicable to networks originating from different disciplines.
Acknowledgments
MBD and MB acknowledge support from the UK EPSRC grant EP/I017267/1 under the Mathematics Underpinning the Digital Economy program. MBD acknowledges support from the James S. McDonnell Foundation Postdoctoral Program in Complexity Science/Complex Systems-Fellowship Award (#220020349-CS/PD Fellow). BV is supported through a PhD Award from the British Heart Foundation Centre of Research Excellence at Imperial College London (RE/08/002).
References
- [1] L. Katz, “A new status index derived from sociometric analysis,” Psychometrika, vol. 18, pp. 39–43, 1953.
- [2] L. Page, S. Brin, R. Motwani, and T. Winograd, “The PageRank citation ranking: Bringing order to the web.” Stanford InfoLab, Technical Report 1999-66, November 1999, previous number = SIDL-WP-1999-0120.
- [3] J. M. Kleinberg, “Authoritative sources in a hyperlinked environment,” J. ACM, vol. 46, no. 5, pp. 604–632, Sep. 1999.
- [4] K. Cooper and M. Barahona, “Role-based similarity in directed networks,” arXiv:1012.2726 (2010).
- [5] K. Cooper, “Complex networks: Dynamics and similarity,” Ph.D. dissertation, University of London, 2010.
- [6] M. A. Carreira-Perpiñán and R. S. Zemel, “Proximity graphs for clustering and manifold learning,” in Advances in Neural Information Processing Systems 17, L. K. Saul, Y. Weiss, and L. Bottou, Eds. Cambridge, MA: MIT Press, 2005, pp. 225–232.
- [7] L. R. Varshney, B. L. Chen, E. Paniagua, D. H. Hall, and D. B. Chklovskii, “Structural properties of the caenorhabditis elegans neuronal network.”PLoS Comput Biol, vol. 7, no. 2, p. e1001066, 2011.
- [8] S. Fortunato, “Community detection in graphs,” Physics Reports, vol. 486, no. 3-5, pp. 75 – 174, 2010.
- [9] J.-C. Delvenne, S. Yaliraki, and M. Barahona, “Stability of graph communities across time scales,” P Nat Acad Sci USA, vol. 107, no. 29, pp. 12 755–12 760, 2010, also: arXiv:0812.1811 (2008).
- [10] J.-C. Delvenne, M. T. Schaub, S. N. Yaliraki, and M. Barahona, “The stability of a graph partition: A dynamics-based framework for community detection,” in Dynamics On and Of Complex Networks, Volume 2, A. Mukherjee, M. Choudhury, F. Peruani, N. Ganguly, and B. Mitra, Eds. Springer New York, 2013, pp. 221–242.
- [11] R. Lambiotte, J. Delvenne, and M. Barahona, “Laplacian dynamics and multiscale modular structure in networks,” arXiv:0812.1770 (2008).
- [12] V. D. Blondel, J.-L. Guillaume, R. Lambiotte, and E. Lefebvre, “Fast unfolding of communities in large networks,” J Stat Mech-Theory E, vol. 2008, no. 10, p. P10008, 2008.
- [13] M. Meilă, “Comparing clusterings—an information based distance,” J Multivariate Anal, vol. 98, no. 5, pp. 873 – 895, 2007.
- [14] T. Opsahl. (2011) Why anchorage is not (that) important: Binary ties and sample selection. [Online]. Available: http://wp.me/poFcY-Vw
- [15] J. Kunegis, “KONECT – the Koblenz Network Collection,” 2012. [Online]. Available: http://konect.uni-koblenz.de