A resolved debris disk around the candidate planet-hosting star HD95086
Abstract
Recently, a new planet candidate was discovered on direct images around the young (10-17 Myr) A-type star HD95086. The strong infrared excess of the system indicates that, similarly to HR8799, Pic, and Fomalhaut, the star harbors a circumstellar disk. Aiming to study the structure and gas content of the HD95086 disk, and to investigate its possible interaction with the newly discovered planet, here we present new optical, infrared and millimeter observations. We detected no CO emission, excluding the possibility of an evolved gaseous primordial disk. Simple blackbody modeling of the spectral energy distribution suggests the presence of two spatially separate dust belts at radial distances of 6 and 64 AU. Our resolved images obtained with the Herschel Space Observatory reveal a characteristic disk size of (540490 AU) and disk inclination of 25∘. Assuming the same inclination for the planet candidate’s orbit, its re-projected radial distance from the star is 62 AU, very close to the blackbody radius of the outer cold dust ring. The structure of the planetary system at HD95086 resembles the one around HR8799. Both systems harbor a warm inner dust belt and a broad colder outer disk and giant planet(s) between the two dusty regions. Modelling implies that the candidate planet can dynamically excite the motion of planetesimals even out to 270 AU via their secular perturbation if its orbital eccentricity is larger than about 0.4. Our analysis adds a new example to the three known systems where directly imaged planet(s) and debris disks co-exist.
Subject headings:
circumstellar matter — infrared: stars — stars: individual (HD 95086)1. Introduction
Recently, several new massive exoplanets at large orbital radii were directly imaged, e.g. around HR8799 (Marois et al., 2008), Pic (Lagrange et al., 2009), and Fomalhaut (Kalas et al., 2008). They are the largest products of the planet formation process, which also produces many smaller planetesimals. While these smaller bodies cannot directly be detected, debris dust arising from their erosion can be observed via scattered light and/or thermal emission of the grains. All three mentioned examples harbor luminous debris disks. Giant planet(s) and the planetesimal belt/debris disk can interact with each other in several ways. A giant planet can sculpt the structure of the debris disk (Ertel et al., 2012), while the planetesimal disk can also influence the planet’s orbital evolution and long-term stability (Moore & Quillen, 2013).
Rameau et al. (2013) discovered a new planet candidate around HD95086, at a projected separation of 56 AU. Its estimated mass of 4–5 MJup makes it the lowest mass planet detected by direct imaging. The host star, similarly to HR8799 and Pic, is an A-type star, belongs to a young association (Lower Centaurus Crux, de Zeeuw et al., 1999, hereafter, LCC), and exhibits prominent infrared excess indicative of a dusty circumstellar disk (Rhee et al., 2007; Chen et al., 2012; Rizzuto et al., 2012). The age estimates of the LCC association range between 10 Myr (Song et al., 2012) and 17 Myr (Pecaut et al., 2012). While the disk of HD95086 probably contains secondary dust, considering its young age, it is possible that the disk is an evolved gaseous primordial disk. Here, we study the structure and gas content of the HD95086 disk and investigate its possible interaction with the newly discovered planet. Our analysis adds a new example to the three known systems where directly imaged planet(s) and debris disks co-exist.
2. Observations and data reduction
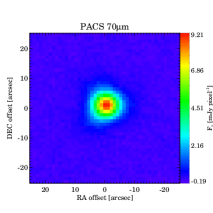
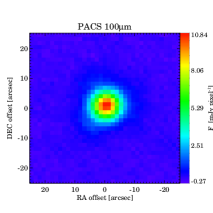
We observed HD95086 with the Herschel Space Observatory (Pilbratt et al., 2010) using the Photodetector Array Camera and Spectrometer (PACS, Poglitsch et al., 2010), and the Spectral and Photometric Imaging Receiver (SPIRE, Griffin et al., 2010). PACS observations were performed on 2011 August 1 in mini scan map mode with medium scan speed (20″ s-1). Measurements at scan angles of 70 and 110 were made both at 70 µm and 100 µm and this setup also provided four observations at 160µm. Each measurement included four repetitive scan maps. Data pocessing was carried out with the Herschel Interactive Processing Environment (HIPE, Ott, 2010), v.9.2, using the pipeline optimized for bright sources. 1/f noise was removed by highpass filtering, after our target was masked to avoid flux loss. We used second-level deglitching to remove glitches. Mosaics (Fig. 1) were created with pixel sizes of 11, 14, and 21 at 70, 100, and 160 µm, by combining the individual scan maps with a weighted average. SPIRE maps were obtained on 2011 August 16 at 250, 350 and 500 µm in small scan map mode with a repetition factor of 2. Data reduction was performed with HIPE v9.2 using the standard pipeline script. The beam size was 181, 252 and 366 at 250, 350, and 500 µm, respectively, and the maps were resampled to pixel sizes of 6″, 10″, and 14″.
HD95086 was observed with the InfraRed Spectrograph (IRS) onboard the Spitzer Space Telescope on 2004 February 4. Small 23 maps were taken using the low-resolution IRS modules, covering the m wavelength range with a spectral resolution of . We downloaded the data processed with the pipeline version S18.18.0 from the archive and further processed them with the Spitzer IRS Custom Extraction Software (SPICE v2.5.0). We treated the data as a nodding measurement by using the two central map positions and subtracting them from each other. Then, we extracted the positive signal from a wavelength-dependent, tapered aperture, and averaged them. The final spectrum is plotted in Fig. 2a.
On 2011 April 22, we observed HD95086 at the 345.796 GHz 12CO =32 line using the SHeFI/APEX2 receiver (Vassilev et al., 2008) mounted at the 12 m APEX telescope111This publication is based on data acquired with the Atacama Pathfinder EXperiment (APEX). APEX is a collaboration between the Max-Planck-Institut für Radioastronomie, the ESO, and the Onsala Space Observatory. (Güsten et al., 2006) (M-087.F-0001 program, PI: Th. Henning). We used the Fast Fourier Transform Spectrometer with 2048 channels, providing a velocity resolution of 0.42 km s-1. An on-off observing pattern was utilized with beam switching. The total on-source integration time was 29.4 minutes. The data reduction was performed using GILDAS/CLASS222http://iram.fr/IRAMFR/GILDAS/. For the final spectrum, we subtracted a linear baseline from each individual scan, and averaged them after omitting the noisy scans.
We obtained a high-resolution optical spectrum of HD95086 with the Fiber-fed Extended Range Optical Spectrograph (FEROS, Kaufer et al., 1999) mounted at the 2.2 m MPG/ESO telescope in La Silla, Chile, on 2011 April 17. This instrument covers the wavelength range between 3500 and 9200 Å in 39 echelle orders with a resolution of 48 000. We used the “object-sky” mode, with one fiber positioned at the target, and the other one on the sky. The integration time was 120 s. Data reduction, including bias subtraction, flat-field correction, background subtraction, the definition and extraction of orders, and wavelength calibration, was performed using the FEROS data reduction system pipeline at the telescope.
3. Results and analysis
3.1. Stellar properties
To estimate the basic properties of HD95086 and provide photospheric flux predictions at relevant mid- and far-IR wavelengths, we modeled the stellar photosphere by fitting the optical and infrared photometric data with an ATLAS9 atmosphere model (Castelli & Kurucz, 2003). We used photometry from Hipparcos (Perryman et al., 1997), TYCHO2 (Høg et al., 2000), and 2MASS (Skrutskie et al., 2006) that were supplemented by band (centered on 3.4µm) photometry from WISE (Wright et al., 2010). Assuming that the interstellar reddening is negligible and adopting solar metallicity and our minimization yielded = 7500150 K and a luminosity of = 7.00.6 L⊙ (using a -based distance of 90.4 pc, van Leeuwen 2007). The derived is identical with that obtained by Chen et al. (2012) from color indices.
To obtain , , and from our FEROS spectrum, we used an iterative fitting method described in e.g. Szabó et al. (2011). First, we varied these three parameters using spectra from Munari et al. (2005), in the 4000–6200Å wavelength range, excluding the region and Na D lines. Radial velocity was calculated from the cross-correlation function, convolving the measured spectrum with the best-fit Munari template, but setting to 1.0 and to 0. This yielded 17 km s-1. After transforming the measured spectrum to the laboratory system, and keeping , , and in the global minimum, we fitted [Fe/H] in the second step. and was re-fitted in the third iteration. Our best-fit parameters are K, , kms-1, [Fe/H] = 0.250.5. This supports our result obtained from the photometry (see above). Rameau et al. (2013) estimated a stellar mass of 1.6 M⊙ for HD95086.
3.2. Herschel maps
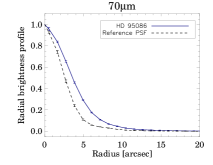
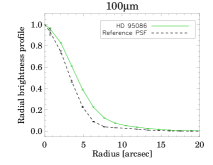
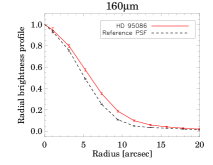
HD95086 appeared as an isolated bright source on our PACS images (Fig. 1, upper panels). To estimate the disk size, we constructed point spread functions (PSFs) using PACS observations of two calibrator stars ( Boo, Tau) without known infrared excess, measured and processed in the same way as HD95086. The PSF maps were rotated to match the roll angle of the telescope at the time of observing HD95086. The FWHM point-source sizes, as measured on these maps are 5501, 6701, and 10603 at 70, 100, and 160µm, respectively. We derived azimuthally averaged radial brightness profiles and averaged the individual measurements to obtain a reference PSF. By comparing the azimuthally averaged radial brightness profiles of HD95086 with these reference PSFs, we found that the disk around HD95086 is spatially extended at all PACS wavelengths (Fig. 1, lower panels).
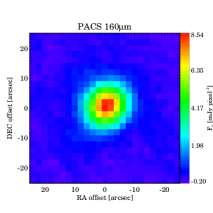
We fitted elliptical Gaussians to the images of the source in order to derive the FWHM sizes of the major and minor axes and the position angles (see Table 1). Then, we estimated the disk size by quadratic deconvolution with the PSF, and calculated the inclination (at 70 and 100µm) assuming that the intrinsic shape/structure of the disk is azimuthally symmetric. The contribution of stellar photosphere to the total flux was negligible (0.3%) in all bands, thus we did not subtract the model photospheric emissions from the source images before the Gaussian fitting. Table 1 lists the final parameters and their uncertainties. The coarse spatial resolution at 160 µm prevented us from determining a reliable position angle and inclination. Our results outline a large disk with a characteristic size of 6054 (540490 AU).
| Original FWHM of the | Disk size after | Position | Incl. | ||
|---|---|---|---|---|---|
| source before deconvolution | quadratic deconvolution | angle | |||
| majorminor axis [″] | majorminor axis [″] | majorminor axis [AU] | [] | [] | |
| PACS 70µm | 8.10.17.70.1 | 5.90.15.40.2 | 530490 | 995 | 235 |
| PACS 100µm | 9.10.18.60.1 | 6.20.25.40.2 | 560490 | 1137 | 294 |
| PACS 160µm | 12.50.512.20.4 | 6.71.06.10.9 | 600550 | … | … |
We measured the flux of HD95086 on the individual PACS scan maps using an aperture radius of 18′′ and a sky annulus between 40′′ and 50′′. We calculated the average and RMS of the individual flux values, applied aperture correction, and calculated the final uncertainties of the photometry by adding quadratically the measurement errors and an absolute calibration uncertainty of 7% (Balog et al., submitted). Our target was clearly detected as a point source at all SPIRE wavelengths. We performed photometry with an aperture radius of 22″, 30″, and 42″ at 250, 350, and 500 µm. Background levels were estimated in annuli extending from 60″ to 90″. The final uncertainties were derived as the quadratic sum of the measurement errors and the overall calibration uncertainty of 5.5% for the SPIRE photometer (Bendo et al., 2013). Our Herschel photometry for HD95086 is listed in Table 2.
3.3. Modeling of dust distribution
We compiled the spectral energy distribution (SED) of HD95086 by combining the new PACS and SPIRE fluxes with infrared photometry from the literature. For the fitting process the IRS spectrum was sampled in 11 bins. Table 2 summarizes the collected IR data.
| Wavelength | Measured flux density | Instrument | Predicted photospheric flux density | Reference |
|---|---|---|---|---|
| [µm] | [mJy] | [mJy] | ||
| 3.35 | 626.724.7 | WISE | 592.3 | Wright et al. (2010) |
| 4.60 | 336.811.5 | WISE | 329.4 | Wright et al. (2010) |
| 9.03 | 95.713.0 | IRS | 90.7 | this work |
| 11.02 | 67.37.0 | IRS | 61.3 | this work |
| 11.56 | 62.73.0 | WISE | 55.8 | Wright et al. (2010) |
| 13.02 | 51.25.4 | IRS | 44.2 | this work |
| 14.87 | 44.74.6 | IRS | 34.0 | this work |
| 16.99 | 40.04.4 | IRS | 26.1 | this work |
| 19.02 | 43.15.0 | IRS | 20.9 | this work |
| 21.31 | 46.77.3 | IRS | 16.7 | this work |
| 22.09 | 51.63.3 | WISE | 15.5 | Wright et al. (2010) |
| 23.67 | 45.62.0 | MIPS | 13.5 | Chen et al. (2012) |
| 24.48 | 59.06.0 | IRS | 12.6 | this work |
| 27.45 | 77.37.6 | IRS | 10.1 | this work |
| 30.50 | 96.710.0 | IRS | 8.1 | this work |
| 33.55 | 137.918.6 | IRS | 6.7 | this work |
| 60.00 | 601.048.1 | IRAS | 2.1 | Moshir et al. (1989) |
| 70.00∗ | 690.148.6 | PACS | 1.5 | this work |
| 71.42 | 655.044.4 | MIPS | 1.5 | Chen et al. (2012) |
| 100.00∗ | 675.147.6 | PACS | 0.7 | this work |
| 160.00∗ | 462.432.7 | PACS | 0.28 | this work |
| 250.00 | 213.412.9 | SPIRE | 0.12 | this work |
| 350.00 | 120.38.7 | SPIRE | 0.06 | this work |
| 500.00 | 63.610.2 | SPIRE | 0.03 | this work |
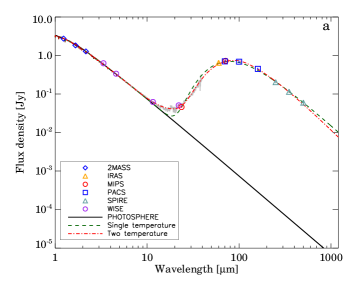
The resulting SED with the stellar photosphere model (Sect. 3.1) is presented in Fig. 2a. The IRS spectrum shows that IR excess is present even at 10. No silicate features are apparent, implying the depletion of small grains. We assumed optically thin dust emission in the modeling, and as a first simple model, we fitted the excess by a single temperature modified blackbody, where the emissivity is equal to 1 at and varies as at . Following Williams & Andrews (2006), we adopted =100µm. We used a Levenberg-Marquardt algorithm in the modeling, and utilized an iterative method to compute color corrections (Moór et al., 2006). Table 3 lists the best-fit parameters and the reduced of the fitting. Fig. 2a shows that the best-fit model underestimates the observed excess, especially at shorter wavelengths. This discrepancy can be explained if the emitting dust grains – similarly to many other debris systems (e.g. Morales et al., 2011) and our Solar System – are distributed in two spatially separated rings. With this assumption, we used a two-component model, where grains in the warmer component act like blackbodies, while the emission of the outer ring is described by the modified blackbody as defined above. As Fig. 2a and the improved value (Table 3) indicate, this model fits the SED better over the whole studied wavelength range. The fractional luminosity of the rings was computed as . The radius of the dust ring(s) was estimated using the following formula (Backman & Paresce, 1993):
| (1) |
Because of the blackbody assumption, the resulting values are lower limits The obtained fundamental disk properties are listed in Table 3.
The dust mass of the disk was estimated using the following formula:
| (2) |
where is the measured SPIRE flux at 500µm, is the distance to the source (90.4 pc), is the mass absorption coefficient, is the Planck function using the Rayleigh-Jeans approximation. Assuming a cm2 g-1 at GHz (e.g. Nilsson et al., 2010) and taking and K from Table 3, we derived a dust mass of 0.50.1 M⊕.
| Single temperature | Two temperature | ||
|---|---|---|---|
| Warm comp. | Cold comp. | ||
| 4.6 | 0.9 | ||
| [K] | 641 | 18726 | 571.5 |
| 0.170.06 | 0 | 0.410.07 | |
| [AU] | 502.4 | 5.91.6 | 63.74.4 |
| [10-3] | 1.50.1 | 0.140.10 | 1.40.2 |
3.4. CO data
No CO emission was detected in our APEX spectrum. We converted antenna temperatures to flux densities using conversion factors from the APEX web page333http://www.apex-telescope.org/telescope/efficiency/ and computed an upper limit for the CO(3–2) line flux () as , where =0.95 Jy is the measured RMS noise at the systemic velocity of the star, =0.42 km s-1 is the velocity channel width, and is the number of velocity channels over an interval of 10 km s-1, which covers the expected line width. The resulting upper limit is 1.95 Jy km s-1 for . Assuming optically thin emission and using a range of excitation temperatures between 20 K and 60 K (the latter value corresponds to the dust temperature in the outer ring, see Sect. 3.3), the upper limit for the total CO mass is between 1.410-4 and 1.710-4 M⊕.
4. Discussion
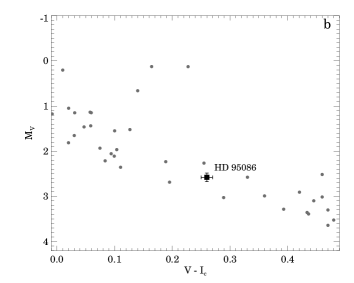
Analyzing Hipparcos astrometric data, de Zeeuw et al. (1999) identified a total of 180 probable members in the LCC association. Among their proposed members, HD95086 has the lowest membership probability of 41%. In order to re-check the membership status of HD95086, we used our new radial velocity and Hipparcos astrometric data to compute a Galactic space motion of U = 10.51.0, V = 22.31.8, W = 5.20.4 kms-1. According to Chen et al. (2011), the characteristic space motion of LCC is U = 7.80.5, V = 20.70.6, W = 6.00.3 kms-1, thus there is a good kinematic match between our target and LCC. The position of HD95086 in the color-magnitude diagram in Fig. 2b fits well to the locus defined by LCC members, indicating that its isochrone age is consistent with that of the cluster. Based on these findings, we propose that HD95086 is a very probable member of LCC. With its distance of 90.4 pc, HD95086 is one of the closest member of the association.
Pecaut et al. (2012) derived an age of 17 Myr for LCC based on isochrone fitting while Song et al. (2012) proposed 10 Myr from lithium content of late-type LCC stars. The latter estimate is close to the timescale on which primordial gas is believed to disappear (e.g. Mamajek, 2009). Thus, if the 10 Myr age estimate proves to be true, we cannot exclude that this disk would contain substantial amount of primordial gas similarly to transitional disks. Converting our upper limit on the CO mass to total gas mass assuming a canonical H2/CO abundance ratio of 104, the estimated gas mass in the disk of HD95086 is 0.12 M⊕ (3.7 M⊙). This is several orders of magnitude below the typical Herbig Ae and transitional disk masses. This result and the low gas-to-dust mass ratio of 0.25 implies that HD95086 harbors a gas-poor debris disk.
The debris disk of HD95086 has a high fractional luminosity of 1.510-3. With this value, it belongs to the top ten highest fractional luminosity debris systems in the solar neighbourhood (d 120 pc, Moór et al., 2006; Rhee et al., 2007). Interestingly, these systems have other common properties: they are younger than 100 Myr, and most of them belong to different young moving groups and associations. We found that the HD95086 disk contains two dust belts: a warm one with a characteristic temperature of 187 K, and a colder one with 57 K. Such structures seem to be relatively common. Morales et al. (2011) found that a significant fraction of debris disks harbors two spatially distinct dust components. The characteristic dust temperatures for the inner and outer dust belts (190 K and 60 K) were found to be very similar independently of the host stars’ luminosity, implying that the formation of dust belts is controlled by a temperature-sensitive mechanism. Several other members of the young massive debris disk group also share similar properties (e.g., Su et al., 2009; Roberge et al., 2013; Donaldson et al., 2013). Because the characteristic temperature of the warm component is slightly above the ice evaporation temperature, Morales et al. (2011) proposed that the formation of the warm component is related to sublimation of icy planetesimals crossing the snow line, or due to collisions in an asteroid belt-like system formed just interior to the snow line (see also Martin & Livio, 2013). One of these mechanisms could also work in the case of HD95086.
To determine the relative location of the two dust belts and the planet candidate, we need to constrain the inclination of the planetary orbit. From our resolved Herschel observations, the disk inclination is 25°. The star’s equatorial plane is probably not very different from this, because the observed = 20 km s-1 is unusually low compared to stars with similar masses (Zorec & Royer, 2012), implying a low stellar inclination. Assuming that the disk and the planet’s orbit are coplanar, and taking the projected orbital radius of 56 AU from Rameau et al. (2013), the deprojected orbital radius would be 62 AU. We derived a radius of 64 AU for the outer dust belt. Since we adopted blackbody grains, this is a lower limit, because smaller grains with the same temperature can be located farther from the star. Thus, it is possible that the planet candidate is situated just inside the cold outer dust belt. Further monitoring of the planet candidate will reveal whether it orbits within the outer dust belt. If it stays inside, it might sculpt the inner edge of the belt, and may induce azimuthal asymmetries in the dust distribution. We note that the planetary system of HD95086 resembles the one around HR8799. Both systems harbor a warm inner dust belt and a broad colder outer disk and giant planet(s) between the two dusty regions.
The short lived dust grains in debris disks are believed to be replenished by collisions between larger bodies. For destructive collisions, the collision velocity must exceed a critical value and it requires a dynamical perturbing force. According to theory, this perturbation is linked to 1000 km-sized planetesimals formed within the planetesimal ring (self-stirring, Kenyon & Bromley, 2008), or the presence of planet(s) in the system (planetary stirring, Mustill & Wyatt, 2009). The formation of 1000 km-sized planetesimals is a slow process at large orbital radii. Adopting an age of 17 Myr for the system and using Eqs. 27,41 from Kenyon & Bromley (2008), we found that, even in a disk with an unusually high initial surface density (ten times higher than the minimum-mass solar nebula), the formation of such large bodies is limited to 70 AU. Our PACS images show that the disk around HD95086 is spatially extended with a diameter of 540 AU. While large dust grains have the same spatial distribution as the parent planetesimals, the distribution of small grains (smaller than the blowout limit of 1.8µm, estimated following Wyatt, 2008) can be more extended, because they are expelled by stellar radiation pressure and form a dust halo. However, the contribution of such small grains to the 100 and 160µm flux is small, suggesting that HD95086 harbors an extended planetesimal belt whose dynamical stirring cannot be explained by self-stirring. Mustill & Wyatt (2009) claim that planetary stirring can be faster than self-stirring in the outer regions of planetary systems. Using their formulae, we found that the candidate planet can dynamically excite the motion of planetesimals even at 270 AU via their secular perturbation if its orbital eccentricity is larger than 0.4. Alternatively, without effective stirring, collisions with low velocity can lead to merging grains, thus we cannot exclude that the outer disk region contains primordial dust as well.
References
- Backman & Paresce (1993) Backman, D. E., & Paresce, F. 1993, in Protostars and Planets III, ed. E. H. Levy & J. I. Lunine (Tucson: Univ. Arizona Press), 1253
- Bendo et al. (2013) Bendo, G. J., Griffin, M. J., Bock, J. J., et al. 2013, MNRAS, 1713
- Castelli & Kurucz (2003) Castelli, F. & Kurucz, R. L. 2003, Modelling of Stellar Atmospheres (IAU Symp. 210), ed. N. E. Piskunov, W. W. Weiss, & D. F. Gray (San Francisco, CA: ASP), A20
- Chen et al. (2011) Chen, C. H., Mamajek, E. E., Bitner, M. A., et al. 2011, ApJ, 738, 122
- Chen et al. (2012) Chen, C. H., Pecaut, M., Mamajek, E. E., Su, K. Y. L., & Bitner, M. 2012, ApJ, 756, 133
- de Zeeuw et al. (1999) de Zeeuw, P. T., Hoogerwerf, R., de Bruijne, J. H. J., Brown, A. G. A., & Blaauw, A. 1999, AJ, 117, 354
- Donaldson et al. (2013) Donaldson, J. K., Lebreton, J., Roberge, A., Augereau, J.-C., & Krivov, A. V. 2013, arXiv:1305.7230
- Ertel et al. (2012) Ertel, S., Wolf, S., & Rodmann, J. 2012, A&A, 544, A61
- Griffin et al. (2010) Griffin, M. J., Abergel, A., Abreu, A., et al. 2010, A&A, 518, L3
- Güsten et al. (2006) Güsten, R., Nyman, L. Å., Schilke, P., Menten, K., Cesarsky, C., & Booth, R. 2006, A&A, 454, L13
- Høg et al. (2000) Høg, E., Fabricius, C., Makarov, V. V., et al. 2000, A&A, 355, L27
- Hughes et al. (2011) Hughes, A. M., Wilner, D. J., Andrews, S. M., et al. 2011, ApJ, 740, 38
- Kalas et al. (2008) Kalas, P., Graham, J. R., Chiang, E., et al. 2008, Science, 322, 1345
- Kaufer et al. (1999) Kaufer, A., Stahl, O., Tubbesing, S., et al. 1999, The Messenger, 95, 8
- Kenyon & Bromley (2008) Kenyon, S. J., & Bromley, B. C. 2008, ApJS, 179, 451
- Krivov et al. (2009) Krivov, A. V., Herrmann, F., Brandeker, A., & Thébault, P. 2009, A&A, 507, 1503
- Lagrange et al. (2009) Lagrange, A.-M., Kasper, M., Boccaletti, A., et al. 2009, A&A, 506, 927
- Mamajek (2009) Mamajek, E. E. 2009, American Institute of Physics Conference Series, 1158, 3
- Marois et al. (2008) Marois, C., Macintosh, B., Barman, T., et al. 2008, Science, 322, 1348
- Martin & Livio (2013) Martin, R. G., & Livio, M. 2013, MNRAS, 428, L11
- Moór et al. (2006) Moór, A., Ábrahám, P., Derekas, A., et al. 2006, ApJ, 644, 525
- Moór et al. (2011a) Moór, A., Ábrahám, P., Juhász, A., et al. 2011, ApJ, 740, L7
- Moór et al. (2011b) Moór, A., et al. 2011, ApJS, 193, 4
- Morales et al. (2011) Morales, F. Y., Rieke, G. H., Werner, M. W., et al. 2011, ApJ, 730, L29
- Moshir et al. (1989) Moshir, M., et al. 1989, Explanatory Supplement to the IRAS Faint Source Survey (Pasadena: JPL) (FSC)
- Munari et al. (2005) Munari, U., Sordo, R., Castelli, F., & Zwitter, T. 2005, A&A, 442, 1127
- Mustill & Wyatt (2009) Mustill, A. J., & Wyatt, M. C. 2009, MNRAS, 399, 1403
- Nilsson et al. (2010) Nilsson, R., et al. 2010, A&A, 518, A40
- Ott (2010) Ott, S. 2010, Astronomical Data Analysis Software and Systems XIX, 434, 139
- Pecaut et al. (2012) Pecaut, M. J., Mamajek, E. E., & Bubar, E. J. 2012, ApJ, 746, 154
- Perryman et al. (1997) Perryman, M. A. C., Lindegren, L., Kovalevsky, J., et al. 1997, A&A, 323, L49
- Pilbratt et al. (2010) Pilbratt, G. L., Riedinger, J. R., Passvogel, T., et al. 2010, A&A, 518, L1
- Poglitsch et al. (2010) Poglitsch, A., Waelkens, C., Geis, N., et al. 2010, A&A, 518, L2
- Moore & Quillen (2013) Moore, A., & Quillen, A. C. 2013, MNRAS, 430, 320
- Rameau et al. (2013) Rameau, J., Chauvin, G., Lagrange, A.-M., et al. 2013, ApJ, 772, L15
- Rhee et al. (2007) Rhee, J. H., Song, I., Zuckerman, B., & McElwain, M. 2007, ApJ, 660, 1556
- Rizzuto et al. (2012) Rizzuto, A. C., Ireland, M. J., & Zucker, D. B. 2012, MNRAS, 421, L97
- Roberge et al. (2013) Roberge, A., Kamp, I., Montesinos, B., et al. 2013, ApJ, 771, 69
- Siess et al. (2000) Siess, L., Dufour, E., & Forestini, M. 2000, A&A, 358, 593
- Skrutskie et al. (2006) Skrutskie, M. F., Cutri, R. M., Stiening, R., et al. 2006, AJ, 131, 1163
- Song et al. (2012) Song, I., Zuckerman, B., & Bessell, M. S. 2012, AJ, 144, 8
- Su et al. (2009) Su, K. Y. L., Rieke, G. H., Stapelfeldt, K. R., et al. 2009, ApJ, 705, 314
- Szabó et al. (2011) Szabó, G. M., Szabó, R., Benkő, J. M., et al. 2011, ApJ, 736, L4
- van Leeuwen (2007) van Leeuwen, F. 2007, Astrophysics and Space Science Library, 350, Hipparcos, The New Reduction of the Raw Data (Dordrecht: Springer)
- Vassilev et al. (2008) Vassilev, V., Meledin, D., Lapkin, I., et al. 2008, A&A, 490, 1157
- Williams & Andrews (2006) Williams, J. P., & Andrews, S. M. 2006, ApJ, 653, 1480
- Wright et al. (2010) Wright, E. L., et al. 2010, AJ, 140, 1868
- Wyatt (2008) Wyatt, M. C. 2008, ARA&A, 46, 339
- Zorec & Royer (2012) Zorec, J., & Royer, F. 2012, A&A, 537, A120