Long-term Spatial and Temporal Variations of Aurora Borealis Events in the Period 1700–1905
Abstract
Catalogues and other records of aurora-borealis events were used to study the long-term spatial and temporal variation of these phenomena in the period from 1700 to 1905 in the Northern Hemisphere. For this purpose, geographic and geomagnetic coordinates were assigned to approximately 27 000 auroral events with more than 80 000 observations. They were analysed separately in three large-scale areas: i) Europe and North Africa, ii) North America, and iii) Asia. There was a clear need to fill some gaps existing in the records so as to have a reliable proxy of solar activity, especially during the 18th century. In order to enhance the long-term variability, an 11-year smoothing window was applied to the data. Variations in the cumulative numbers of auroral events with latitude (in both geographic and geomagnetic coordinates) were used to discriminate between the two main solar sources: coronal mass ejections and high-speed streams from coronal holes. The characteristics of the associated aurorae correlate differently with the solar-activity cycle.
keywords:
Solar Activity, Geomagnetic Storm, Aurora Borealis1 Introduction
Aurorae are the most easily seen manifestations of the interaction (compression and magnetic reconnection) between the solar wind and the Earth’s magnetosphere. Just naked-eye observations are sufficient, without any need for specific training. They are therefore a useful tool with which to study the variability of this process in past centuries because several catalogues, books, and reports of various kinds are available. Here we shall concentrate on two recent centuries. For longer periods of time (thousands of years), the use of cosmogenic isotopes, such as 14C and 10Be, or of the nitrate content in polar ice is recommended (Usoskin and Kovaltsov, 2012; Traversi et al., 2012).
The visibility of aurorae is limited to ring-shaped regions around the geomagnetic poles – the auroral ovals, centred at around 65 degrees magnetic latitude in each hemisphere. Under the impact of a solar storm, the auroral ovals undergo broadening, particularly on the night side. Low-latitude aurorae are very rare, and are clearly associated with strong geomagnetic storms produced by solar coronal mass ejections. They are generally red and diffuse, resulting primarily from an enhancement of the 630.0 nm [OI] emission due to bombardment by soft electrons (100 eV) precipitating from the plasmasphere (Tinsley et al., 1986). The typical altitude for a low-latitude aurora is 250 – 400 km (Roach et al., 1960). They can be confused with distant fires or twilight due to their colour. The limits of such aurorae are usually 15 and 45 degrees geomagnetic latitude. A similar phenomenon, which shares the same energy source, is that of stable auroral red arcs. They are observed mainly during the recovery phase of geomagnetic storms (Rassoul et al., 1993; Nakazawa, Okada and Shiokawa, 2004).
The visual sensitivity thresholds of the green and red radiation of the aurorae are between one and ten kilorayleighs, which means that only those aurorae coming from moderate and strong geomagnetic storms will be visible and therefore part of our sample (Schröder, Shefov, and Treder, 2004). It is clear that the meteorological conditions also play a role, although a cloud-free sky is not necessary. According to Livesey (1991), the zone with the greatest aurora-borealis probability passes across northern Norway, over to Iceland, south of Greenland, and over to the South of Hudson Bay in North America.
Fritz (1873) produced the first graph showing the geographical distribution of auroral frequencies, measured in nights per year. The values ranged from a minimum in the Mediterranean area to a maximum at a magnetic latitude of 67 degrees.
In previous articles (Vázquez et al., 2006; Vázquez and Vaquero, 2010), we have studied low-latitude auroral events. We established a correlation with several indices of solar activity and drifts of magnetic latitude at two different sites, verifying the adequacy of such terrestrial events to track the long-term variation of solar activity in the past. For a monograph on historical aspects of solar activity, see Vaquero and Vázquez (2009).
In the present work, we considered the period 1700 – 1905 for which various documental sources of auroral observations are available, indicating the date and place of the observations. This allowed geographic coordinates to be ascribed to each observation, with a maximum of six sites being taken per day and per catalogue. If necessary, a selection was made from the existing sample to give the broadest coverage in both longitude and latitude. For a previous work on auroral activity in this period, see Feyman and Silverman (1980), although their study is restricted spatially to Scandinavian and New England sources.
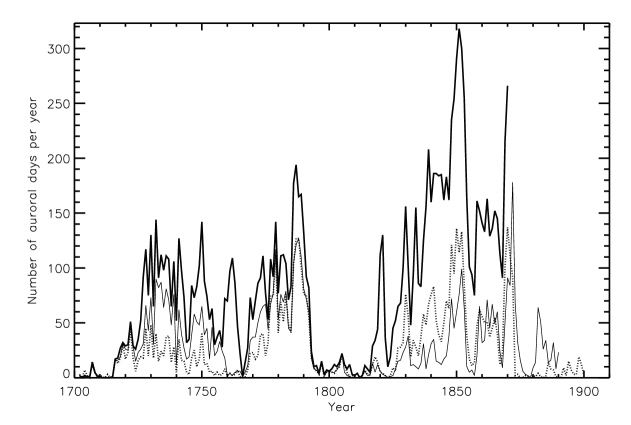
Table \irefaurCat lists the documentary sources used in the present work. The number of days in the period studied (1700 – 1905) was approximately 73 000 (200 years). The available data for the Northern Hemisphere were divided into three continental areas corresponding to Europe (and North Africa), North America, and Asia. The main sources of data were the catalogue of Fritz (1873) and the archives of S. Silverman111These include: (a) Catalog of Ancient Auroral Observations, 666 BCE to 1951; (b) The Auroral Notations from the Canadian Monthly Weather Review; (c) The New England Auroral Observations (1720 – 1998); and (d) Daily Auroral Reports, Southeastern Canada and Northeastern US (1848 – 1853).. For only a few places (less than ten) was it impossible to unequivocally determine the site’s coordinates. More frequently, only the names of countries or US states were described, and in these cases average coordinates were assigned.
Fritz’s North American data are mainly based on the earlier catalogues of Lovering (1866) and Loomis (1860, 1861). They are complemented for the later phase of the 19th century with data from Greeley (1881) and different archives collected by S. Silverman.
For Europe, the Fritz data were complemented with additional values for high latitudes from Rubenson (1882) and Tromholt222For a biography of S. Tromholt see Moss and Stauning (2012). (1898). Particularly relevant are the Greenland observations, contained in the Fritz catalogue and the Silverman archives (see Stauning, 2011). For the rare low latitude observations, we included data for the Iberian Peninsula333They include published data from Vaquero, Gallego, and Garcia (2003), Vaquero and Trigo (2005), Aragonès Valls and Orgaz Gargallo (2010), and Vaquero et al. (2010). and the Canary Islands (Vázquez and Vaquero 2010).
| Observing Area | Catalogue | Number of | Number of |
| auroral days | locations | ||
| Europe and N. Africa | TOTAL | 25 306 | 43 460 |
| Fritz (1873) | 9761 | 15 874 | |
| S. Silverman Archives | 6089 | 11 810 | |
| Angot (1897) | 439 | 753 | |
| Rubenson (1892) | 5924 | 9809 | |
| Tromholt (1902) | 2311 | 4328 | |
| Sunderland Archive | 453 | 454 | |
| Hungary (Réthly and Berkes, 1963) | 97 | 138 | |
| Visser (1942) | 93 | 93 | |
| Harrison (2005) | 8 | 8 | |
| W. Schröder (1966) | 3 | 5 | |
| Iberian Peninsula | 76 | 109 | |
| Vázquez and Vaquero (2010) | 9 | 12 | |
| Different Journals | 8 | 12 | |
| North America | TOTAL | 15 617 | 38 275 |
| Fritz (1873) | 5351 | 11 160 | |
| S. Silverman Archives | 8605 | 23 674 | |
| Greeley (1881) | 1379 | 2919 | |
| Lueders (1984) | 121 | 121 | |
| Broughton (2002) | 14 | 14 | |
| Mendillo and Keady (1976) | 5 | 5 | |
| Eather (1980) | 4 | 4 | |
| Asia | TOTAL | 324 | 359 |
| Fritz (1873) | 245 | 270 | |
| Yau et al. (1995) | 27 | 27 | |
| Lee et al. (2004) | 6 | 8 | |
| Willis, Stephenson and Fang (2007) | 33 | 36 | |
| S. Silverman Archives | 11 | 14 | |
| Basurah (2004) | 2 | 2 | |
| Harrison (2005) | 1 | 1 |
The data sample is clearly inhomogeneous in both space and time. This reflects not only meteorological variations but also the difficulties of access of some regions. For North America, there are many temporal gaps until 1746, and, after that, no data are available for the years 1754, 1755, 1756, 1766, 1799, 1810, or 1812. There is a remarkable contribution for the entire period studied from numerous forts (more than 60) located along the borders of the expanding settlement of the western and northern territories.
After the Maunder Minimum, the works of Halley (1716) and Mairan (1733) marked the beginning of modern studies of aurorae. Krivský and Pejml (1988) and Krivský (1996) compiled a catalogue (archived at the National Geophysical Data Centre) recording the aurorae visible in Europe in the period 1715 – 1850 at latitudes lower than 55 degrees. They assumed that nearly all of the aurorae were recorded after roughly 1720, and that therefore no normalization factor needed to be applied (Figure \irefaurkr). These records are compared with the catalogue of Angot (1897) for the period 1700 – 1890, also covering observations at latitudes lower than 55 degrees, and Fritz (1873) with no restrictions on latitude. Unfortunately, no such global catalogues exist for the 20th century.
The reduction in the number of aurorae observed during the Dalton Minimum is confirmed (Silverman, 1992; Broughton, 2002; Vaquero et al., 2003). Two strong episodes of auroral activity are clearly seen around 1775 and 1850 (Figure 1). Around the turn of the 19th to the 20th century, the level of solar activity decreases, as also does the visual-aurora monitoring. There is no recovery from this decrease until the start of the space age in 1957 (Siscoe, 1980; Legrand and Simon, 1987; Silverman, 1992).
It is our purpose now to proceed to a careful statistical study of these classical catalogues, expanding them with other available sources. Our main emphasis is on providing a 3D map (geographic coordinates and time) of the auroral activity in the past, when auroral observations constitute the only information available about heliosphere activity.
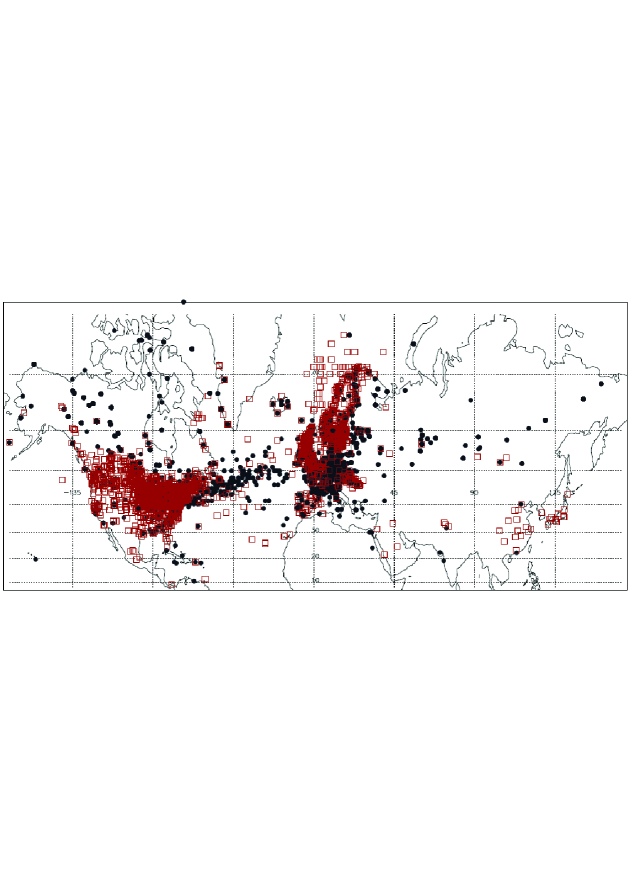
Figure \irefGlMap shows the locations of auroral observations on a Mercator projection of the Northern Hemisphere. The accompanying Tables \irefaurEurCity and \irefaurAmCity indicate the sites where most auroral events were reported for Europe and North America respectively. The numbers are clearly low for Eastern Europe and Asia.
| Site | G. Latitude | G. Longitude | Auroral events |
|---|---|---|---|
| Godhaab (Nuuk) | 64.175 | -51.739 | 2164 |
| Uppsala | 59.85 | 17.63 | 1973 |
| Stockholm | 59.35 | 18.08 | 1593 |
| Christiania (Oslo) | 59.92 | 10.76 | 1536 |
| Jakobshavn (Ilullissat) | 69.17 | -49.83 | 1487 |
| Ofver-Tornea | 66.38 | 23.65 | 1016 |
| Saint Petersburg | 59.95 | 30.32 | 968 |
| Scotland () | 56.00 | -4.00 | 951 |
| Utrecht | 52.09 | 5.12 | 818 |
| Härnosand | 62.66 | 17.94 | 813 |
| Berlin | 52.52 | 13.41 | 623 |
| Paris | 48.86 | 2.35 | 464 |
| Lund | 55.70 | 13.20 | 427 |
| Site | G. Latitude | G. Longitude | Auroral events |
|---|---|---|---|
| Toronto | 43.72 | -79.34 | 1800 |
| Cambridge, MA | 42.37 | -71.11 | 921 |
| New Haven | 41.31 | -72.92 | 908 |
| Gardiner, ME | 44.21 | -69.79 | 798 |
| New York City and State | 43.00 | -75.00 | 734 |
| Winnipeg | 49.90 | -97.14 | 727 |
| York Factory | 57.01 | -92.31 | 518 |
| Quebec | 46.82 | -71.22 | 494 |
| Eastport | 44.91 | -67.00 | 486 |
| Burlington | 44.47 | -73.15 | 340 |
| Moose Factory | 51.26 | -80.59 | 287 |
| Montreal | 45.51 | -73.55 | 259 |
| Point Barrow | 71.39 | -156.48 | 251 |
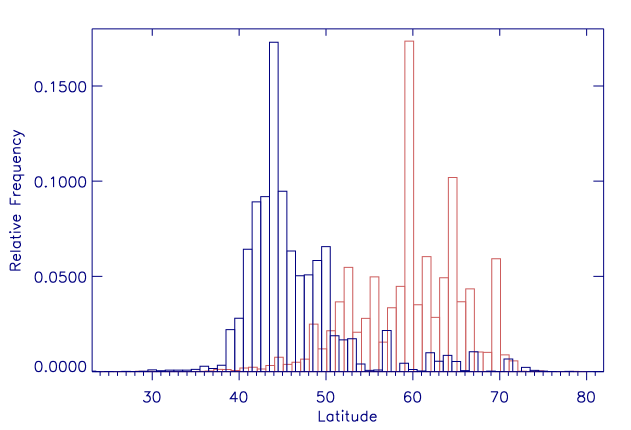
Figure \irefHist shows the histograms of the latitude distributions for Europe and North America. They both suggest a bimodal distribution, with the maxima at middle and high latitudes for North America and Europe, respectively. The expected trend would be an increase of auroral events at high latitudes, but in the case of North America the histograms reflect the slow settlement of the northern areas. Moreover, access to southern data was delayed until these regions (Louisiana, Florida, Texas, New Mexico) were annexed by the USA. A search of 18th century sources in Spanish would be worthwhile for this region.
We checked the relationship between the auroral observations in these catalogues and moonlight, since an aurora should be easier to observe when there is little moonlight during the night. In particular, the light of the full Moon would impede the observation of weak aurorae. Therefore, we expected relatively more (fewer) reported aurorae when there was a new (full) Moon. Indeed, we found that there was a clear decrease of observed events with increasing brightness of the moon, as was expected.
2 Temporal Variation
The number of aurorae is clearly related to the level of solar activity. The records reflect the well-known Spörer, Maunder, Dalton, and 1901 – 1913 minima, and include a previously unrecognized long-term minimum around 1765 (Silverman, 1992, 1995).
A double peak in the geomagnetic records has been observed, with the two maxima occurring i) shortly before the sunspot maximum and produced by transient events (Gonzalez et al., 2002), and ii) two years after the maximum and mainly produced by recurrent events (Tsuratani et al., 2006). Geomagnetic activity is greater in the second half of even-numbered cycles and in the first half of the odd-numbered cycles, giving rise to a 22-year variability (Chernosky, 1966: Vennerstrn and Friis-Christensen, 1996). For a discussion of the geoeffectiveness of the different solar sources of geomagnetic disturbances, see Georgieva et al. (2006).
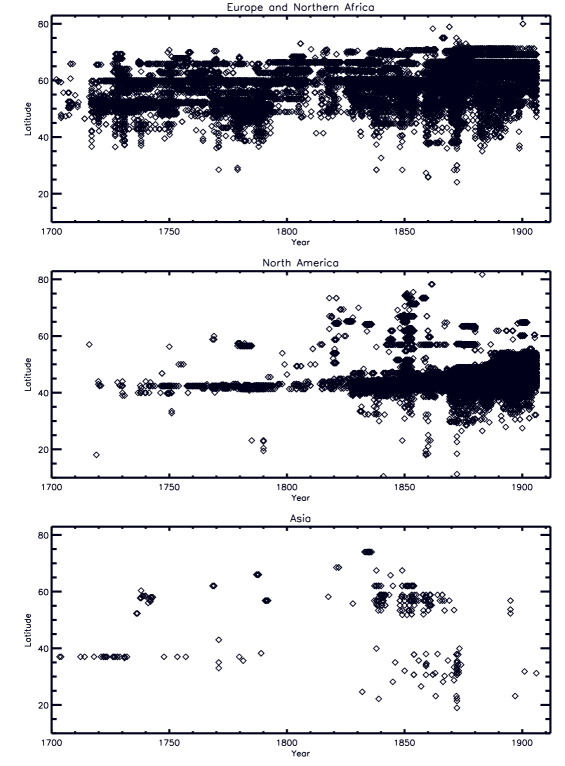
The variation in time and latitude of the auroral observations recorded in our sample is shown in Figure \irefGloTime. The European data reflect the Dalton Minimum very clearly. The lack of high-latitude records in the Fritz catalogue was remedied by including the Scandinavian observations of Tromholt and Rubenson. The aurorae observed in Barcelona in 1811 and 1812 are remarkable, and call for detailed confirmation. The existence of the secondary Silverman Minimum (around 1760) seems also to be confirmed. The middle panel of the figure reflects the paucity of North American data during the 18th century, especially at high latitudes. The settlement of the western regions produces a clear increase in the number of reports. The records in New England are, however, relatively frequent over the whole period. Finally, the bottom panel reflects the scarcity of the data that we were able to collect for auroral observations in Asia. In light of this, in the analyses below we shall concentrate mainly on European and American sources. The combination of the different auroral catalogues shows a quasi-80-year periodicity (the Gleissberg cycle), confirming previous findings (e.g. Siscoe, 1980).
The primary aim of this article was to study the long-term auroral variability gathering together different sources of auroral information. In the following we will calculate some correlations between sunspot numbers and different auroral parameters. In order to enhance this long-term variability an 11-year smoothing window will be applied to the data sets. Clearly, this procedure will increase the strength of the correlation, because we are entering a frequency common to the two sets, and will decrease the degrees of freedom of the series (number of independent points). To evaluate the statistical significance of the correlation we have applied the t-student test, calculating the significance given by the p-value. To take into account the effect of the smoothing in the calculation of the t- and p-parameters, we have reduced the number of independendent points by a factor of 11, the length of our smoothing window. We have verified that the effect of the smoothing on the correlations is very small when the length of the smoothing window is smaller than the length of the data set. For our sample this criteria is fullfilled when the number of available data is larger than 140 years. Finally, we can point out that the correction to the number of statistically independent points resulting from autocorrelation is negligible.
3 Latitudinal Variation
3.1 Solar Source of the Aurorae
One can divide the effects of solar activity on our planet via the solar wind as being due to two agents, depending on the topology of the magnetic field of the solar atmosphere (see Legrand and Simon, 1981).
i) Closed Regions: The magnetic flux of the active regions is characterized by magnetic configurations with closed field lines dominating the variations in the total irradiance and emission in the high energy range of the solar spectrum (ultraviolet and X-rays). For historical reasons, the sunspot number is usually employed as a measure of this type of activity. Coronal mass ejections (CMEs) are transient phenomena linked to large-scale reorganizations of the magnetic field. They consist of huge emissions of solar particles that in some cases impact the Earth’s environment. The CME rate closely follows the solar cycle (Webb and Howard, 1994; Robbrecht, Berghmans, and Van der Linden, 2009) and the Gnevyshev gap (Gnevyshev, 1967), but the main physical parameters of CMEs lag the sunspot number by 19 months, at least for solar cycle 23 (Du, 2012).
ii) Open regions: Large-scale magnetic regions have field lines open towards the interplanetary medium. They are the main source of a continuous outward flow of charged particles (protons, electrons, and helium nuclei) known as the solar wind. Long-lived coronal holes are the sources of high-speed solar wind, and are related to recurrent geomagnetic activity. They occur more frequently in the declining phase of the sunspot cycle (Verbanac et al., 2011).
The solar magnetic field of the open regions, the open magnetic field (OMF), is frozen into this wind, thereby configuring the interplanetary magnetic field (IMF) which produces the heliosphere that fills practically the whole Solar System. Lockwood et al. (1999) and Lockwood (2003) derived the intensity of the interplanetary magnetic field from the aa geomagnetic intensity index, a record that extends back to 1868. They found that the average strength of the solar magnetic field has doubled in the last 100 years. Usoskin et al. (2002) carried out simulations of the variations of the OMF with a model based on the emergence and decay rates of active regions (Solanki, Schüssler, and Fligge, 2002). That model fits reasonably well other proxies of solar activity, such as the 10Be records in ice cores. Since solar cycle 14 (1902 – 1913), the geomagnetic activity lagged behind the sunspot number, but before that date the lag seems to have been less notable (Love, 2011).
Siscoe (1980) discriminated between aurorae that are visible North and South of 54 degrees using Scandinavian records, noting that the southern data tracked the 11-year solar cycle more clearly. Bravo and Otaola (1990) studied the location of solar coronal holes and their influence on the auroral records. They found that the number of aurorae is positively correlated with polar coronal holes that reach solar latitudes below 60 degrees. Verbanac et al. (2011) found that high-speed streams originating in equatorial coronal holes are the main driver of solar activity in the declining phase.
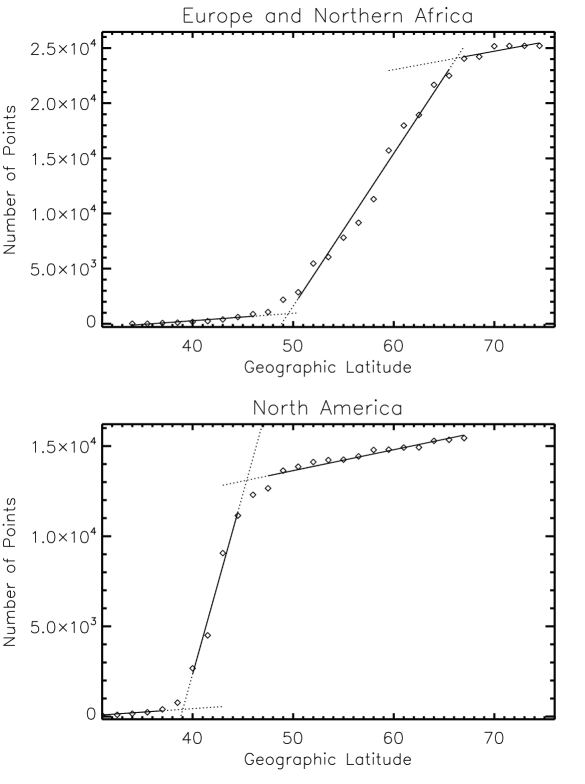
In order to differentiate between the distinct solar sources, we plotted the cumulative values, , of the number of aurorae visible for each 1.5 degree wide latitude band (see the definition below).
| (1) |
The growth found is almost exponential. We took the resulting curve to consist of three segments, to each of which we made straight-line fits. The intersection of the three segments could represent the boundaries between different solar sources of the auroral event. The two plots of Figure \irefaurLatGlob show the results for Europe and North America, respectively.
The low-latitude segment would represent the aurorae produced by strong solar storms, with the northern limit at 49 degrees in Europe and 39 degrees in North America defining the so-called low-latitude aurorae. The middle segment shows auroral events produced by CMEs of medium strength. In the upper latitude segment, the predominant role is played by the fast streams from coronal holes. In this case, the variation of the geographic latitude plays only a minor role. The limits are approximately 66 degrees for Europe and 44 degrees for North America.
3.2 Width of the Auroral Oval
Viewed from space, aurora are diffuse ovals of light around the geomagnetic poles. They can be regarded as the regions of the upper atmosphere with permanent luminescence (Feldstein, 1986). All of the great auroral expansions have been associated with intense values of the interplanetary magnetic field (Sheeley and Howard, 1980). The variation in the radius of the auroral oval in response to solar wind changes has been studied by Milan et al. (2009).
Assuming a spherical Earth with a radius R = 6371 km, one calculates the area (A) of a longitude–latitude rectangle (area between two lines of latitude lat1 and lat2) (Moritz, 1980), as
| (2) |
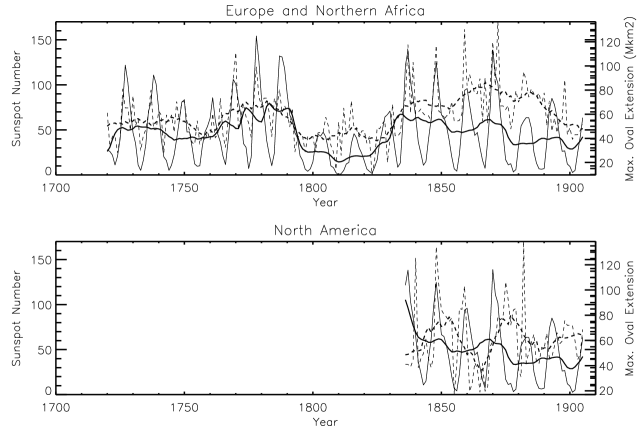
Figure \irefGloLatmaxy shows the variation of the annual maximum of the oval extension with the annual sunspot number. One must bear in mind that the auroral oval is really centred on the geomagnetic pole, so that the above expression is just a first-rough approximation. For the European data (sample 1720 – 1905) the level of correlation is not very strong but significant (r=0.58, p-value 0.02). However, for the North American data (sample 1836 – 1905) the results are much noisier, probably reflecting the shortness of the sample with adequate data and the lack of observations of auroral events at extreme latitudes for many years.
3.3 Low-latitude Aurorae
A solar storm is accompanied by an expansion of the auroral oval towards the Equator on the night side of the Earth. Figure \irefGloLat1y shows the temporal variation of the yearly minimum latitude and its correlation with the sunspot number. For the North American sample, we restricted our observing period to the data after 1803 due to the low latitudinal and temporal coverage at earlier dates. When the data were smoothed with an 11-year window, the correlations for both data samples were good (r = -0.74 and -0.71 for the European and the American data, reflecting the 80-year period of variability of solar activity. However, the level of significance was much better for the European (p-value 0.001) than for the North American data (p-value 0.05), due to the longer data set.
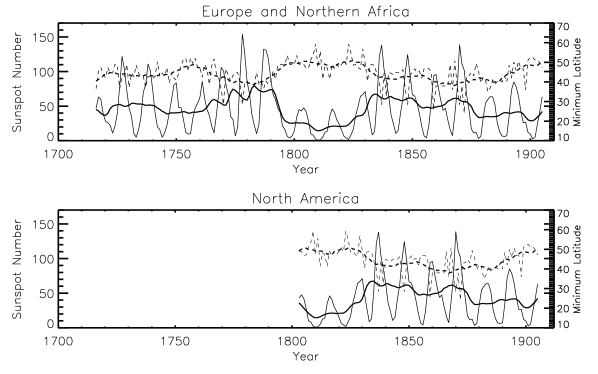
The lowest latitudes were 24.09 degrees for Europe, 24.08 degrees for North America, and 18.97 degrees for Asia. All of these values correspond to the aurora of 4 February 1872 during Solar Cycle 11 (see Silverman, 2008).
In this context, we should remark that low-latitude aurorae have also been observed during periods of weak to moderate geomagnetic activity. Silverman (2003) has shown from US auroral data from 1880 to 1940 that some of the auroral phenomena occurred under conditions of quiet or moderate magnetic activity and at low latitudes. He used the term “sporadic aurora” for this type of auroral phenomenon. Vaquero, Trigo and Gallego (2007) studied one such event observed in 1845 in the Iberian Peninsula. Willis, Stephenson, and Fang (2007) compiled 42 Chinese and Japanese auroral observations during the period 1840 – 1911 and found that at least 29 of the 42 observations (i.e. 69 %) occurred at times of weak to moderate geomagnetic activity.
3.4 High-latitude Aurorae
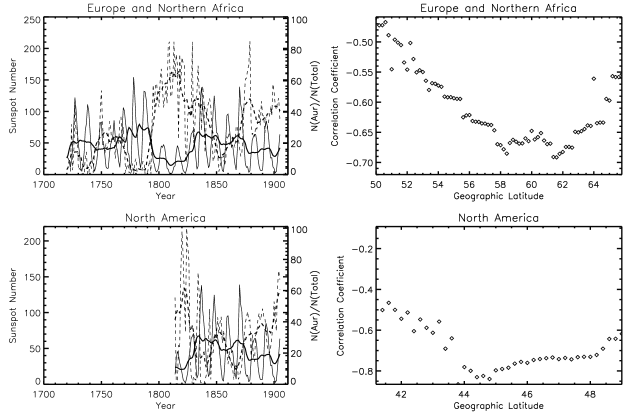
The Greenland observations confirmed that, at high latitudes, the aurorae maximum coincides with the sunspot cycle minimum (Anonymous, 1883). In order to check the reliability of our method in discriminating between different solar sources, we looked for a critical latitude at which this anti-correlation is largest. For this purpose, we normalized the data above a critical latitude to the total number of aurora observations, and plotted the resulting temporal variation.
The best correlation was obtained at 61.4 degrees geographic latitude for Europe (r = -0.70; p 0.005) and 44.8 degrees for North America (r = -0.84; p 0.01), both in phase with the sunspot number (Figure \irefGloLat6y).
4 The Geomagnetic Latitude
Since the frequency of the aurorae is related to distance from the magnetic pole, it is more appropriate to plot the observations versus magnetic latitude.
We computed the temporal evolution of the geomagnetic latitude for every observing location during the entire 1700 – 1905 period. It is common to define within the main geomagnetic field the geomagnetic latitude according to the expression (see Stacey, 1992; Buforn, Pro, and Udías, 2012). We obtained the magnetic inclination (I) from the global geomagnetic model gufm1 (Jackson, Jonkers, and Walker, 2000), which can be applied in the period covered by this study. Therefore, the geomagnetic latitude has been calculated for each auroral record from the value of the magnetic inclination.
We applied this procedure to all of the observing sites. Figure \irefMagLatGlo shows the results for Europe, North America, and Asia. One observes the Dalton Minimum between the two high-activity episodes. However, the few more southern magnetic latitudes during the 18th century are mainly covered by Asian data. Two episodes with high-latitude aurorae occur in 1820 and 1840 close to the minimum phase of the corresponding solar cycles. An unusual aurora was visible close to the magnetic North Pole (Fort Conger) on 17 November 1882. These observations was made by the expedition commanded by A.W. Greeley from July 1882 to August 1883, in the framework of the activities of the First Polar Year (Taylor, 1981). Recently, Singh et al. (2012) have studied the characteristics of high-latitude storms above the classical auroral oval.
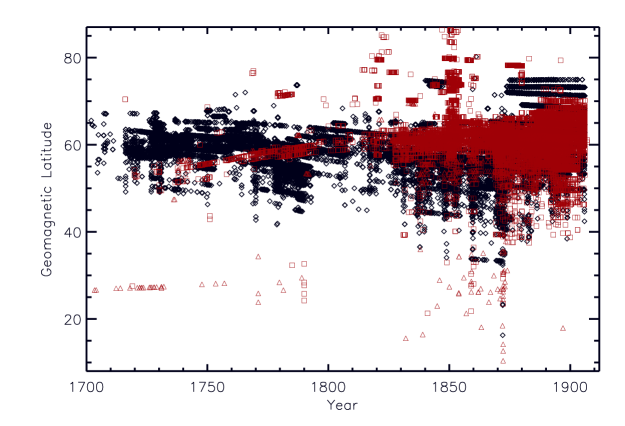
Figure \irefGloMagLat shows the histograms of the geomagnetic latitudes for the three continental masses. The major contribution of the otherwise sparse Asian data to the low geomagnetic latitudes stands out. As with the geographic latitudes, the geomagnetic latitudes also have their absolute minima for the auroral event of 1872.
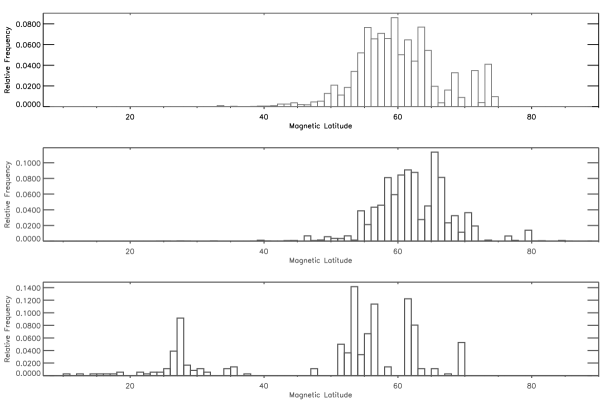
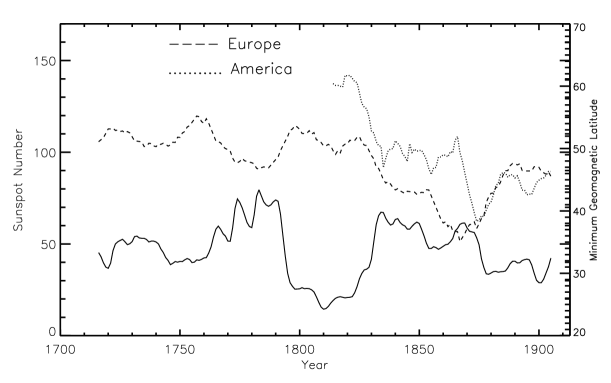
Figure \irefGlMagLatMin shows the temporal variation of the yearly minimum geomagnetic latitude with the annual averaged sunspot number. The anti-correlation is similar for Europe and North America (-0.36 vs –0.32), but the level of significance is very low, especially for the American data. We must notice that the minimum geomagnetic latitude shows a decrease during the first half of the 19 century, most clearly visible for the American data.
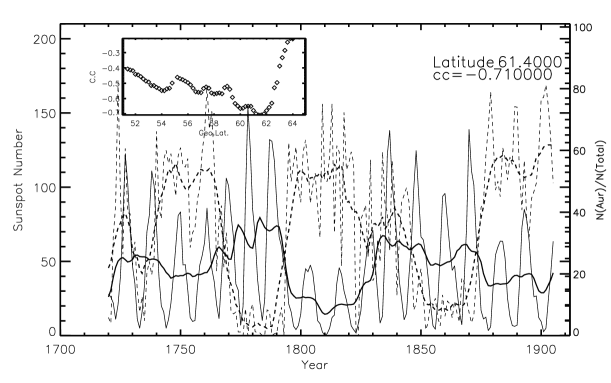
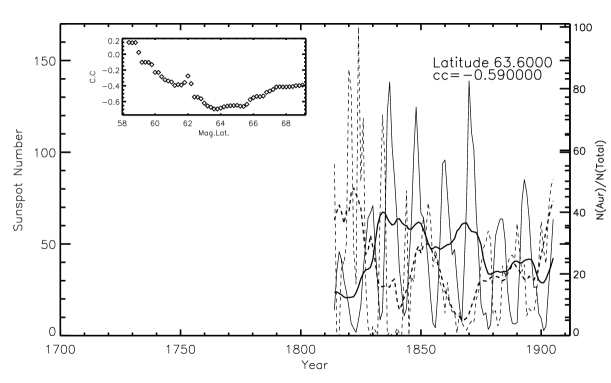
For the yearly number of aurorae above a critical magnetic latitude (Figures \irefEurMagLatcrit and \irefAmMagLatcrit), the best anti-correlation is found for a magnetic latitude of around 61.4 and 63.4 for the European and American samples, respectively (see the insets in the figures for the variation of the correlation coefficients with the geomagnetic latitude). As expected from previous results, the level of significance for this correlation was better for the Europe (p 0.005) than for the North America sample (p 0.05).
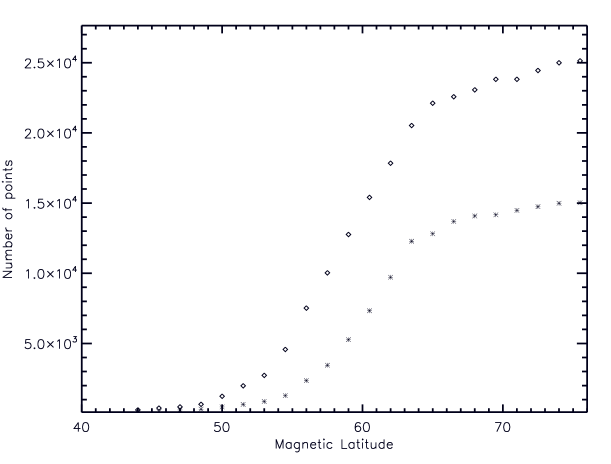
We repeated the calculation of the cumulative number of auroral events, but now for the geomagnetic latitudes. The results (Figure \irefGloMagLatCum) show the behaviour to be similar for the two continents, although there is a lack of high geomagnetic latitudes for the North American sample (Canada and Alaska). Liritzis and Petropoulos (1987) already noted a marked change at a geomagnetic latitude of 57 – 58 degrees.
5 Conclusions
We have studied the broad statistical properties (spatial and temporal variation) of several catalogues and reports of auroral observations during the 18th and 19th centuries. To this end, we assigned geographic and geomagnetic latitudes to more than 80 000 auroral observations. For the analysis, we divided the Northern Hemisphere into three large continental masses corresponding to Europe, North America, and Asia.
The sample presented numerous spatial and temporal gaps, mainly evident in the North American data due to the progressive European occupation of large areas outside the original New England states. It was clear that further investigation into low-latitude auroral events is important. The historical auroral records investigated can serve as a proxy for reconstructing the long-term variability of the heliosphere.
To gain insight into the broad pattern of the spatial and temporal variations of auroral observations in the Northern Hemisphere, an 11-year smoothing procedure was applied to the data to enhance this long-term component.
We suggested and applied a method to separate the contribution of the different solar sources of auroral events, which was based on the different slopes of the cumulative numbers of auroral events per latitude bin. The low-latitude segment mainly corresponded to strong CMEs taking place around the solar cycle maxima. The middle segment corresponded to standard CMEs, and the high-latitude segment to high-speed streams of solar wind originating from coronal holes. The limit between the last two sources is in a narrow belt between 61 and 64 degrees of geomagnetic latitude. One must bear in mind that the geoeffectiveness of such transitory solar events depends critically on the level of the IMF and its orientation with respect to the Earth’s magnetosphere.
The spatial distribution of the available data is clearly determined by the populations living at high-latitude sites which were clearly greater in Europe than in North America. The same may apply to the low-latitude sites in the two continents. This masks the expected better correlation of the auroral parameters with the geomagnetic than with the geographic latitude.
The existence of several minima was clearly seen. In addition to the Silverman and Dalton episodes, the discontinuity at the beginning of the 20th century merits special attention. This topic will be investigated in detail in a forthcoming article.
Acknowledgements
The authors wish to express their gratitude to Sam Silverman who has undertaken the immense task of collecting thousands of auroral reports around the world and making them available to the scientific community. Some well-known auroral catalogues (Fritz, Angot) used for this study are from Jack Eddy’s Compilation of Auroral Catalogues and were obtained from the Research Data Archive (RDA), which is maintained by the Computational and Information Systems Laboratory (CISL) at the National Center for Atmospheric Research (NCAR). NCAR is sponsored by the National Science Foundation (NSF). The original data are available from the RDA (dss.ucar.edu) with dataset number ds836.0. Support from the Junta de Extremadura (Research Group Grant No. GR10131) and the Ministerio de Economía y Competitividad of the Spanish Government (AYA2011-25945) is also gratefully acknowledged. Finally, we thank an anonymous referee for useful suggestions.
References
- [] Angot, A.: 1897, The Aurora Borealis. D. Appleton & Co., New York. Anonymous: 1883, The periodicity of aurorae. The Observatory 6, 116.
- [] Aragonès Valls, E., Orgaz Gargallo, J.: 2010, Treb. Mus. Geol. Barcelona 17, 45.
- [] Basurah, H.M.: 2004, Solar Phys. 225, 209.
- [] Bernard, F.: 1837, Am. J. Sci. Arts 34, 267.
- [] Bravo, S., Otaola, J.A.: 1990, Annales Geophysicae 8, 315.
- [] Broughton, P.: 2002, J. Geophys. Res. 107, 1152.
- [] Buforn, E., Pro, C., Udías, A.: 2012, Solved Problems in Geophysics , Cambridge University Press.
- [] Chapman, S.: 1957, Ann. IGY 4 386.
- [] Chernosky, E.J.: 1966, J. Geophys. Res. 71, 965.
- [] Dalton, J.: 1873, Meteorological Observations and Essays.
- [] Du, Z.: 2012, Solar Phys. 278, 203.
- [] Eather, R.: 1980, Majestic Lights: The Aurora in Science, History and the Arts. American Geophysical Union.
- [] Feldstein, Y.I.: 1986, EOS Trans. AGU 67, 761.
- [] Feyman, J., Silverman, S.: 1980, J. Geophys. Res. 85, A6, 2991.
- [] Feyman, J., Gabriel, S.B.: 1990, Solar Phys. 127, 393.
- [] Fritz, H.: 1873, Verzeichniss Beobachteter Polarlichter, C. Gerold’s Sohn.
- [] Georgieva, K., Kirov, B., Gavruseva, E.: 1967, Phys. Chem. Earth 31, 81.
- [] Gnevyshev, M.N.: 1967, Solar Physics,1, 107.
- [] Gonzalez, W.D., Tsuratani, B.T., Lepping, R.P., Schwenn, R.: 2002, J. Atmos. Solar-Terr. Phys. 64, 173.
- [] Greeley: 1881, Chronological List of Auroras observed from 1870 to 1879, Prof. Pap. of the Signal Service, US Government Printing Office.
- [] Groubé, W., Brigonnet, R., Geneslay, E., Moreau, J., Rebuffat, L., Saugère, J.: 2006, L’Astronomie 71, 103.
- [] Green, J.L., Boardsen, S.: 2006, Adv. Space Res. 38, 130.
- [] Greenwood, G.: 1872, Nature 5, 400.
- [] Halley, E.: 1716, Phil. Trans. Roy. Soc. London 24, 406.
- [] Harrison, G.: 2005, Astron. Geophys. 46, 4.31.
- [] Hecht, J. H., Mulligan, T., Strickland, D. J., Kochenash, A. J., Murayama, Y., Tanaka, Y. M., et al.: 2008, J. Geophys. Res. 113, A013010.
- [] Jackson, A., Jonkers, A.R.T., Walker, M.R.: 2000, Phil. Trans. Roy. Soc. London A 358, 957.
- [] Jones, H.S.: 1955, Greenwich Observatory Sunspot and Geomagnetic Storm Data, Her Majesty’s Stationery Office.
- [] Kimmball, D.S.: 1960, Scientific Report No. 6, Geophysical Institute, University of Alaska.
- [] Krivský, L.: 1996, Publ. Astron. Inst. Acad. Sci. Czech Republic 75.
- [] Krivský, L., Pemjl, K.: 1988, Publ. Astron. Inst. Czechosl. Acad. Sci. 84.
- [] Kumar, P., Manoharan, P.K., Uddin, W.: 2010, Geomag. Aeron. 49, 961.
- [] Lang, A.S.: 1849, Mon. Not. Roy. Astron. Soc. 9, 148.
- [] Lee, E.H., Ahn, Y.S., Yang, H.J., Chen, K.Y.: 2004, Solar Phys. 224, 373.
- [] Legrand, J.P., Simon, P.A.: 1981, Solar Phys. 70, 173.
- [] Legrand, J.P., Simon, P.A.: 1987, Annales Geophysicae 5, 161.
- [] Le Mouël J.L., Blanter, E., Shnirman, M., Courtillot, V.: 2012, J. Geophys. Res. 117, A09103.
- [] Liritzis, Y., Petropoulos,B.: 1987, Earth, Moon, Plan. 39, 75
- [] Livesey, R.L.: 1991, J. British Astron. Association 101, 233.
- [] Lockwood, M., Stamper, R., Wild, M.N.: 1999, Nature 399, 437.
- [] Lockwood, M.: 2003, J. Geophys. Res. 108, 1128.
- [] Loomis, E.: 1860, Am. J. Sci. 2nd Ser. 30, 79.
- [] Loomis, E.: 1861, Am. J. Sci. 2nd Ser. 32, 71.
- [] Love, J.J.: 2011, Ann. Geophysicae 29, 1365.
- [] Lovering, J.: 1866, Mem. Am. Acad. Arts Science 10, 9.
- [] Lueders, F.G.T: 1984, Publ. Washburn Obs. 12, 20.
- [] Mairan, J.J.: 1733, Traité physique et historique de lé Aurore Boréale, Impremerie Royale.
- [] Mendillo, M., Keady, J.: 1976, EOS Trans. AGU 57, 485.
- [] Milan, S.E., Hutchinson, J., Boakes, P.D., Hubert, B.: 2009, Ann. Geophys. 27, 2913.
- [] Moritz, H.: 1980, J. Geodesy 74, 128.
- [] Moss, K., Stauning, P.: 2012, History of Geo- Spa. Sciences 3, 53.
- [] Mursula, K., Martini, D., Karinen, A.: 2004, Solar Phys. 224, 85.
- [] Nakazawa, Y., Okada, T., Shiokawa, K.: 2004, Earth Planets Space. 56, e41.
- [] Nevanlinna, H., Kataja, E.: 1993, Geophys. Res. Lett. 20, 2703.
- [] Ouattara, F., Amory-Mazaudier, C., Menvielle, M., Simon, P., Legrand, J.P.: 2009, Ann. Geophys. 27, 2045.
- [] Rassoul, H. K., Rohrbaugh, R.P., Tinsley, B.A., Slater, D.W.: 1993, J. Geophys. Res. 98, A5, 7695.
- [] Reiff, P., Luhmann, J.G.: 1986, In Solar-wind magnetosphere coupling, Y. Kamide (ed.), pp.453-476, D. Reidel.
- [] Réthly, A., Berkes, Z: 1963, In Nordlicht-Beobachtungen in Ungarn, Budapest, Ungarische Akademie der Wissenschaften.
- [] Roach, F.E., Moore, J.G., Bruner, E.C., Cronin, H., Silverman, S.M.: 1960, J. Geophys. Res. 65, 3575.
- [] Robbrecht, E., Berghmans, D., Van der Linden, R.A.M.: 2009 Astrophys. J., 691, 1222.
- [] Rouillard, A.P., Lockwood, M., Finch, I.: 2007, J. Geophys. Res. 112, A105103.
- [] Rubenson, R.: 1882, Catalogue des aurores boréales observées en Suède, Kl. Sven. Vetenskapsakad. Handl. 18, 1.
- [] Schröder, W.: 1966, Gerl. Beitr. Geophys. 75, 436.
- [] Schröder, W.: 1980, Planet. and Space Science 46, 461.
- [] Schröder, W., Shefov, N.N., Treder, H.J.: 2004, Ann. Geophysicae 22, 2273.
- [] Sheeley, N.R., Howard, R.A.: 1980, Solar Phys. 67, 189.
- [] Silverman, S.: 1992, Rev. Geophys. 30, 333.
- [] Silverman, S.: 1995, J. Atmos. Solar-Terr. Phys. 57, 673.
- [] Silverman, S.: 2003, J. Geophys. Res. 108, 8011.
- [] Silverman, S.: 2008, J. Atmos. Solar-Terr. Phys. 70, 1301.
- [] Silverman, S., Cliver, E.W.: 2001, J. Atmos. Solar-Terr. Phys. 63, 523.
- [] Singh, A.K., Sinha, A.K., Rawat, R., Jayashree, B., Pathan, B.M., Dhar, A.: 2012, Adv. Space Res. 50, 1512.
- [] Siscoe, G.L.: 1980, Rev. Geophys. 18, 647.
- [] Solanki, S., Schüssler, M., Fligge, M.: 2002, Astron. Astrophys. 383, 706.
- [] Solanki, S., Usoskin, I.G., Kromer, B., Schüssler, M., Beer, J.: 2004, Nature 431, 1084.
- [] Srivistava, N.J.: 2005, Ann. Geophys. 23, 2969.
- [] Stauning, P.: 2011, Hist. Geo. Space Sciences 2, 1.
- [] Stacey, F.D.: 1992, Physics of the Earth, third edition,Brookfield Press.
- [] Stone, E.J.: 1872, Nature 5, 443.
- [] Svalgaard, L., Cliver, E.W., Le Sager, P.: 2004, Adv. Space Res., 34, 236.
- [] Taylor, C.J.: 1981, Artic 34, 376.
- [] Tinsley, B.A., Rohrbaugh, R., Rassoul, H., Sahai, Y., Teixeira, N.R.: 1986, J. Geophys. Res. 91, 11257.
- [] Traversi, R., Usoskin, I.G., Solanki, S.K., Becagli, S., Frezzetti, M., Severi, M., Stenni, B., Udisti, R.: 2012, Solar Phys. 280, 237.
- [] Tromholt, S.: 1898, Catalogue der in Norwegen bis Juni 1872 beobachteter Nordlichter, Jacob Dybwad Forlag.
- [] Tsurutani, B.T., Gonzalez, W.D., Gonzalez, A.L.C., Guarnieri, F.L., Gopalswamy, N., Grande, M., Kamide, Y., Kasahara, Y., Lu, G., Mann, I., McPherron, R., Soraas, F. and Vasyliunas, V.: 2006 J. Geophys. Res., 111, A10, 10.1029/2005JA011273
- [] Usoskin, I.G., Mursula, K., Solanki, S.K., Schüssler, M., Kovaltsov, G.A.: 2002, J. Geophys. Res. 107, 1374.
- [] Usoskin, I.G., Kovaltsov, G.A.: 2012, Astrophys. J. 757, 92.
- [] Vallance Jones, A.: 1992, Can. J. Phys. 70, 479.
- [] Vaquero, J. M., Gallego, M.C., Garcia, J.A.: 2003, J. Atmos. Solar-Terr. Phys. 65, 677.
- [] Vaquero, J. M., Trigo, R.M.: 2005, Solar Phys. 231, 157.
- [] Vaquero, J. M., Trigo, R., Gallego, M.C.: 2007, Earth, Planets, Space 59, e49.
- [] Vaquero, J. M., Valente, M.A., Trigo, R.M., Ribeiro, P., Gallego, M.C.: 2008, J. Geophys. Res. 113, A08230.
- [] Vaquero, J. M., Gallego, M.C., Barriendos, M., Rama, E., Sánchez Lorenzo, A.: 2010, Adv. Space Res. 45, 1388.
- [] Vaquero, J.M., Vázquez, M.:2009, The Sun recorded through History, Springer.
- [] Vázquez, M., Vaquero, J.M., Curto, J.J.: 2006, Solar Phys. 238, 405. 10.1007/s11207-006-0194-2
- [] Vázquez, M., Vaquero, J.M.: 2010, Solar Phys. 267, 431. 10.1007/s11207-010-9650-0
- [] Vennerstrn, S., Friis-Christensen, E.: 1996, J. Geophys. Res. 101, 24727.
- [] Verbanac, S., Vrsnak,B., Veronig, A., Temmer,M.: 2011, Astron. Astrophys. 526, A20.
- [] Visser, S.W.: 1942, Catalogue of Dutch Aurorae 1728 - 1940 (rda.ucar.edu/datasets/ds836.0/)
- [] Webb, D.F., Howard, R.A.: 1994, J. Geophys. Res. 99, 4201.
- [] Willis, M., Stephenson, F.R., Fang, H.: 2007, Ann. Geophysicae 25, 417.
- [] Yau, K.K.C., Stephenson, F.R., Willis, D.M.: 1995, A catalogue of auroral observations from China, Korea and Japan (193 B.C. - A.D. 1770), Rutherford Appleton Lab.