The Binary White Dwarf LHS 323611affiliation: Some of the data presented herein were obtained at the W.M. Keck Observatory, which is operated as a scientific partnership among the California Institute of Technology, the University of California, and the National Aeronautics and Space Administration. The Observatory was made possible by the generous financial support of the W.M. Keck Foundation.
Abstract
The white dwarf LHS 3236 (WD1639+153) is shown to be a double-degenerate binary, with each component having a high mass. Astrometry at the U.S. Naval Observatory gives a parallax and distance of 30.86 0.25 pc and a tangential velocity of 98 km s-1, and reveals binary orbital motion. The orbital parameters are determined from astrometry of the photocenter over more than three orbits of the 4.0-year period. High-resolution imaging at the Keck Observatory resolves the pair with a separation of 31 and 124 mas at two epochs. Optical and near-IR photometry give a set of possible binary components. Consistency of all data indicates that the binary is a pair of DA stars with temperatures near 8000 and 7400 K and with masses of 0.93 and 0.91 ; also possible, is a DA primary and a helium DC secondary with temperatures near 8800 and 6000 K and with masses of 0.98 and 0.69 . In either case, the cooling ages of the stars are 3 Gyr and the total ages are 4 Gyr. The combined mass of the binary (1.66–1.84 ) is well above the Chandrasekhar limit; however, the timescale for coalescence is long.
1 Introduction
A substantial fraction of white dwarfs have binary companions, often detected as resolved stars with common proper motion. Deep imaging can find faint companions of white dwarfs, and high-resolution images can probe toward small separations; HST has been used this way at visible wavelengths (Farihi et al., 2010). Companions have also been detected as unresolved stars with redder colors that add to the composite spectral energy distribution at red and infrared wavelengths. Infrared imaging from the UKIDSS survey is identifying the excess flux from unresolved low-mass companions (Steele et al., 2011); similarly, spectroscopy from SDSS reveals excess red flux from low-mass companions (Silvestri et al., 2006). Some companions have been detected through radial velocity variations, despite the difficulty posed by pressure-broadening of spectral features in white dwarf spectra. Many companions found by velocity variability are white dwarfs, but some are low-mass main sequence companions from the SPY project (Napiwotzki et al., 2001) and from the ELM survey (Brown et al., 2012). Some double-white dwarfs are detected by the spectral energy distribution being too bright, thus causing the distance derived from a spectroscopic analysis to be inconsistent with the measured trigonometric parallax. In this paper, high-precision astrometry reveals orbital motion of a previously unknown companion around the white dwarf LHS 3236, and adaptive optics imaging shows that the binary companion is also a white dwarf. In a second paper, similar data will be used to detect a companion to another white dwarf, G122-31.
Astrometric data are sensitive to detecting companions of low mass such as brown dwarfs or even massive planets under favorable circumstances, a potential advantage over radial-velocity detection of planets around white dwarfs because of the difficulty of measuring precise radial velocities of white dwarfs mentioned above. When a perturbation is detected, all of the orbital elements can be determined, including the inclination, and there is no uncertainty of in masses determined from the astrometric orbit as there is from a radial velocity orbit. One potential complication for astrometric data is that the orbit of the photocenter is measured, so if the companion contributes significant light to the photocenter, then that contribution must be determined and accounted for in order to determine the true orbits and masses of the components.
The observations used in this paper were taken as part of a program at the U.S. Naval Observatory to measure trigonometric parallaxes, distances, and luminosities of nearby stars. Of the approximately 200 white dwarfs with accurate parallaxes observed with CCD cameras at the Naval Observatory over the last 20 years (Dahn et al. 2013, in preparation), only LHS 3236 and G122-31 have shown believable perturbations, and the companions in both systems are found to be white dwarfs. Nearly a dozen red dwarfs and subdwarfs observed in this program have perturbations, some with considerably smaller orbital amplitudes than these two white dwarfs. Therefore, the lack of close brown dwarf companions of white dwarfs observed in this program may be a real effect.
2 Observations
LHS 3236 (WD1639+153, PG1639+153, EG 196, G138-56) is a well-known DA white dwarf, but as yet without a useful parallax measurement. Its parallax and luminosity would be particularly useful to know because this star enters the sample of white dwarfs with proper motions larger than 0.6′′ yr-1 (Luyten 1976; Harris et al. 2001), important for determining the luminosity function of nearby white dwarfs. A spectroscopic analysis (Bergeron et al., 1997) gave = 7450 360 K and = 13.29 assuming log = 8.00, and implying a distance of 30 pc. Two more recent spectroscopic analyses of DA white dwarfs include LHS 3236: a study of white dwarfs in the Palomar-Green survey (Liebert et al., 2005) yielded = 7480 K, log = 8.42 0.06, = 13.91, and a high mass of 0.87 0.04 , implying a distance of 22 pc; a survey of bright DA white dwarfs (Gianninas, Bergeron, & Ruiz, 2011) found = 7550 K, log = 8.52 0.07, = 14.10, and a mass of 0.93 0.04 , implying a distance of 21 pc. The latter survey identified several objects with composite spectra, but did not detect LHS 3236 as being composite or otherwise unusual. A spectrum with high resolution (Zuckerman et al., 2003) found = 7240 K, assuming log = 8.00, with no calcium or other metal lines detected. A companion tentatively identified (Wachter et al., 2003) using the 2MASS Second Incremental Data Release was based on a magnitude that is too bright and is not substantiated in the final 2MASS Point Source Catalog or in the independent photometry presented below.
New observations presented in the present paper include astrometry (including its parallax, proper motion, and the discovery of perturbation due to binary orbital motion), photometry, and a measurement of the separation and relative magnitudes of the two binary components. The combination of these data allow a nearly complete determination of properties of the components, with the result that both components are massive white dwarfs. The following subsections describe the observations.
2.1 Astrometric and Photometric Results
The astrometry was carried out with the 1.55 m Strand Astrometric Reflector at the Flagstaff Station of the U.S. Naval Observatory using the Tektronix 2048x2048 CCD Camera. The observational and reduction procedures are those described by Dahn et al. (2002; 2008). The wide–R filter was used. Corrections to the astrometry for differential color refraction for observations taken slightly away from the meridian were derived from the colors of the parallax star and the reference stars, as described in Monet et al. (1992). The correction from relative to absolute parallax was derived from photometric parallaxes of the individual references stars, using MV versus relations calibrated with stars with large trigonometric parallaxes; this procedure is described fully in a separate paper (Harris et al. 2013, in preparation).
Photometry with Johnson–Cousins filters was obtained using the USNO 1 m telescope on three nights, and transformed to standard magnitudes using Landolt (1992) standard fields to determine nightly extinction and color terms. Photometry in taken on one night is also available (Bergeron et al., 1997) and is in excellent agreement with our results. Photometry in bands was obtained on one night with the United Kingdom Infrared Telescope on Mauna Kea, and transformed to the CIT standard system. Magnitudes in are also available from the 2MASS Point Source Catalog; however, the faintness of LHS 3236 at infrared wavelengths makes the 2MASS errors larger than are desirable (0.04 at to 0.13 at ), so the 2MASS data are not included here. The combination of and colors gives no indication of a composite system of two stars with different temperatures. In fact the observed K magnitude is slightly fainter than the spectral energy distribution predicts for a normal DA white dwarf based on the other photometry. However, two stars with slightly different temperatures are not ruled out, as is discussed below.
Astrometric observations of LHS 3236 began in early 1998, and in 2001 residuals from the solution for parallax and proper motion began showing a significant deviation indicating that this object is an unresolved binary. To date, 376 acceptable observations have been obtained spanning an epoch range of 14.3 years and more than three full periods. These data permit solutions for the photocentric orbital elements as well as the parallax and proper motion for this binary system. As described for another binary, LSR161000 (Dahn et al. 2008), an iterative analysis has been adopted, first solving for parallax and proper motion, then taking the residuals and solving for the orbital motion of the center of light about the center of mass. In this paper (unlike for LSR161000), we have used the data from the resolved imaging described below (the position angle and separation) as additional constraints in the fit for orbital motion. These preliminary orbital elements were then used to correct the original astrometry and repeat the solution for parallax and proper motion and then for orbital motion. This iterative process was repeated to convergence. Table 1 gives the basic astrometric and photometric results. Plots of the orbital motion (the residuals from the final parallax solution) are shown in Figure 1 and discussed in Section 4.
Without further information, the orbital solutions from our astrometry alone are limited in accuracy because the orbital motion is not far from the noise – the observed full amplitude of orbital motion is 7 mas on the sky, while the noise of a single observation is 3 mas. Furthermore, the true location of the center of mass is unknown, requiring a solution for a total of 12 free parameters.111 Five free parameters come from the position of the unknown center of mass (RA and Dec), the proper motion (RA and Dec), and the parallax. Seven more free parameters come from the orbital elements of the binary (P, a, e, i, , , and To). If based solely on the unresolved astrometric data in Fig. 1, the possible orbits include a wide range of orbital parameters and characteristics of the companion. For example, a massive white dwarf and a faint substellar companion would be allowed. Without additional data, the fractional contribution of the companion to the combined light is very uncertain, and therefore the size of the true orbit is poorly known. With the intention to further constrain the masses of the white dwarf and its companion and the orbital parameters, we acquired the high-resolution imaging described in the next subsection.
2.2 High Resolution Imaging
We observed LHS 3236 on UT 2008 April 28 and again on UT 2010 May 1 using the laser guide star adaptive optics (LGS AO) system at the Keck II Telescope on Mauna Kea, Hawaii (Wizinowich et al., 2006; van Dam et al., 2006). The LGS provided the wavefront reference source for AO correction, with the exception of tip-tilt motion. The LGS brightness, as measured by the flux incident on the AO wavefront sensor, was equivalent to a –9.9 mag star. The tip-tilt correction and quasi-static changes in the image of the LGS as seen by the wavefront sensor were measured contemporaneously by a second, lower bandwidth wavefront sensor monitoring LHS 3236, which saw the equivalent of a –15.9 mag star.
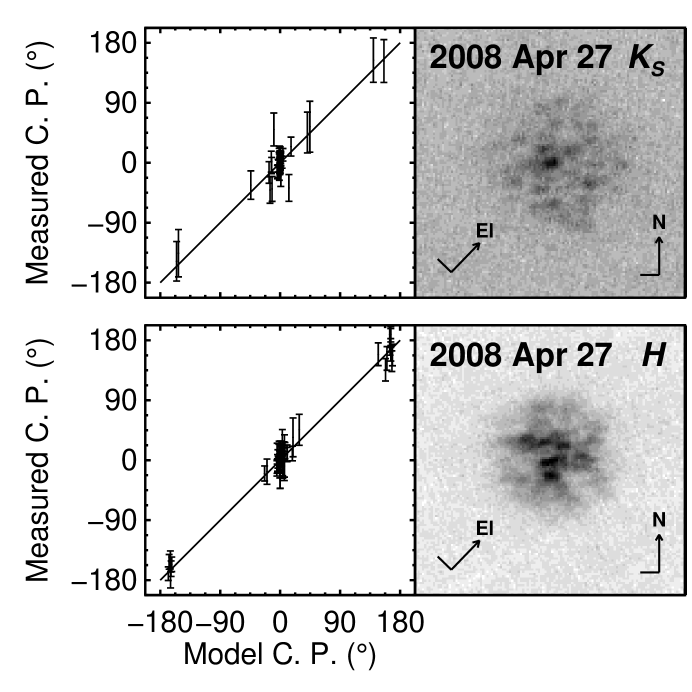
On 2008 April 28, data were obtained with the 9-hole non-redundant aperture mask installed in the filter wheel of the the facility near-infrared camera NIRC2 (Tuthill et al., 2006). The data were taken in two dither positions separated by 35, with four to six 50 s exposures taken at each dither position. We used the narrow field-of-view camera and obtained data in - and -bands. Typical interferograms from our observations are shown in Figure 2. The pipeline used to reduce the aperture masking data was similar to that used in previous papers containing NIRC2 masking data (Ireland et al., 2008; Kraus et al., 2008; Ireland & Kraus, 2008), except that no comparable single star was observed in -band for calibration of the closure phases or squared visibilities. Thus we chose to fit only the -band closure phases with a binary model, whereas for the -band data we fit the calibrated closure phases and squared visibilities. For the model fit, the closure phase uncertainties were initially approximated by the standard error of the mean calculated from the scatter among individual exposures. The uncertainties were subsequently increased by adding a calibration error in quadrature so that the resulting reduced of the fit was 1.0. Although we fit all 84 closure phases from the 9-hole mask, only 28 of these are formally independent. To correctly account for this non-diagonal covariance matrix in our binary fitting, we scaled the errors in the least-squares fit to the data by . This process has been validated both by a comparison to fits using full covariance matrices (Kraus et al., 2008) and by orbit fits using mixed data that resulted in a reduced consistent with unity, where the orbit fit had many degrees of freedom (e.g., Martinache et al., 2007).
The closure phases resulting from our binary model fits to the data are shown in Figure 2. Because LHS 3236 is a nearly equal magnitude binary, it predominantly has closure phases close to 0∘ or 180∘. In 2008, the binary is clearly detected in both filters, though the -band data have more closure phases in which the binary is detected, and thus the binary parameters are much better determined from the -band data. They give a separation of 30.50.2 mas, a position angle of 276.10.8∘, and a flux ratio of 0.0900.016 mag. This implies that the binary separation is near the resolution limit in band, where almost all the information is carried by a single baseline, and thus the formal errors may be underestimated. In spite of this, we find a binary solution in band with reasonably consistent separation and P.A. ( mas and ) and a flux ratio of mag).
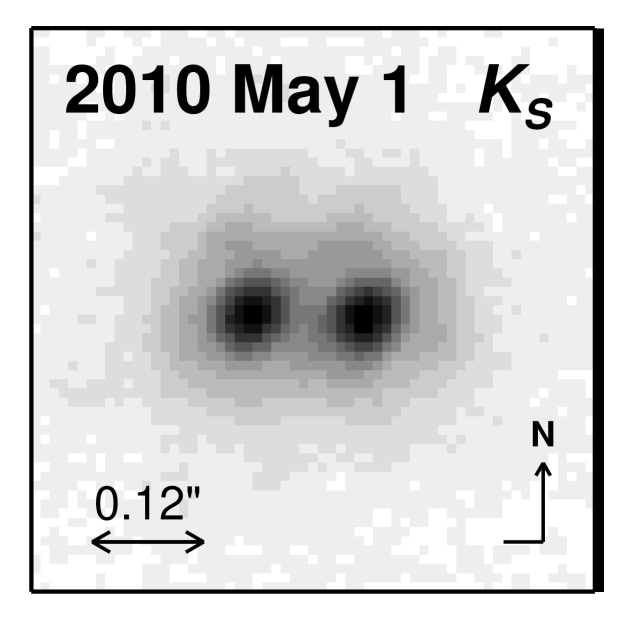
On 2010 May 1, we obtained direct imaging at band without the aperture mask. At this epoch the binary separation was actually expected to be much wider and thus near the outer limits of the masking field of view of 125 /mas. To reduce and analyze our images we used the same methods as in our previous work (Dupuy et al., 2009a, b, 2010), fitting three-component elliptical Gaussians to measure binary parameters. Figure 3 shows one of our four -band images, from which we determined a binary separation of mas, a P.A. of , and a flux ratio of mag. The flux ratio agrees with our earlier masking data, and in the following analysis we adopt the -band flux ratio from imaging since its uncertainty is expected to be more reliable than for the earlier -band masking data. Note that in all of the above analysis we have used the Ghez et al. (2008) calibration of NIRC2, with a pixel scale of mas/pixel and orientation of the -axis of .
3 Photometric and Spectroscopic Analysis
The parallax in Table 1 gives a distance of 30.86 0.25 pc, larger than the spectroscopic distance of 21-22 pc (Liebert et al., 2005; Gianninas, Bergeron, & Ruiz, 2011), and therefore could allow a nearly normal mass for LHS 3236 rather than the high mass found in that study. Surprisingly, however, the nearly equal magnitudes of the two components requires that LHS 3236 be a double-degenerate binary, eliminating the possibility of a substellar companion. Furthermore, because each component is fainter than the combined light by 0.7-0.8 mag at and , then both components must be more massive than normal white dwarfs.
The photometry of LHS 3236 plus the parallax given in Table 1 give the absolute magnitudes in each filter of the combined light of the two components of the binary. With the additional information from Sec. 2.2 that the two components differ by 0.09 mag at and 0.01 mag at , we can draw conclusions about the two components from the photometry and parallax alone, under certain assumptions.
The simplest possibility is that the two components are DA white dwarfs with the same temperature. Under this assumption, a fit of the photometry to the models of DA white dwarfs from Bergeron et al. (1995)222 The model colors are taken from the tables at www.astro.umontreal.ca/bergeron/CoolingModels. gives a temperature of 7700 60 K. The deconvolved component absolute magnitudes are given in the first two lines of Table 2. The surface gravities and masses of each component also can be determined from the Bergeron models, and are given in Table 2. Finally, using these masses and magnitudes, the dilution of the semi-major axis of the true relative orbit to the smaller observed semi-major axis of the photocenter orbit can be determined from
where
is the fractional mass of the secondary, and
is the fractional light of the secondary in the -band astrometric filter. These values are also given in Table 2.
The photometry does not require that the two stars have the same temperature, and two additional possible combinations of DA+DA components are given in Table 2, with an increasing temperature difference between the two stars. The combined light of the pairs of model DA stars given in Table 2 agrees with observed combined-light magnitudes from Table 1 within 0.03 mag in each filter. These three pairs in Table 2 are examples drawn from an infinite set of possible pairs with a continuous distribution of possible temperature differences: for each chosen example, the absolute magnitudes and masses of both stars given in the table are the only possibilities (within a small range allowed by observational errors discussed below) that reproduce the observed combined-light magnitudes and the observed H-band magnitude difference. However, in Section 4, we find that the first pair with equal-temperature stars, and other pairs with larger temperature differences, are not possible for dynamical reasons.
It can be seen in Table 2 that all the DA+DA binaries have log close to 8.5 and a mass close to 0.9 M☉ for each component. This gravity is in excellent agreement with the spectroscopic determinations of 8.42 and 8.52 (Liebert et al., 2005; Gianninas, Bergeron, & Ruiz, 2011) of the combined light. The temperatures near 7700 K are slightly warmer than the spectroscopic values 7480 and 7550 K, primarily because the JHK photometry (which was not available to Liebert et al. or Gianninas et al.) shows that the pair is fainter than would be the case at the cooler temperature.
The photometry also allows the fainter component of the binary to be a DB or DC (helium atmosphere) white dwarf. For the cool temperature that any helium atmosphere companion must have, no helium lines would be visible, so we will refer to these as DA+DC pairs. The second half of Table 2 gives three examples of possible DA+DC pairs with an increasing difference in temperature between the two stars. The DA+DC pairs in Table 2 agree with the photometry in Table 1 within 0.02 mag in each filter. For all of these DA+DC pairs, the Balmer absorption lines from the DA star would be made weaker in the combined-light spectrum by the added continuum of the DC star. For these combinations, the DA can have a warmer temperature than for the DA+DA pairs. At temperatures near 9000 K, the strong Balmer absorption lines from the DA will be diluted by the DC.
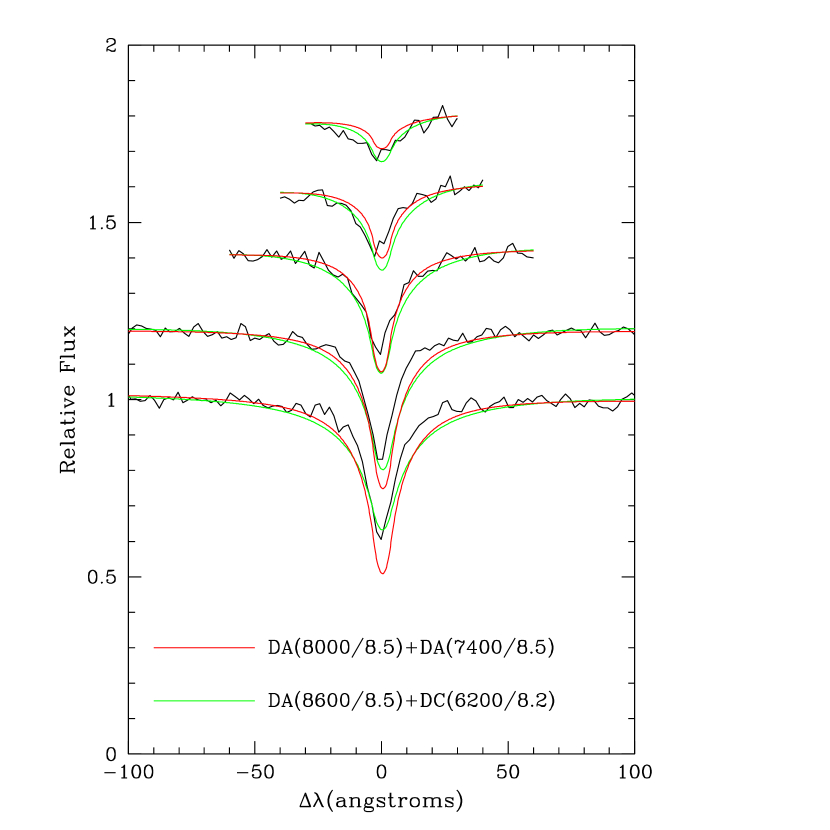
The spectrum of LHS 3236 from Gianninas, Bergeron, & Ruiz (2011) (kindly made available to us by Bergeron), is shown in Figure 4, compared with two composite spectra of our DA+DA and DA+DC pairs, based on model spectra from Koester (2010) (kindly made available to us by Koester). Both pairs are consistent with the observed spectrum, although the DA+DC pair tends to have all the Balmer lines fit better by the models, whereas the models of the DA+DA pair show H stronger than observed and H weaker. (The DA+DC pairs from Table 2 with a hotter DA component at 8800 or 9000 K do not fit the observed spectrum as well, because the high Balmer lines become too strong in those models.) The spectrum observed by Zuckerman et al. (2003)333 This spectrum was taken on 1999 Apr 19 UT. The orbital period of 4.03 yr implies the binary was then at the same orbital phase as in July 2011, and the predicted radial velocity curves would have a velocity difference of only 8 km s-1. Therefore, the spectrum could not have shown resolved Balmer lines from the two stars. , with higher spectral resolution, suggests the same conclusion, because the high Balmer lines appear strong in the observed spectrum. However, the lack of flux calibration for the archived spectrum affects the high Balmer lines H and H and makes this conclusion less definitive.
The conclusion of this section is that pairs of DA+DA white dwarfs with masses near 0.9 M☉ each are consistent with the available photometry, spectra, and parallax, and the combined mass is 1.84 0.03 M☉ for two DA components. Alternatively, pairs of DA+DC white dwarfs are also possible with masses near 1.0 M☉ for the DA component and 0.7 M☉ for the DC component, and with a combined mass of 1.68 0.05 M☉. The next section discusses the observed orbit to look for consistency with this photometric analysis.
4 Dynamical Analysis
The orbital motion of the photocenter shown in Fig. 1, with the separation and position angle from the high-resolution imaging in Section 2.2, is best fit by the curve shown in Fig. 1. The orbit projected onto the plane of the sky is shown in Fig. 5, with the two observed positions of the secondary star marked. The orbital elements of the photocenter are given in Table 3.
The masses from Table 2 and the period from Table 3 can be used with Kepler’s third law
to calculate the semi-major axis = of the relative orbit. The result is 3.10 or 3.00 AU using the masses for DA+DA or DA+DC pairs, respectively. The semi-major axis of the photocenter orbit in Table 3 is 4.37 mas, or 0.135 AU. These require the dilution factor of the photocenter amplitude to be 23.0 or 22.2, respectively. This large dilution factor is consistent with the observed motion of the resolved secondary star between 2008 and 2010 (31 mas west in 2008 to 124 mas east in 2010) compared to the observed motion of the photocenter (roughly 1.4 mas east to 5.4 mas west). The temperatures of the pairs of white dwarfs given in Table 2 are chosen to satisfy this dilution factor (except the first pair of equal-temperature DA stars, shown in Table 2 as an example of a pair not consistent with this constraint). A DA+DA binary, with a combined mass of 1.84 M☉ from Table 2, agrees with the orbital parameters in Table 3, the dilution factor calculated in Table 2, and the observed separations plotted in Fig. 5. A DA+DC binary, with a combined mass of 1.68 M☉ from Table 2, is possible, but must have a photocenter orbit with smaller . The fits to the data in Figures 1 and 5 tend to give slightly better fits with larger (usually accompanied by larger eccentricity), and slightly poorer fits with as small as 3.00 AU. Therefore, these data indicate that a DA+DA binary is most likely, but a DA+DC binary is not ruled out. The spectroscopic data (Sec. 3) suggested a DA+DC binary is more likely, and we conclude that either possibility is acceptable.
The error in the combined mass has contributions from the errors in the parallax and photometry and the uncertainty in the temperatures of the two stars, but the largest uncertainty is DA or DC type of the secondary component. In either case, the combined mass is well above the Chandrasekhar limit. With a relative semi-major axis of 3.1 AU, the separation between the components at periastron is 0.8 AU. This separation is large enough that the timescale to reduce the size of the orbit through gravitational radiation and lead toward coalescence and a supernova explosion is longer than the age of the universe.
Some insight into the evolution of the system can be obtained from the white dwarf cooling age of each star. The models of DA and DC white dwarfs (Bergeron et al., 1995) used for Table 2 give a cooling age near 3.0 Gyr for each component, and nearly the same for a DA or DC secondary. Using the initial-final mass relation from Williams et al. (2009), the progenitor stars would each have had masses of approximately 4.5 M☉. Stellar evolution models (e.g. Bertelli et al. 2008) give progenitor lifetimes for main-sequence to AGB evolution of 0.3 Gyr. Therefore, the total age of the system is 3.3 Gyr.
It is likely that the B component evolved first. Significant mass may have been transferred to the progenitor of A during the AGB evolution of B, or the mass lost by B may have been lost from the system. This unknown factor makes the initial orbit and the initial mass of A also unknown. Mass lost from A during its AGB evolution also could have been transferred back to B or lost from the system, and would have further modified the orbit. The evolutionary models (Bertelli et al., 2008) give a maximum radius for a 4.5 M☉ progenitor of 3 AU during AGB evolution, equal to the present semi-major axis, and probably not a coincidence. Therefore, mass loss by Roche lobe overflow is expected. Mass loss correlated with the orbital phase, and possibly also with pulsation of the AGB star, could act to increase the eccentricity to the large value we see now. It is likely that an interesting asymmetric planetary nebula would have been created twice around this system as each star passed through its post-AGB stage.
5 Future Observations
Several observations are possible to confirm the results of this paper and to further constrain the components of this binary system. First, astrometry during the next periastron passage late in the 2016 observing season (both optical astrometry of the photocenter and high-resolution astrometry of the resolved pair) can further define the rapidly changing orbital curve. Second, a high-resolution measure of the magnitude difference between the components at an optical band like can be done with HST to confirm the temperature difference between the two components. Third, a determination of the radial velocity curve of the primary star can be done with high signal-to-noise spectroscopy such as the SPY program achieves to help constrain the components. Figure 6 shows the predicted velocity curve for the most likely orbit. The rapid change in velocity of 20–30 km s-1 near periastron may be measureable. Also, it may be feasible to resolve absorption lines of the secondary star if it is a DA white dwarf, a measurement that would provide a determination of the masses of the components independent of the interior models used in this paper. Fourth, a high signal-to-noise optical spectrum would give an improved spectroscopic estimate of the mass(es), particularly when combined with the parallax and photometry in this paper.
References
- Bergeron et al. (1995) Bergeron, P., Wesemael, F., & Beauchamp, A. 1995, PASP, 107, 1047
- Bergeron et al. (1997) Bergeron, P., Ruiz, M.T., & Leggett, S.K. 1997, ApJS, 108, 339
- Bertelli et al. (2008) Bertelli, G., Girardi, L., Marigo, P., & Nasi, E. 2008, A&A, 484, 815
- Brown et al. (2012) Brown, W.R., Kilic, M., Allende Prieto, C. & Kenyon, S.J. 2012, AJ, 744: 142
- Dahn et al. (2002) Dahn, C.C., et al. 2002, AJ, 124, 1170
- Dahn et al. (2008) Dahn, C.C., et al. 2008, ApJ, 686, 548
- Dupuy et al. (2010) Dupuy, T.J., Liu, M.C., Bowler, B.P., & Cushing, M.C. 2010, ApJ, 721, 1725
- Dupuy et al. (2009a) Dupuy, T.J., Liu, M.C., & Ireland, M.J. 2009, ApJ, 692, 729
- Dupuy et al. (2009b) Dupuy, T.J., Liu, M.C. & Ireland, M.J. 2009, ApJ, 699, 168
- Farihi et al. (2010) Farihi, J., Hoard, D.W., & Wachter, S. 2010, ApJS, 190, 275
- Ghez et al. (2008) Ghez, A. M., et al. 2008, ApJ, 689, 1044
- Gianninas, Bergeron, & Ruiz (2011) Gianninas, A., Bergeron, P., & Ruiz, M.T. 2011, ApJ, 743: 138
- Harris et al. (2001) Harris, H.C., Dahn, C.C., Leggett, S.K., & Liebert, J. 2001, in Astrophysical Ages and Timescales, ASP Conf. Ser. 245, eds. T. von Hippel, C. Simpson & N. Manset (San Francisco: ASP), p. 313
- Harris et al. (2006) Harris, H.C., et al. 2006, in Astrometry in the Age of the Next Generation of Large Telescopes, ASP Conf. Ser. 338, eds. P.K. Seidelmann & A.K.B. Monet (San Francisco: ASP), p. 122
- Ireland et al. (2008) Ireland, M. J., Kraus, A., Martinache, F., Lloyd, J. P., & Tuthill, P. G. 2008, ApJ, 678, 463
- Ireland & Kraus (2008) Ireland, M. J., & Kraus, A. L. 2008, ApJ, 678, L59
- Koester (2010) Koester, D. 2010, Mem.S.A.It., 81, 921
- Kraus et al. (2008) Kraus, A. L., Ireland, M. J., Martinache, F., & Lloyd, J. P. 2008, ApJ, 679, 762
- Landolt (1992) Landolt, A.U. 1992, AJ, 104, 340
- Liebert et al. (2005) Liebert, J., Bergeron, P., & Holberg, J. 2005, ApJS, 156, 47
- Luyten (1976) Luyten, W.J. 1976, A Catalogue of Stars with Proper Motions Exceeding 0.5′′ Annually (Minneapolis: Univ. Minnesota Press) (LHS)
- Martinache et al. (2007) Martinache, F., Lloyd, J. P., Ireland, M. J., Yamada, R. S., & Tuthill, P. G. 2007, ApJ, 661, 496
- Monet et al. (1992) Monet, D.G., et al. 1992, AJ, 103, 638
- Napiwotzki et al. (2001) Napiwotzki, R., et al. 2001, Astronomishe Nachrichten, 322, 411
- Silvestri et al. (2006) Silvestri, N.M., et al. 2006, AJ, 131, 1674
- Steele et al. (2011) Steele, P.R., et al. 2011, MNRAS, 416, 2768
- Tuthill et al. (2006) Tuthill, P., et al. 2006, Society of Photo-Optical Instrumentation Engineers (SPIE) Conference Series, Vol. 6272, 62723A.
- van Dam et al. (2006) van Dam, M. A., et al. 2006, PASP, 118, 310
- Wachter et al. (2003) Wachter, S., et al. 2003, ApJ, 586, 1356
- Williams et al. (2009) Williams, K.A., Bolte, M., & Koester, D. 2009, ApJ, 693, 355
- Wizinowich et al. (2006) Wizinowich, P. L., et al. 2006, PASP, 118, 297
- Zuckerman et al. (2003) Zuckerman, B., et al. 2003, ApJ, 596, 477
| Result | Value |
|---|---|
| Epoch Range (yr) | 14.3 |
| No. Frames | 376 |
| No. Nights | 287 |
| No. Ref. Stars | 14 |
| Rel. Parallax (mas)1 | 32.40 0.33 |
| Rel. Parallax (mas)2 | 31.67 0.25 |
| Rel. Proper Motion (mas yr-1) | 668.61 0.04 |
| P.A. of Proper Motion (degrees) | 178.83 0.01 |
| Correction to Abs. Parallax (mas) | 0.74 0.06 |
| Abs. Parallax (mas)2 | 32.41 0.26 |
| Vtan (km s-1) | 97.8 0.8 |
| V | 15.70 0.02 |
| BV | 0.32 0.02 |
| VI | 0.45 0.02 |
| J | 15.08 0.04 |
| H | 14.95 0.05 |
| K | 14.94 0.05 |
| MV | 13.25 0.03 |
| Component | Teff | MB | MV | MR | MI | MJ | MH | MK | log g | Mass | (R) | a/ |
|---|---|---|---|---|---|---|---|---|---|---|---|---|
| DA+DA Binaries | ||||||||||||
| A | 7700 | 14.28 | 13.98 | 13.78 | 13.54 | 13.38 | 13.21 | 13.21 | 8.49 | 0.910 | 0.487 | 54.8 |
| B | 7700 | 14.33 | 14.04 | 13.84 | 13.60 | 13.43 | 13.26 | 13.26 | 8.52 | 0.930 | ||
| A | 8000 | 14.16 | 13.89 | 13.71 | 13.50 | 13.36 | 13.21 | 13.22 | 8.53 | 0.932 | 0.453 | 23.8 |
| B | 7400 | 14.47 | 14.14 | 13.92 | 13.66 | 13.46 | 13.27 | 13.27 | 8.49 | 0.912 | ||
| A | 8100 | 14.14 | 13.87 | 13.70 | 13.49 | 13.36 | 13.22 | 13.23 | 8.54 | 0.942 | 0.447 | 23.9 |
| B | 7300 | 14.50 | 14.16 | 13.93 | 13.67 | 13.46 | 13.26 | 13.25 | 8.48 | 0.900 | ||
| DA+DC Binaries | ||||||||||||
| A | 8600 | 13.96 | 13.72 | 13.58 | 13.40 | 13.32 | 13.21 | 13.23 | 8.58 | 0.970 | 0.388 | 24.4 |
| B | 6200 | 14.91 | 14.40 | 14.07 | 13.74 | 13.51 | 13.36 | 13.27 | 8.24 | 0.728 | ||
| A | 8800 | 13.90 | 13.68 | 13.54 | 13.38 | 13.32 | 13.21 | 13.24 | 8.61 | 0.985 | 0.372 | 23.7 |
| B | 6000 | 15.02 | 14.47 | 14.11 | 13.76 | 13.50 | 13.34 | 13.25 | 8.19 | 0.695 | ||
| A | 9000 | 13.85 | 13.63 | 13.51 | 13.36 | 13.32 | 13.22 | 13.25 | 8.63 | 1.000 | 0.355 | 24.3 |
| B | 5800 | 15.15 | 14.54 | 14.16 | 13.78 | 13.49 | 13.31 | 13.21 | 8.13 | 0.655 | ||
| Parameter | Value |
|---|---|
| Period (yr) | 4.030 0.018 |
| (mas)1 | 4.37 0.25 |
| (AU)1 | 0.135 0.008 |
| i (deg) | 93.2 0.3 |
| e | 0.740 0.032 |
| (deg) | 49.4 1.6 |
| (deg) | 91.6 0.3 |
| T0 | 2008.54 0.03 |
| RMSRA (mas) | 3.0 |
| RMSDec (mas) | 3.4 |