Article 27 in eConf C1304143
Statistical analysis of the prompt and afterglow emission of the three groups of gamma-ray bursts
J. Kóbori1, Z. Bagoly1, L. G. Balázs1,2 and I. Horváth3
1Eötvös University, Budapest, Hungary, 2MTA CSFK Konkoly Observatory, Budapest, Hungary, 3National University of Public Service, Budapest, Hungary
We investigated the main prompt and afterglow emission parameters of gamma-ray bursts detected by the Burst Alert Telescope (BAT) and X-Ray Telescope installed on the Swift satellite. Our aim was to look for differences or connections between the different types of gamma-ray bursts, so we compared the BAT fluences, 1-sec peak photon fluxes, photon indices, XRT early fluxes, initial temporal decay and spectral indices. We found that there might be a connection between the XRT initial decay index and XRT early flux/BAT photon index. Using statistical tools we also determined that beside the duration and hardness ratios, the means of the - and X-ray–fluences and the -ray photon index differ significantly between the three types of bursts.
PRESENTED AT
Huntsville Gamma Ray Burst Symposium, GRB 2013, Nashville, Tenesse, USA
1 Introduction
Gamma-ray bursts (GRBs), based on their duration and hardness ratios, can be divided into three groups: short (SB), intermediate (IB) and long duration bursts (LB). While the progenitors of SBs and LBs are very likely different, the IBs and LBs show similar features in their prompt and afterglow emission. So far, many authors (e.g. de Ugarte Postigo et al. 2010, [4]) investigated whether the observed differences or similarities in various parameters concerning the IBs and LBs are significant or not. Also, the presence of the intermediate group can be a result of observational and/or instrumental effects. An important question is that apart from the duration and hardness ratio parameters are there any other quantities which possess significant differences in their measured values.
2 Data reduction - methods
The data was downloaded from the Heasarc Archive System ([2]), the sample consists of GRBs up to 27 March 2013, but we only included those bursts which have measured BAT fluences, 1-sec peak photon fluxes, photon indices, XRT early fluxes, initial temporal decay and spectral indices. The sample consists of 317 bursts: 28 short, 55 intermediate and 234 long duration bursts. The classification was based on the parameter, where mean values for the different groups are: 0.47 s, 13.7 s and 50.0 s for the SBs, IBs and LBs, respectively ([1]). In order to determine the significances in the differences between the SBs, IBs and LBs regarding the above parameters, linear discriminant analysis was carried out on the sample. The details of this method can be read in Section 6.
3 BAT properties
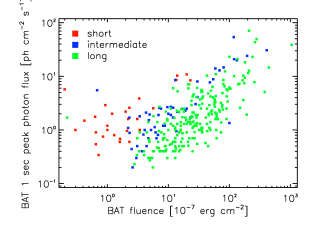
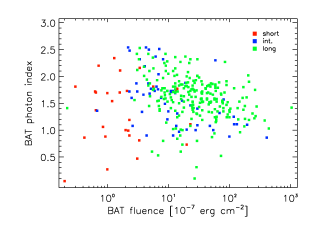
First, we compared the main BAT measured parameters: the fluence, the 1-sec peak photon flux and the photon index. As we can see on the Fig. 1 (left side) the three types of bursts separate quite well on the fluence and peak photon flux plane. Regarding the photon index and the peak photon flux variables, the three groups almost entirily overlap, however, the short and long bursts, according to the distinct distribution on the fluence – peak photon flux plane, do not show any similarity between the fluence and photon index parameters (see Fig. 1, right side).
4 XRT properties
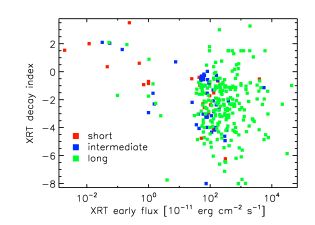
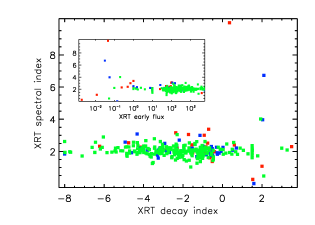
We also compared the XRT afterglow features. An interesting result we found that X-ray decay index seems to depend on the XRT early flux (see Fig. 2, left panel). More precisely, in the cases of the LBs the higher the early flux, the broader the decay index range, however, IBs show quite similar behaviour, but we should notice that, on one hand, the latter type of bursts tend to have lower early fluxes, and on the other hand the trend can be a result of the low number of short and IBs. Contrary to the previous correlation the XRT spectral index does not depend on the decay index and early flux (Fig. 2, right panel).
5 BAT vs. XRT features
A more interesting issue whether the BAT and XRT properties correlate or not. In order to test this we correlated all of the BAT and XRT features against each other and among them we found two connections. The XRT early flux for the IBs seems to have an upper limit around erg/cm2/s (except one outlier), while for the LBs this quantity shows a continous distribution (Fig. 3, left side). The other remarkable result is dependence of the XRT initial decay index on the BAT photon index (Fig. 3).
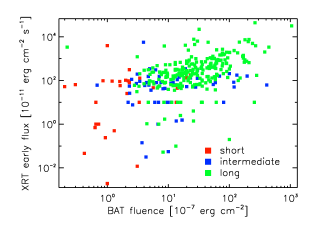
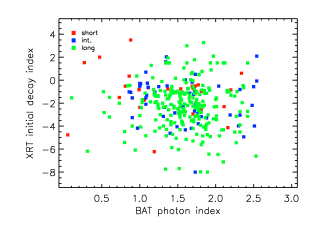
In the cases of the LBs there is a weak correlation between them, as the BAT photon index gets lower, the XRT decay index tends to converge to the value of (-2). The IBs and SBs do not show such properties.
6 Statistical method
The Discriminant Analysis (DA) is a statistical technique which allows us, based on a priori classification, to find the linear combination of the explanatory variables which characterize or separates two or more classes. Using the SPSS statistical program package ([5]) we carried out such an analisys on the sample. The purpose of DA is to estimate the relationship between a single categorical dependent variable and a set of quantitative independent variables. DA involves deriving a variate, the linear combination of the two (or more) independent variables that will discriminate best between defined groups. The linear combination for a discriminant analysis, also known as the discriminant function is derived from an equation that takes the following form (there are altogether discriminant functions, where is the number of classes):
| (1) |
In our case we have 3 groups, so we are looking for 2 discriminant functions (variables). The results of this analysis are shown in Table LABEL:t1 and LABEL:t2.
| F | Sig. | |
| logFlu | 56.387 | 0.000 |
| logPeak | 0.089 | 0.915 |
| logXflu | 18.525 | 0.000 |
| Pind | 8.002 | 0.000 |
| Xdec | 1.186 | 0.307 |
| Xsp | 5.881 | 0.003 |
| Func. 1 | Func. 1 | |
| logFlu | 0.694 | 0.217 |
| logPeak | 0.004 | 0.092 |
| logXflu | 0.376 | 0.454 |
| Pind | 0.147 | -0.735 |
| Xdec | -0.096 | 0.107 |
| Xsp | -0.224 | 0.066 |
7 Discussion and conclusion
In this article we examined whether the main BAT and XRT properties correlate or not. Apparently, the XRT early flux and early decay index are connected, as the former one decreases, the latter one converges to the value of 2. Since the positive value means a rising afterglow (i.e. ), one reason for this behaviour could be that the Swift simply starts to observe these bursts earlier, so the time difference between the peak and first observation is greater for bursts with lower XRT early flux. The XRT early flux also seems to depend on the BAT photon index, although, in this case it converges to (-2), while the photon index decreases. This issue is a more problematic one, since the - and X-ray emissions could be physically connected and/or detached, so our plan is to investigate further this problem. We also determined which prompt and afterglow parameters can be used to distinguish the three types of bursts. Using the Linear Discriminant Analysis statistical tool, we come to the conclusion, that the and X-ray fluences as well as the BAT photon index are the most important quantities, beside the duration and hardness ratios, which separate mostly the SBs, IBs and LBs.
ACKNOWLEDGEMENTS
This work was supported by the Hungarian OTKA-77795 grant. This research has made use of data obtained through the High Energy Astrophysics Science Archive Research Center Online Service, provided by the NASA/Goddard Space Flight Center. I acknowledge Doctorate School of Physics, Eötvös University, for supporting my participation on the Huntsville Gamma Ray Burst Symposium, GRB 2013, Nashville, Tennessee, USA.
References
- [1] P. Veres, et al., ApJ, 725, 1955 (2010).
- [2] http://swift.gsfc.nasa.gov/docs/swift/archive/grb_table.html
- [3] A. Panaitescu, et al., ApJ, 554, 667 (2001).
- [4] A. de Ugarte Postigo, et al., A&A, 525, 17 (2011).
- [5] http://www.spss.com