Measurements of Cyclotron Features and Pulse Periods in the High-Mass X-Ray Binaries 4U 1538522 and 4U 1907+09 with INTEGRAL
Abstract
We present a spectral and timing analysis of INTEGRAL observations of two high mass X-ray binaries, 4U 1538522 and 4U 1907+09. Our timing measurements for 4U 1538522 find the pulse period to have exhibited a spin-up trend until approximately 2009, after which there is evidence for a torque reversal, with the source beginning to spin down to the most recently-measured period of s. The most recent INTEGRAL observations of 4U 1907+09 are not found to yield statistically significant pulse periods due to the significantly lower flux from the source compared to 4U 1538522. A spectral model consisting of a power-law continuum with an exponential cutoff and modified by two cyclotron resonance scattering features is found to fit both sources well, with the cyclotron scattering features detected at and keV for 4U 1538522 and at and keV in 4U 1907+09. The spectral parameters of 4U 1538522 are generally not found to vary significantly with flux, and there is little to no variation across the torque reversal. Examining our results in conjunction with previous work, we find no evidence for a correlation between cyclotron line energy and luminosity for 4U 1538522. 4U 1907+09 shows evidence for a positive correlation between cyclotron line energy and luminosity, which would make it the fourth, and lowest-luminosity, cyclotron line source to exhibit this relationship.
Subject headings:
pulsars: individual (4U 1538522, 4U 1907+09) — stars: magnetic field — stars: oscillations — X-rays: binaries — X-rays: stars1. Introduction
High-mass X-ray binaries (HMXBs) are a class of binary systems consisting of a neutron star with a high-mass ( M⊙) main-sequence companion. X-ray emission from the neutron star is driven primarily by accretion of material from the main-sequence companion, typically via either Roche lobe overflow in the case of less-massive companions, or the stellar wind of a higher-mass companion. The neutron star’s strong ( G) magnetic field channels accreted material onto the magnetic poles, forming an accretion column where the majority of the X-ray luminosity is produced via inverse Compton scattering of thermal photons produced at the stellar surface and bremsstrahlung radiation from within the column. Obtaining a detailed physical picture of this process is still an open problem in X-ray astrophysics. Early work (e.g., Meszaros & Nagel, 1985; Klein et al., 1996) was generally limited in its ability to properly reproduce the accreting neutron star spectrum, due to the extreme complexity of the problem. Recently, however, work by Becker & Wolff (2007) has produced promising results, successfully reproducing the continuum spectra of several high-luminosity X-ray pulsars. In addition to the base continuum, several dozen HMXBs display absorption-like features in their spectra that are identified as cyclotron resonance scattering features (CRSFs, also known as cyclotron lines), produced by the resonant scattering of photons on electrons moving in the magnetic field; the physical modeling of these features has also seen significant progress in work by Schönherr et al. (2007). Work is currently underway to merge the continuum and cyclotron line models into a single model capable of producing an accurate, physically-motivated model for accreting neutron stars (Schwarm et al., 2013; Schwarm, 2013).
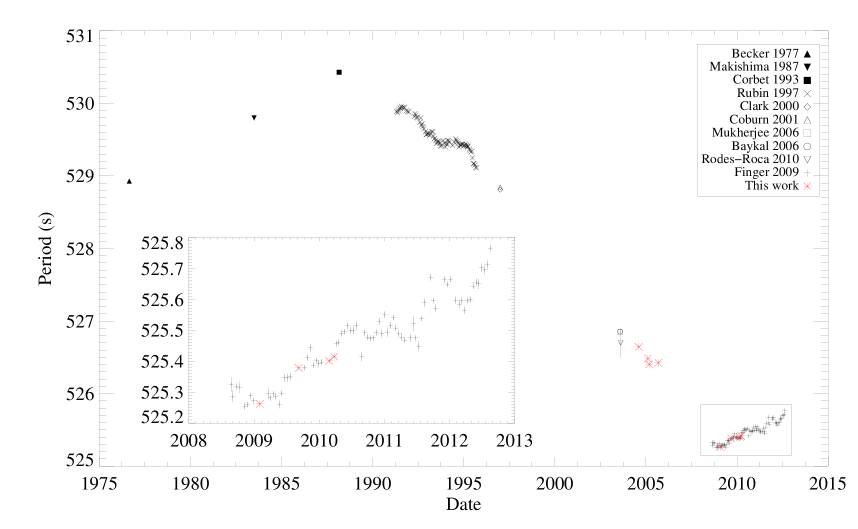
The accretion-powered X-ray pulsar 4U 1538522 was discovered in the early 1970s by the Uhuru satellite (Giacconi et al., 1974). Its main-sequence companion is the M⊙ B0 star QV Nor (Reynolds et al., 1992). X-ray pulsations were first observed from the vicinity of 4U 1538522 by Becker et al. (1977) and Davison (1977); Davison et al. (1977) identified these as coming from 4U 1538522. The distance to 4U 1538522 has been variously estimated to be (Crampton et al., 1978), (Ilovaisky et al., 1979), (Reynolds et al., 1992), and (Clark, 2004) kpc. Infrequent observations post-discovery showed 4U 1538522 to be spinning down until the late 1980s, reaching a maximum period of s (Makishima et al., 1987; Davison, 1977; Becker et al., 1977), after which extended BATSE monitoring between 1990 and 1995 by Rubin et al. (1997) showed the source to have transitioned to a long-term spin-up trend that would last until approximately 2009, when monitoring by the Gamma-ray Burst Monitor (GBM) aboard the Fermi satellite, along with this work, show the source to have transitioned to a spin-down state (see Fig. 2). The early OSO-8 and Ariel-5 observations by Becker et al. (1977) and Davison et al. (1977) also established a day orbital period and provided the first picture of the binary orbit of the system, with the orbital parameters being updated by Makishima et al. (1987), Clark (2000), and Mukherjee et al. (2006). The exact characteristics of 4U 1538522’s orbit remain somewhat uncertain: the three aforementioned references find three different values for the eccentricity, with Makishima et al. adopting , Clark finding solutions for both circular and elliptical () orbits, and Mukherjee et al. supporting Clark’s elliptical solution. Efforts to determine the mass of 4U 1538522 by van Kerkwijk et al. (1995) adopted a circular orbit, while recent work by Rawls et al. (2011) finds a mass of M⊙ for Clark’s elliptical orbit and M⊙ for the circular solution, making 4U 1538522 potentially one of the lightest neutron stars known. The spectrum of 4U 1538522 is fit well by a power law with an exponential cutoff (Makishima et al., 1987), with CRSFs at 22 (Clark et al., 1990) and keV, tentatively reported in BeppoSAX data by Robba et al. (2001), but not confirmed until a combined RXTE and INTEGRAL analysis by Rodes-Roca et al. (2009).
4U 1907+09 is another wind-accreting X-ray binary, also discovered by Uhuru (Giacconi et al., 1971). It is similar to 4U 1538522 in its long pulse period ( s), short orbital period ( d), and optical companion (O8/O9, as found by Cox et al., 2005). For yr following the identification of the source as a pulsar by Makishima et al. (1984), the pulse period increased steadily from 437.4 s in 1984 (Makishima et al., 1984) to s in 1998, when the spin-down trend began to slow, leading to a torque reversal in 2005 (Fritz et al., 2006). This was followed relatively quickly by another reversal in mid-2007 (Inam et al., 2009; Şahiner et al., 2011), and the source began following approximately the same spin-down trend as it had between 1987 and 1998, a trend which thus far shows no sign of changing. The initial determination of the d orbital period showed flaring twice per orbit, suggesting the source was in orbit around a Be-type star (Marshall & Ricketts, 1980), although subsequent optical observations indicated that the companion was more likely a supergiant (van Kerkwijk et al., 1989). Recent optical (Cox et al., 2005) and infrared (Nespoli et al., 2008) observations have more firmly established the companion as a O8/O9 supergiant, with Cox et al. finding a distance of kpc to the source, while Kostka & Leahy (2010) have shown that the most likely scenario to produce the observed flaring involves a dense stellar wind along with a trailing stream of material between the neutron star and companion. Observations with Ginga established the existence of an absorption feature, identified as a CRSF, at keV (Mihara, 1995; Makishima et al., 1999), with a second at keV detected in BeppoSAX data by Cusumano et al. (1998).
In this paper, we first present a summary of the observations used in our analysis in §2, followed by a brief discussion of the pulse timing measurements made for each source in §3. §4 presents the spectral analysis of each source, where the large energy range covered by the combination of the ISGRI and JEM-X instruments proves advantageous. Finally, we discuss these results in the context of recent theoretical results regarding accretion onto magnetic poles in §5.
2. Observations
We used two of the instruments aboard INTEGRAL: the INTEGRAL Soft Gamma-Ray Imager (ISGRI, Lebrun et al., 2003), which is the upper layer of the Imager on Board the INTEGRAL Satellite (IBIS, Ubertini et al., 2003), a coded-mask telescope with a fully-coded field of view, and the twin Joint European X-ray Monitors (JEM-X 1 and 2, Lund et al., 2003), coded-mask telescopes with circular fields of view of diameter . Early in the INTEGRAL mission, only one JEM-X telescope was in operation at any given time, out of concern for the lifetime of the microstrip anodes used in the detectors, but lowered operating voltage alleviated these concerns, and recent (post-2009) observations have both detectors running simultaneously. The INTEGRAL satellite has a -day orbit; the science data for each orbit (or “revolution”) is divided into ks-long pointings called Science Windows (SCWs). The nominal energy range of ISGRI is 15 keV - 1 MeV, but we follow the ISGRI team’s recommendation of a lower bound of 18 keV for data taken prior to revolution 848, and 20 keV for data prior to revolution 1000. The JEM-X data are limited to keV for similar reasons. Neither source is detected above keV in ISGRI or keV in JEM-X. We extracted spectra and lightcurves using version 10.0 of the standard Offline Scientific Analysis (OSA) software provided by the INTEGRAL Science Data Center (ISDC).
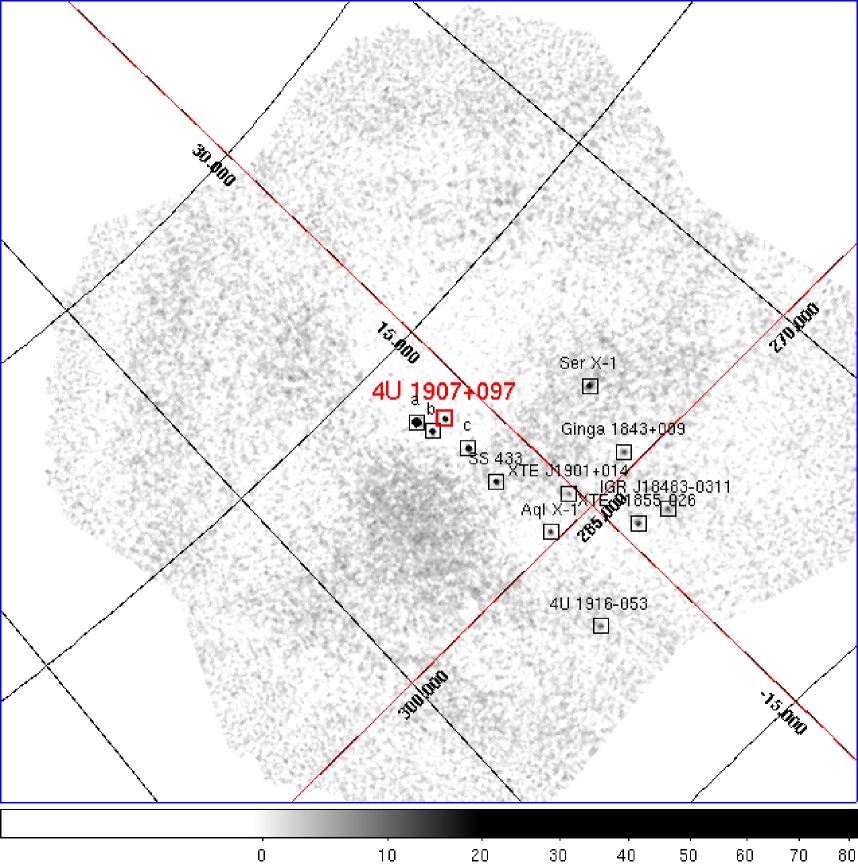
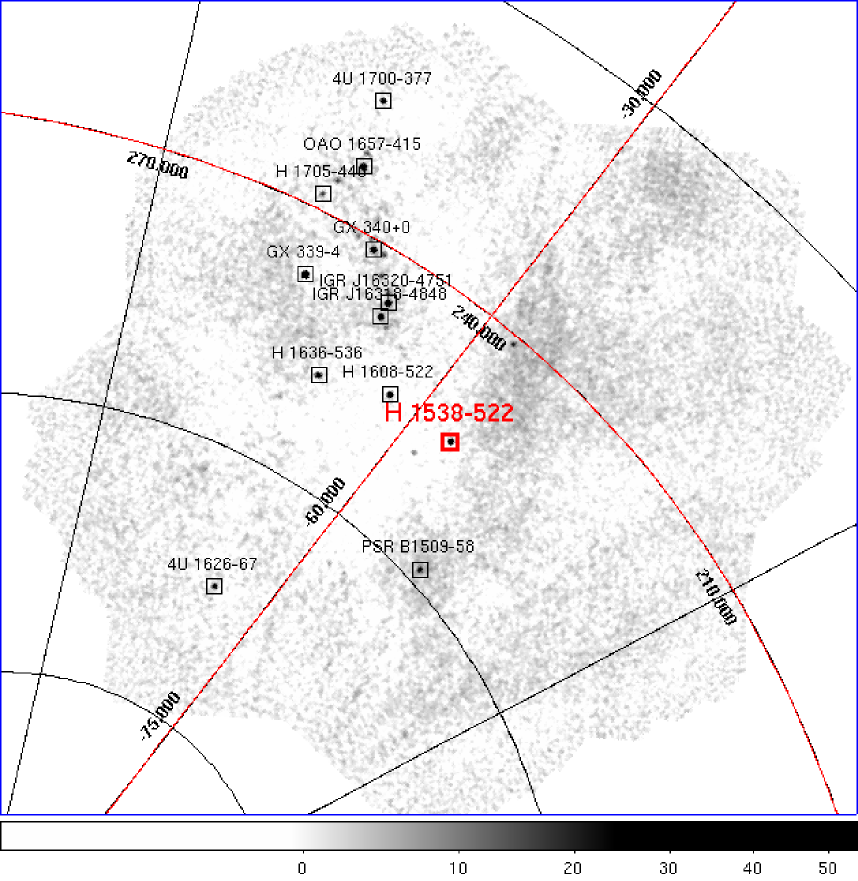
Coded-mask detectors such as those used by ISGRI and JEM-X work by deconvolving the “shadowgram” produced by opaque elements in the mask placed over the detector. While this allows imaging to be performed in the normally difficult hard X-ray band, it also means the illuminated pixels in the detector receive light from every unocculted point in the field of view, and as such every significant source in the FOV must be accounted for when determining the background for a given single source. We followed the recommendation of the ISDC and provided a catalog of all sources with detection significance greater than in the single SCW’s image. We provide the resulting list of sources in 1, along with their 20-40 keV counting rate in the combined mosaic of all SCWs. The 20-40 keV ISGRI mosaic images from all SCWs are provided in Figure 1.
| Source | counts s-1aa20-40 keV ISGRI count rates | Source | counts s-1 |
|---|---|---|---|
| 4U 1538522 | 4U 1907+09 | ||
| 4U 1700377 | GRS 1915+105 | ||
| GX 3394 | 4U 1909+07 | ||
| OAO 1657415 | 4U 1916053 | ||
| 4U 162667 | XTE J1855026 | ||
| IGR J163204751 | Ser X-1 | ||
| GX 340+0 | SS 433 | ||
| H 1608522 | IGR J19140+0951 | ||
| H 1636536 | IGR J184830311 | ||
| IGR J163184848 | Aql X-1 | ||
| H 1705440 | Ginga 1843+009 | ||
| PSR B150958 | XTE J1901+014 | ||
| 4U 163047 | NDbbND: Not detected in mosaic image | SWIFT J1753.50127 | ND |
| XTE J1652453 | ND | 4U 181212 | ND |
| GX 17+2 | ND | ||
| PSR J18460258 | ND | ||
| 3A 1850087 | ND |
2.1. 4U 1538522
Our ISGRI dataset comprises all publicly available data where 4U 1538522 was within its fully-coded field of view, extending from January 2003 through April 2010. The JEM-X data are selected in a similar fashion, taking all windows within the -radius fully-coded field of view. There is a 3-year gap in the INTEGRAL coverage of 4U 1538522, with no observations between late 2005 and late 2008. In the earlier data, the total ISGRI exposure is 715 ks, with 638 and 210 ks for JEM-X 1 and 2, respectively; the later dataset totals 417 ks of ISGRI exposure, 411 ks of JEM-X 1, and 172 ks of JEM-X 2.
2.2. 4U 1907+09
We analyzed science windows beginning in November 2007 (INTEGRAL revolution 608) for 4U 1907+09, overlapping slightly with the selection of Şahiner et al. (2012). Selecting SCWs according to the same criteria as used for 4U 1538522 amounts to 892 ks of ISGRI exposure, 908 ks of JEM-X 1, and 507 ks of JEM-X 2. The average flux from 4U 1907+09 is considerably lower than 4U 1538522, and is indeed at what appears to be close to a historic low for the source (comparable to that seen by Makishima et al. (1999) and Coburn (2001)). As a result, it is difficult to provide strong constraints on its spectral parameters.
3. Timing Analysis
We extracted 10 s binned ISGRI lightcurves in the 20-40 keV energy band with the OSA 10.0 analysis pipeline. The only departure from the standard procedure was the use of the alternate ii_light tool for lightcurve extraction, as the standard pipeline’s lightcurve extraction routine is not recommended for binning times less than 60 s (Chernyakova et al., 2010). After extraction, the lightcurves were barycentered using the barycent tool also provided in the OSA package.
Due to the low signal-to-noise and few pulsations covered by the individual ks lightcurves, many lightcurves had to be appended to each other before any period determination could be made. The composite lightcurve was then corrected for the orbital motion of the source, using the best available orbital parameters. As the pulse profile of the source is non-sinusoidal and the composite lightcurve contains a moderate number of gaps, epoch folding (Leahy et al., 1983; Larsson, 1996) was used for the period search, with 1 errors determined according to Larsson (1996).
3.1. 4U 1538522
For 4U 1538522, we used the elliptical orbital parameters provided by Mukherjee et al. (2006), although using Clark (2000)’s circular solution did not result in any significant change in the pulse period. For convenience, these parameters are listed in Table 2. Lightcurves were grouped by requiring that no gaps larger than 4 days be present, in order to minimize the effect of large gaps in the data when performing epoch folding. Eight sets of SCWs using this grouping have sufficient time and statistics to return clear single peaks in the epoch folding results; we summarize these results in Table 3, and the source’s pulse period history is updated in Figure 2. Pulse periods from the earlier data, prior to 2008, follow roughly the same spin-up trend as originally seen by Rubin et al. (1997), with the period dropping at a rate of s yr-1. However, our measured pulse periods post-2008 reveal a new spin-down trend of s yr-1. This conclusion is supported by the results of the Fermi Gamma-ray Burst Monitor Pulsar Project (Finger et al., 2009)111Results for 4U 1538522 can be found at http://gammaray.nsstc.nasa.gov/gbm/science/pulsars, which we also include in Figure 2. The pulse shape in the 20-40 keV band is dominantly single-peaked; the disappearance of the secondary peak in the keV pulse profile has been seen before by Clark et al. (1990) and Robba et al. (2001), who suggested it may be due to the presence of the keV CRSF. The pulse profiles from all observations do not vary significantly from group to group, with the RMS values of the difference between profiles 20 - 50 % lower than the average noise in the profiles. This persists across the torque reversal.
| 4U 1538522 aaMukherjee et al. (2006) | 4U 1907+09 bbin ’t Zand et al. (1998) | ||
|---|---|---|---|
| lt-s | |||
| d | |||
| MJD | |||
| MJD | Period (s) |
|---|---|

3.2. 4U 1907+09
We began our 4U 1907+09 timing analysis with data from INTEGRAL revolution 608, roughly where the INTEGRAL analysis of Şahiner et al. (2012) ended. The data were binary corrected according to the parameters determined by in ’t Zand et al. (1998), listed in Table 2. During the time encompassed by our analysis, the source was considerably fainter when compared to previous studies using INTEGRAL (Fritz et al., 2006; Şahiner et al., 2012), and was significantly () dimmer than 4U 1538522 (compare the 5-100 keV fluxes for 4U 1538522 in Tables 4 and 5 to the equivalent flux for 4U 1907+09 in Table 6). When epoch folding, no selection of SCWs from the new INTEGRAL data produce distributions that are comparable to our results for 4U 1538522, and all error-estimation procedures return errors of s, compared to s for 4U 1538522. As a consistency check, SCWs from INTEGRAL revolutions 608 through 623, already reported by Şahiner et al. (2012), were analyzed in the same manner; for this data subset alone, the epoch folding returns a statistically significant result that is consistent with Şahiner et al.’s. We thus do not report any INTEGRAL-derived pulse periods for 4U 1907+09 due to the faintness of the source.
4. Spectral Analysis
We extracted ISGRI and JEM-X spectra for 4U 1538522 and 4U 1907+09 on a SCW-by-SCW basis using the OSA 10.0 software, combining the individual SCW spectra with the spe_pick tool provided in the OSA package. The extracted spectra were then modeled in XSPEC version 12.7.1 (Arnaud, 1996). All error bars are for the 90% single-parameter confidence interval unless otherwise indicated, and 5-100 keV model fluxes with 90% error bars were computed using XSPEC. The spectra for both sources descend into noise above 50-80 keV, depending on the particular subset of data being analyzed. Spectra were regrouped to provide roughly similar error bars for data above the noise threshold.
We present spectral fits for two continuum models. The PLCUT model (in XSPEC, POWERLAW*HIGHECUT) is a piecewise function, with a power-law multiplied by a high energy exponential cutoff above some cutoff energy :
| (1) |
where is the model flux in erg cm-2 s-1 at 1 keV and is the -folding energy that turns on at energies higher than the cutoff energy . The CUTOFFPL continuum is PLCUT with the parameter frozen at zero. Since this means the CUTOFFPL spectrum is being exponentially attenuated at all energies, it generally has a significantly lower photon index , but its continuous nature means it lacks the sharp corner that in PLCUT can produce spurious residuals around the cutoff energy. However, CUTOFFPL on its own results in high values for spectral fits in some cases, requiring an additional broad Gaussian component to be added to the spectral model. A feature like this at keV has been seen before in both 4U 1538522 (Coburn, 2001) and 4U 1907+09 (Mihara, 1995; Coburn, 2001; Rivers et al., 2010) as an emission feature, as well as many other HMXBs both with and without cyclotron features (although it occasionally can be modeled as an absorption feature, see e.g., Müller et al., 2012b), and is likely due to the simplistic nature of our continuum models in light of the complex physics of the actual accretion column.
There are two other commonly used continuum models, the Fermi-Dirac cutoff model FDCUT and the two-power-law NPEX, but neither model was capable of producing a stable fit in either source, generally returning many unconstrained parameters. We did not incorporate any photoelectric absorption, as it is not strongly pronounced at energies above a few keV, nor did we include the Fe K line at 6.4 keV (Rodes-Roca et al., 2010), as the energy binning needed to obtain usable statistics is too coarse to observe the line.
Both sources exhibit absorption-like features in the and keV range. These are typically identified as CRSFs, and a brief description of the mechanism for their production is presented in §5. They typically appear as broad ( keV), relatively shallow absorption-like features, usually modeled by multiplicative Gaussians or pseudo-Lorentzians with negative intensity. We use a local XSPEC model, GAUABS, a Gaussian optical depth profile defined by
| (2) | |||||
| (3) |
The broad width and shallowness of these lines makes their detection and constraint difficult in the exponentially-dropping spectra of HMXBs, especially when it comes to the higher harmonics which lie far above the cutoff energy of the spectrum. In particular, the width of the harmonic was unconstrained in some cases, and we opted to fix it at its fitted value when determining errors. In very low-flux datasets, the harmonic CRSF is often not detected.
4.1. 4U 1538522
4.1.1 Date-selected spectra
The three-year gap in INTEGRAL coverage of 4U 1538522, along with the presence of the torque reversal of late 2008/early 2009, presents an obvious point at which to split the dataset, so we analyze the 2003–2005 and 2008–2010 spectra separately.
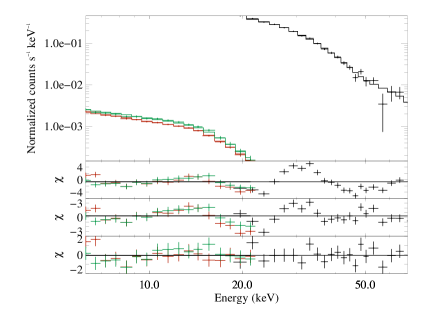
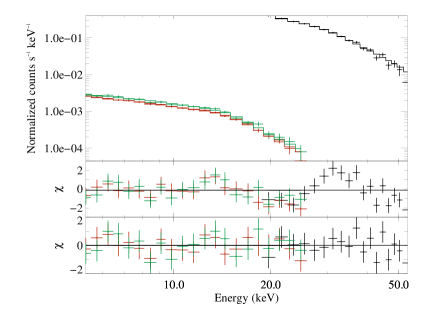
Each dataset was fit with the two aforementioned continuum models. Each continuum was modified by one or two Gaussian-profile absorption features and a constant multiplier, which was frozen at unity for ISGRI spectra and allowed to vary for the JEM-X spectra in order to account for calibration differences between instruments. The two continuum models provide similar statistics, with CUTOFFPL+BUMP being slightly superior in most cases. However, when calculating errors, it was necessary to fix the width of the 10-keV feature in the later dataset at the value found in the earlier dataset, as the decreasing sensitivity of the JEM-X telescopes at higher energies combined with the presence of the CRSF at keV resulted in unconstrained fit parameters. We will refer primarily to the PLCUT continuum results in our discussion due to this limitation. Neither continuum model shows any significant variation across the torque reversal. We list the parameters for the spectral fits for both continua in Table 4, and the spectra for the PLCUT continuum are plotted in Figure 4.
We clearly detect the fundamental CRSF at keV in the early dataset and keV in the late. Adding the feature in the early spectra decreases the statistic from to , while in the late dataset, drops from to . There are no statistically significant differences in the fundamental CRSF across the torque reversal. The harmonic CRSF is much less significantly detected in the early dataset: its addition at keV lowers the to . In the later data, the feature is not detected; adding a keV GAUABS component reduces the by a negligible amount, and generally has unconstrained width and depth, so we leave the feature out of our model for the late data. This non-detection is likely a product of the fact that we are adding together all spectra from after the torque reversal, and the lower-luminosity observations are driving down the signal-to-noise ratio. This can be more clearly seen in the following section.
| Early (2003-2008) | Late (2008-2010) | ||||
|---|---|---|---|---|---|
| Continuum | POWERLAW | CUTOFFPL+BUMP | POWERLAW | CUTOFFPL+BUMP | |
| Normalization | aaUnits: photons cm-2 s-1 at 1 keV | ||||
| 5-100 keV flux | bbUnits: erg cm-2 s-1 | ||||
| keV | |||||
| keV | |||||
| keV | |||||
| keV | (frozen) | ||||
| ccUnits: photons cm-2 s-1 | |||||
| keV | |||||
| keV | |||||
| keV | |||||
| keV | |||||
| JEM-X 1 normalization | |||||
| JEM-X 2 normalization | |||||
| (dof) | |||||
4.1.2 Luminosity-selected spectra
To more closely examine the differences between the earlier and later spectra for 4U 1538522, we further split the date-selected SCWs into high, middle, and low-luminosity bins by taking a 1 region around the average-brightness SCW to be the middle-luminosity bin. The 5100 keV flux of the source varies by a factor of from the lowest- to highest-luminosity bin. The best-fit parameters for these datasets for two continuum models are presented in Table 5. Both continuum models again provide roughly similar statistics for each dataset. The earlier mid-luminosity bin was the only dataset in the luminosity-selected data that showed a clear need for a 10-keV feature; however, it was necessary to freeze the width of the feature at its fitted value to obtain a stable fit, due to the interaction between the keV CRSF and the “bump.” We additionally froze the width of the harmonic CRSF in all but one model for the mid-luminosity datasets, as a dearth of counts at high energy often led this parameter to be unconstrained. In these cases, we froze the value of the width to the value found in the same model for the corresponding high-luminosity dataset, the exception being the later mid-luminosity spectrum, where the 16 keV width of the later high-luminosity data did not produce a good fit. In that case, the width was frozen to the value found in the earlier high-luminosity data. The harmonic CRSF was not detected in the low-luminosity dataset.
In the PLCUT continuum, Efold is the only parameter showing a significant correlation with luminosity, with a slope of keV/( erg s-1) (90% confidence). The correlation is significant at the p = 0.02 level. The other spectral parameters generally do not show clearly significant trends; and have slight correlations, but only at the level. The missing harmonic CRSF is consistent with a lack of statistics at energies above keV in the low-luminosity datasets; attempting to fit a line with energy and width frozen at the value from the mid-luminosity bin results in an unbounded depth, and so we do not include the harmonic CRSF in the model for the low-luminosity data.
| High | Mid | Low | |||||||||||
|---|---|---|---|---|---|---|---|---|---|---|---|---|---|
| Early | Late | Early | Late | Early | Late | ||||||||
| Continuum | P aaPLCUT continuum
|
C bbCUTOFFPL continuum
|
P | C | P | CB ccCUTOFFPL+BUMP continuum
|
P | C | P | C | P | C | |
| Normalization | ddUnits: photons cm-2 s-1 at 1 keV
|
||||||||||||
| 5-100 keV flux | eeUnits: erg cm-2 s-1
|
||||||||||||
| keV | |||||||||||||
| keV | |||||||||||||
| keV | |||||||||||||
| keV | (frozen) | ||||||||||||
| ffUnits: photons cm-2 s-1
|
|||||||||||||
| keV | |||||||||||||
| keV | |||||||||||||
| keV | |||||||||||||
| keV | (frozen) | (frozen) | (frozen) | ||||||||||
| JEM-X 1 normalization | |||||||||||||
| JEM-X 2 normalization | |||||||||||||
| (dof) | |||||||||||||
4.2. 4U 1907+09
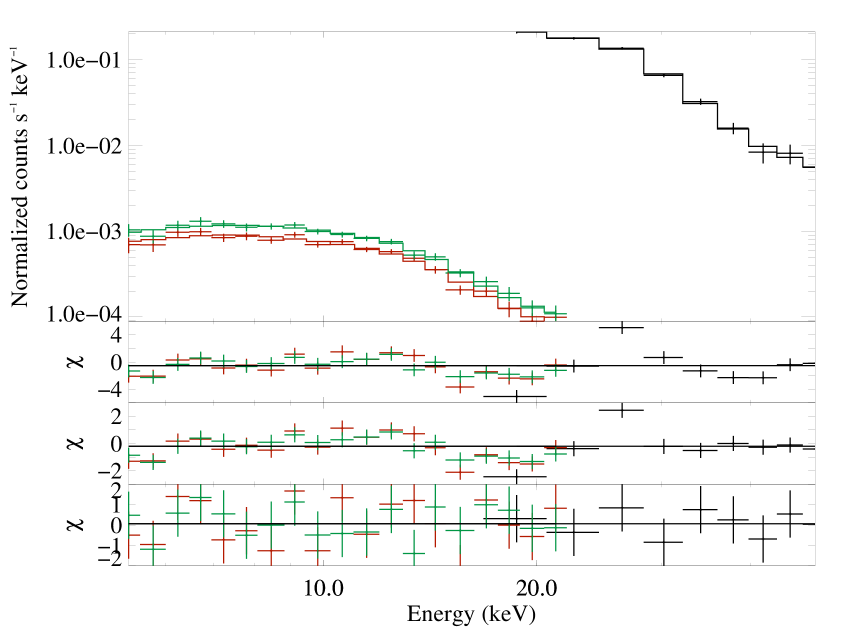
The SCWs for 4U 1907+09 are overall more evenly spread throughout INTEGRAL’s mission, with no significant changes in pulse period derivative, so there is no logical point in time to define a date-based separation as we have done for 4U 1538522. The best-fit spectral parameters for all analyzed 4U 1907+09 SCWs are presented in Table 6, with the folded spectrum and model residuals for the PLCUT continuum plotted in Figure 5. Previous analyses (Fritz et al., 2006; Rivers et al., 2010; Şahiner et al., 2012) have been performed using the PLCUT, FDCUT, and NPEX continua, but as is stated in §4, we could not obtain useful fits for the latter two. There was no evidence in the residuals for a bump feature at keV as has been seen in spectra from e.g., Suzaku (Rivers et al., 2010); an attempt at adding in the feature produced minimal () improvements in along with very poorly constrained energy, width, and height. Without the feature, the CUTOFFPL continuum produces equally acceptable results as compared to the PLCUT continuum.
The addition of the fundamental CRSF at keV improves the fit significantly, lowering the by . This feature can be seen primarily in the JEM-X residuals, while ISGRI, with its 20 keV lower bound, can only resolve its upper edge. The harmonic is much less significantly detected at keV, producing a drop of in in both models. Adding the harmonic sans the fundamental produces a drop of . While the spectrum is already well-fit with only one CRSF, we include both in our final models on account of their well-established existence in the literature (Cusumano et al., 1998; Makishima et al., 1999; Fritz et al., 2006; Rivers et al., 2010), and the fact that we are still capable of constraining the harmonic CRSF. Our measurement of the fundamental CRSF is compatible with the measurements by Makishima et al. (1999) and Coburn (2001), which were made using observations of the source at a similar flux, although, as will be discussed in §5, Makishima et al.’s measurement was made using a different model for the line, which could bring that result out of compatibility with ours.
An attempt was made to split 4U 1907+09’s spectra into luminosity bins as we did for 4U 1538522, but the poorer statistics for 4U 1907+09 made this unfeasible, with satisfactory fits only obtained for the brightest luminosity bin. This difficulty is illustrated by the considerably lower 5-100 keV flux of 4U 1907+09 compared to 4U 1538522- the overall flux from the full 4U 1907+09 dataset was lower than the flux for 4U 1538522, and was in fact considerably lower than the flux from our lowest-luminosity dataset for 4U 1538522 (compare Table 6 with Tables 4 and 5).
| Continuum | POWERLAW | CUTOFFPL+BUMP | |
|---|---|---|---|
| Normalization | aaUnits: photons cm-2 s-1 at 1 keV | ||
| 5-100 keV flux | bbUnits: erg cm-2 s-1 | ||
| keV | |||
| keV | |||
| keV | |||
| keV | |||
| keV | |||
| keV | |||
| JEM-X 1 normalization | |||
| JEM-X 2 normalization | |||
| (dof) | |||
5. Discussion
5.1. Torque Reversal
Our pulse period measurements for 4U 1538522 show evidence for a torque reversal in late 2008 or early 2009, although no significant spectral changes are detected that could shed light on a mechanism for this change. Pulse period evolution in accreting neutron stars like 4U 1538522 is primarily driven by the interaction between the accreting material and the magnetic field of the star. As the field lines are locked into the neutron star, they rotate with the star, and the infalling material can exert a torque on the star. Changes in the accretion rate can thus produce changes in the pulse period, but the relationship between accretion rate and torque can be very complex due to the interaction between the accreting material, which may or may not form an accretion disk, and the magnetic field of the neutron star. 4U 1538522 is primarily a wind-accretor, as the main-sequence companion QV Nor is likely not overfilling its Roche lobe (Reynolds et al., 1992), so it is unlikely that the accreted material comes in with sufficient angular momentum to form a persistent disk, although there may be transient disk formation. However, to our knowledge, no searches for features that might indicate the existence of a transient disk (i.e. a few mHz QPO) have been performed.
The wind-accreting nature of the source, while it can explain short-timescale variations in pulse period, makes it more difficult to explain the long-term spin-up or spin-down trends observed. The torque reversal in particular is interesting: torque reversals observed in other sources have typically included large shifts in luminosity and/or dramatic spectral shifts (see, e.g., 4U 162667, Camero-Arranz et al., 2010). In 4U 1538522, we see no shift in the X-ray luminosity across the reversal, and the spectral parameters generally do not exhibit significant changes. Similar to 4U 162667 (Camero-Arranz et al., 2010) and 4U 1907+09 (Inam et al., 2009), the spin-up and spin-down rates on either side of the reversal are similar: Hz s-1 for the current spin-down trend, compared to a spin-up of Hz s-1 between 1990 and 2009. In the case of 4U 1907+09’s most recent torque reversal, Inam et al. suggested that the model of Perna et al. (2006) may be useful, as they are able to produce torque reversals without large changes in luminosity or . However, this generally requires an Alfvén radius comparable to the corotation radius of the neutron star to produce the localized propellor effect on which the Perna et al. model relies. 4U 1538522’s slow rotation speed means its m corotation radius is 1-2 orders of magnitude larger than its Alfvén radius, which is m if spherical accretion is assumed (Lamb et al., 1973), so the recycling mechanism of the Perna et al. model is unlikely to be in effect. Meanwhile, Rubin et al. (1997) modeled 4U 1538522’s spin-up trend of as simply the consequence of a random-walk in the pulse frequency derivative (stemming from a random-walk in the accretion torque on the neutron star), and proposed that this alone could be the source of the 1990 reversal, which would allow for the constancy of the system across the reversals. However, the nearly twenty year spin-up trend clearly indicates that the system is not solely random-walking – while for Rubin et al., the expectation value for the frequency shift was within a factor of three of the observed shift, the most recent pulse period measurements are a factor of larger than the expected RMS excursion. Without observations tracking the actual torque reversals (as was the case with 4U 1907+09), it is difficult to address the torque reversal in any more depth.
5.2. Cyclotron Line Variability
We detect absorption-like features, modeled as lines with Gaussian optical depth profiles, at and keV in 4U 1538522 and and keV in 4U 1907+09, which we identify as CRSFs. These features are produced by the quantization of cyclotron motion in the strong magnetic field of the neutron star - photons with the appropriate energy and momentum to excite an electron into a new Landau level will see an increased scattering cross-section. This manifests as a set of absorption-like features produced when photons are scattered out of the line of sight. For magnetic fields of strength G, the magnetic field strength can be approximated from the energy of the fundamental cyclotron line via the “12-B-12” rule: , where is the gravitational redshift in the scattering region and is the magnetic field strength in units of G. If we assume our measured CRSF energies reflect the magnetic field at the stellar surface, this implies a magnetic field strength of G for 4U 1538522 and G for 4U 1907+09. Here, we have used masses for 4U 1538522 of and M⊙ as determined by Rawls et al. (2011), and we have assumed a mass of M⊙ for 4U 1907+09. We have assumed a radius of km for both sources.
A more in-depth investigtion of the cyclotron line scattering region has been carried out by Becker et al. (2012), who predict the behavior of the CRSF in response to the luminosity of the source. In the supercritical regime, above the effective Eddington luminosity of the accretion column, they demonstrate that the height of the scattering region should scale with luminosity, producing a negative correlation between CRSF energy and luminosity, as the scattering region moves up into regions of weaker magnetic field. Meanwhile, in subcritical sources, the infalling material comes to a halt via a combination of gas and radiation pressure. An increase in luminosity means less gas pressure is necessary, lowering the scattering region and producing a positive -luminosity correlation. At even lower luminosity, below the Coulomb stopping limit defined by Becker et al., the sum total gas and radiation pressure does not halt the infalling material before it impacts the star, and the scattering should happen at or near the stellar surface. Here, the predicted behavior of the cyclotron line energy is somewhat uncertain, although Becker et al. suggest that there should not be any large correlation of with luminosity.
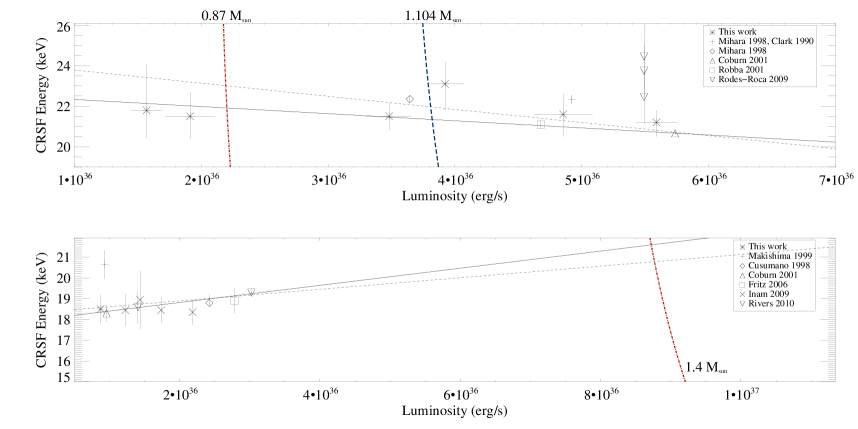
Adopting distances of kpc for 4U 1538522 (Reynolds et al., 1992) and kpc for 4U 1907+09 (Cox et al., 2005) and determining the luminosity based on the 5-100 keV flux, we calculated and using Becker et al.’s formulae and found that both sources lie firmly in the subcritical () regime, around or below . The exact location of 4U 1538522 relative to varies depending on which mass is used: with the very low-mass elliptical result, the measured luminosities for the source lie mostly above the cutoff, while the higher-mass circular solution has the source straddling the line. With no published mass measurements for 4U 1907+09, we assume the canonical neutron star parameters of M⊙ and km, which places the source far below the cutoff. While the value for can vary widely with mass (), unless 4U 1907+09 has a very low mass similar to 4U 1538522 it is unlikely for it to move above with an updated mass value. Our values for CRSF vs. luminosity are plotted against for both sources in Figure 6. To supplement this work’s results, we also include the historical measurements of the energy of the primary CRSF for each source, limited to cases where the luminosity or flux was provided or could be derived from models. Based on our measured luminosity errors, we have assumed an error of 3% for these luminosity values.
Of course, when comparing results from different references, the issue of model choice must be addressed. Several analyses of 4U 1538522 and 4U 1907+09 used a combination of the NPEX continuum and pseudo-Lorentzian line profiles for the CRSFs. This choice of models results in overall lower measured energies for the cyclotron lines and larger line widths compared to work that used Gaussians or the GAUABS model we have used. A formal treatment of this difference would be beyond the scope of this work: Mihara (1995) provides the analytical expression for the energy of the maximum of the pseudo-Lorentzian model, which one would expect to be close to the measured energy using a symmetric line shape, but the quantity is width-dependent (), and Müller et al. (2012a) point out that the width of the line can vary with choice of continuum model (e.g., for 4U 1907+09, Makishima et al. (1999), using NPEX, find a width of keV, while Inam et al. (2009) find widths of keV when they use PLCUT). With this being the case, we opted to simply fit our data with a pseudo-Lorentzian (the CYCLABS model in XSPEC), obtaining values for that were, on average, keV lower than those we found using GAUABS. This is roughly what one would expect using Mihara (1995)’s expression with a width of keV.
To investigate the correlation between luminosity and CRSF energy, we performed linear fits and calculated 90% error bars for the available references for each source; however, due to the systematic uncertainty introduced by correcting for the Lorentzian-modeled points, we defined two datasets for each source: the first only taking into account those results that used Gaussian line profiles similar to this work, the second with the “corrected” Lorentzian-modeled values as well as the Gaussian-modeled lines. The historical data for each source is insufficient to draw any conclusions based on the Lorentzian-modeled data alone. For 4U 1538522, the Gaussian-modeled data amounts to eight points: the six values from Table 5, along with measurements by Robba et al. (2001) and Coburn (2001). A linear fit to these data finds a slope of keV/( erg s-1), consistent with zero. Pearson’s for this dataset is -0.4; with six degrees of freedom, this is consistent with no correlation. If we attempt to include the Lorentzian-modeled points in addition to the Gaussian-modeled points, the size of the applied correction becomes a deciding factor: any correction larger than keV results in a negative slope inconsistent with zero, with our +1.75 keV shift resulting in a slope of keV/( erg s-1). Pearson’s with this correction applied is , still suggesting no correlation even with the additional data, although this is tempered by the large error bars on several of the datapoints. For 4U 1907+09, the Gaussian-modeled dataset consists of this work along with the results of Cusumano et al. (1998), Coburn (2001), Fritz et al. (2006), and Rivers et al. (2010). A linear fit to these data produces a positive slope of keV/( erg s-1) and a Pearson’s of 0.92, indicative of a correlation at the level. However, we should note that this positive slope is dependent to some extent on the measurements of Rivers et al. (2010) - specfically, the higher-luminosity measurement of the CRSF. When that point is excluded from the dataset, Pearson’s r is still 0.93, but the slope is no longer significant at the 90% level, returning a value of keV/( erg s-1). This weakens somewhat any conclusion that 4U 1907+09 definitely has any CRSF-luminosity correlation. The discrepancy in the effect of correcting the Lorentzian-modeled results of Makishima et al. (1999) and Inam et al. (2009) makes the inclusion of these points more suspect than was the case for 4U 1538522. Nonetheless, including the Lorentzian-modeled points, regardless of whether they are “corrected” upwards or not, often still results in a positive slope. Only when the shift is greater than keV, or the Rivers et al. (2010) point is excluded does the slope become consistent with zero.
Considering the possibility of a correlation between CRSF energy and luminosity in 4U 1907+09, it should be noted that a CRSF energy-luminosity correlation at this low of a luminosity has not been seen until now. The only source of comparable luminosity to 4U 1538522 or 4U 1907+09 with a well-studied luminosity vs. cyclotron line energy relationship is A 0535+26 (Caballero et al., 2007), which shows no long-term trend. A 0535+26’s positive trend is limited to the pulse-to-pulse analysis by Klochkov et al. (2011), which only covers higher-luminosity observations where the source was above 222The astute reader may note that Reig & Nespoli (2013) also saw evidence for a positive trend in RXTE/PCA data from A 0535+26’s 2009 giant outburst. Nespoli et al. (2013), however, note that this trend was likely in part due to an oversubtraction of the PCA background, reducing the significance of the Reig & Nespoli results.. With 4U 1538522 and 4U 1907+09 operating at , the potential presence of a correlation is thus rather interesting - while the theoretical predictions for this luminosity regime are still somewhat speculative, the general concept was that at low luminosities, the scattering region would be essentially at the surface of the star, and an increase in luminosity would either do nothing, or lift the scattering region up off the surface of the star, producing a negative trend in luminosity vs. cyclotron line energy. We see something like this in 4U 1538522, which potentially has a negative slope in L-vs.-E space. However, 4U 1907+09 shows evidence for a positive correlation. This would make 4U 1907+09 the fourth CRSF source to display a positive correlation with luminosity, after Hercules X-1 (Staubert et al., 2007), A 0535+26 (Klochkov et al., 2011), and GX 3041 (Yamamoto et al., 2011). Hercules X-1 and GX 3014 have L-vs.-E slopes of similar magnitude to 4U 1907+09, but they operate in a distinctly different luminosity regime, at . The existence of a correlation in 4U 1907+09 would make the source somewhat of an outlier, with its luminosity sitting as far below and as it is. However, the weakness of the correlation and the low luminosity of the source make a conclusive determination difficult with the quality of data available.
6. Summary
We have presented a spectral and timing analysis of the public INTEGRAL data for the high-mass X-ray binaries 4U 1538522 and 4U 1907+09. Our pulse period measurements for 4U 1538522 support the Fermi GBM pulsar monitoring project’s observation of a switch to a spin-down trend starting sometime in 2009, with our measured pulse periods agreeing strongly with their results. The source shows no significant spectral changes between its spin-up and spin-down epochs, and neither does its spectrum change much between higher and lower luminosities. We update the spectral results for 4U 1907+09 to include the latest public INTEGRAL data, the results agreeing with much of the recent work on the source. In both sources, we detect two absorption features, identified as cyclotron scattering resonance features. The fundamental CRSF in each source is detected very significantly at and keV in 4U 1538522 and 4U 1907+09, respectively, with harmonics detected in 4U 1538522 at keV and in 4U 1907+09 at keV. An examination of our results along with those of past work reveals a possible negative correlation between CRSF energy and luminosity in 4U 1538522, while 4U 1907+09’s CRSF energy-luminosity relationship has evidence for a positive slope, making it the fourth cyclotron line source to display this relationship.
References
- Arnaud (1996) Arnaud, K. A. 1996, in Astronomical Society of the Pacific Conference Series, Vol. 101, Astronomical Data Analysis Software and Systems V, ed. G. H. Jacoby & J. Barnes, 17
- Baykal et al. (2006) Baykal, A., İnam, S. c., & Beklen, E. 2006, A&A, 453, 1037
- Becker & Wolff (2007) Becker, P. A., & Wolff, M. T. 2007, ApJ, 654, 435
- Becker et al. (2012) Becker, P. A., Klochkov, D., Schönherr, G., et al. 2012, A&A, 544, A123
- Becker et al. (1977) Becker, R. H., Swank, J. H., Boldt, E. A., et al. 1977, ApJ, 216, L11
- Şahiner et al. (2011) Şahiner, Ş., Inam, S. Ç., & Baykal, A. 2011, in American Institute of Physics Conference Series, Vol. 1379, American Institute of Physics Conference Series, ed. E. Göğüş, T. Belloni, & Ü. Ertan, 214–216
- Şahiner et al. (2012) Şahiner, Ş., Inam, S. Ç., & Baykal, A. 2012, MNRAS, 421, 2079
- Caballero et al. (2007) Caballero, I., Kretschmar, P., Santangelo, A., et al. 2007, A&A, 465, L21
- Camero-Arranz et al. (2010) Camero-Arranz, A., Finger, M. H., Ikhsanov, N. R., Wilson-Hodge, C. A., & Beklen, E. 2010, ApJ, 708, 1500
- Chernyakova et al. (2010) Chernyakova, M., Neronov, A., Walter, R., & Courvoisier, T. 2010, IBIS Analysis User Manual, INTEGRAL Science Data Centre
- Clark (2000) Clark, G. W. 2000, ApJ, 542, L131
- Clark (2004) Clark, G. W. 2004, ApJ, 610, 956
- Clark et al. (1990) Clark, G. W., Woo, J. W., Nagase, F., Makishima, K., & Sakao, T. 1990, ApJ, 353, 274
- Coburn (2001) Coburn, W. 2001, Phd, University of California, San Diego
- Corbet et al. (1993) Corbet, R. H. D., Woo, J. W., & Nagase, F. 1993, A&A, 276, 52
- Cox et al. (2005) Cox, N. L. J., Kaper, L., & Mokiem, M. R. 2005, A&A, 436, 661
- Crampton et al. (1978) Crampton, D., Hutchings, J. B., & Cowley, A. P. 1978, ApJ, 225, L63
- Cusumano et al. (1998) Cusumano, G., di Salvo, T., Burderi, L., et al. 1998, A&A, 338, L79
- Davison (1977) Davison, P. J. N. 1977, MNRAS, 179, 35P
- Davison et al. (1977) Davison, P. J. N., Watson, M. G., & Pye, J. P. 1977, MNRAS, 181, 73P
- Finger et al. (2009) Finger, M. H., Beklen, E., Narayana Bhat, P., et al. 2009, in 2009 Fermi Symposium
- Fritz et al. (2006) Fritz, S., Kreykenbohm, I., Wilms, J., et al. 2006, A&A, 458, 885
- Giacconi et al. (1971) Giacconi, R., Kellogg, E., Gorenstein, P., Gursky, H., & Tananbaum, H. 1971, ApJ, 165, L27
- Giacconi et al. (1974) Giacconi, R., Murray, S., Gursky, H., et al. 1974, ApJS, 27, 37
- Ilovaisky et al. (1979) Ilovaisky, S. A., Chevalier, C., & Motch, C. 1979, A&A, 71, L17
- in ’t Zand et al. (1998) in ’t Zand, J. J. M., Baykal, A., & Strohmayer, T. E. 1998, ApJ, 496, 386
- Inam et al. (2009) Inam, S. Ç., Şahiner, Ş., & Baykal, A. 2009, MNRAS, 395, 1015
- Klein et al. (1996) Klein, R. I., Arons, J., Jernigan, G., & Hsu, J. J.-L. 1996, ApJ, 457, L85
- Klochkov et al. (2011) Klochkov, D., Staubert, R., Santangelo, A., Rothschild, R. E., & Ferrigno, C. 2011, A&A, 532, A126
- Kostka & Leahy (2010) Kostka, M., & Leahy, D. A. 2010, MNRAS, 407, 1182
- Lamb et al. (1973) Lamb, F. K., Pethick, C. J., & Pines, D. 1973, ApJ, 184, 271
- Larsson (1996) Larsson, S. 1996, A&AS, 117, 197
- Leahy et al. (1983) Leahy, D. A., Darbro, W., Elsner, R. F., et al. 1983, ApJ, 266, 160
- Lebrun et al. (2003) Lebrun, F., Leray, J. P., Lavocat, P., et al. 2003, A&A, 411, L141
- Lund et al. (2003) Lund, N., Budtz-Jørgensen, C., Westergaard, N. J., et al. 2003, A&A, 411, L231
- Makishima et al. (1984) Makishima, K., Kawai, N., Koyama, K., et al. 1984, PASJ, 36, 679
- Makishima et al. (1987) Makishima, K., Koyama, K., Hayakawa, S., & Nagase, F. 1987, ApJ, 314, 619
- Makishima et al. (1999) Makishima, K., Mihara, T., Nagase, F., & Tanaka, Y. 1999, ApJ, 525, 978
- Marshall & Ricketts (1980) Marshall, N., & Ricketts, M. J. 1980, MNRAS, 193, 7P
- Meszaros & Nagel (1985) Meszaros, P., & Nagel, W. 1985, ApJ, 299, 138
- Mihara (1995) Mihara, T. 1995, PhD thesis, Dept. of Physics, Univ. of Tokyo
- Mihara et al. (1998) Mihara, T., Makishima, K., & Nagase, F. 1998, Advances in Space Research, 22, 987
- Mukherjee et al. (2006) Mukherjee, U., Raichur, H., Paul, B., Naik, S., & Bhatt, N. 2006, Journal of Astrophysics and Astronomy, 27, 411
- Müller et al. (2012a) Müller, S., Ferrigno, C., Kühnel, M., et al. 2012a, A&A, in press
- Müller et al. (2012b) Müller, S., Kühnel, M., Caballero, I., et al. 2012b, A&A, 546, A125
- Nespoli et al. (2008) Nespoli, E., Fabregat, J., & Mennickent, R. E. 2008, A&A, 486, 911
- Nespoli et al. (2013) Nespoli, E., Klochkov, D., Caballero, I., Reig, P., & Kretschmar, P. 2013, in Spectral/Timing Properties of accreting objects: from X-ray binaries to AGN, ESA/ESAC, Madrid, Spain
- Perna et al. (2006) Perna, R., Bozzo, E., & Stella, L. 2006, ApJ, 639, 363
- Rawls et al. (2011) Rawls, M. L., Orosz, J. A., McClintock, J. E., et al. 2011, ApJ, 730, 25
- Reig & Nespoli (2013) Reig, P., & Nespoli, E. 2013, A&A, 551, A1
- Reynolds et al. (1992) Reynolds, A. P., Bell, S. A., & Hilditch, R. W. 1992, MNRAS, 256, 631
- Rivers et al. (2010) Rivers, E., Markowitz, A., Pottschmidt, K., et al. 2010, ApJ, 709, 179
- Robba et al. (2001) Robba, N. R., Burderi, L., Di Salvo, T., Iaria, R., & Cusumano, G. 2001, ApJ, 562, 950
- Rodes-Roca et al. (2010) Rodes-Roca, J. J., Page, K. L., Torrejón, J. M., Osborne, J. P., & Bernabéu, G. 2010, A&A, 526, A64
- Rodes-Roca et al. (2009) Rodes-Roca, J. J., Torrejón, J. M., Kreykenbohm, I., et al. 2009, A&A, 508, 395
- Rubin et al. (1997) Rubin, B. C., Finger, M. H., Scott, D. M., & Wilson, R. B. 1997, ApJ, 488, 413
- Schönherr et al. (2007) Schönherr, G., Wilms, J., Kretschmar, P., et al. 2007, A&A, 472, 353
- Schwarm (2013) Schwarm, F. 2013, Phd, University of Erlangen-Nuremberg
- Schwarm et al. (2013) Schwarm, F.-W., Schönherr, G., Becker, P. A., et al. 2013, in AAS/High Energy Astrophysics Division, Vol. 13, AAS/High Energy Astrophysics Division
- Staubert et al. (2007) Staubert, R., Shakura, N. I., Postnov, K., et al. 2007, A&A, 465, L25
- Ubertini et al. (2003) Ubertini, P., Lebrun, F., Di Cocco, G., et al. 2003, A&A, 411, L131
- van Kerkwijk et al. (1989) van Kerkwijk, M. H., van Oijen, J. G. J., & van den Heuvel, E. P. J. 1989, A&A, 209, 173
- van Kerkwijk et al. (1995) van Kerkwijk, M. H., van Paradijs, J., & Zuiderwijk, E. J. 1995, A&A, 303, 497
- Yamamoto et al. (2011) Yamamoto, T., Sugizaki, M., Mihara, T., et al. 2011, PASJ, 63, 751