Leidenfrost temperature increase for impacting droplets on carbon-nanofiber surfaces
Abstract
Droplets impacting on a superheated surface can either exhibit a contact boiling regime, in which they make direct contact with the surface and boil violently, or a film boiling regime, in which they remain separated from the surface by their own vapor. The transition from the contact to the film boiling regime depends not only on the temperature of the surface and kinetic energy of the droplet, but also on the size of the structures fabricated on the surface. Here we experimentally show that surfaces covered with carbon-nanofibers delay the transition to film boiling to much higher temperature compared to smooth surfaces. We present physical arguments showing that, because of the small scale of the carbon fibers, they are cooled by the vapor flow just before the liquid impact, thus permitting contact boiling up to much higher temperatures than on smooth surfaces. We also show that, as long as the impact is in the film boiling regime, the spreading factor of impacting droplets follows the same scaling (with the Weber number) found for smooth surfaces, which is caused by the vapor flow underneath the droplet.
Catalytic Processes and Materials, University of Twente, P. O. Box 217, 7500 AE Enschede, The Netherlands \alsoaffiliationMESA+ Institute for Nanotechnology, University of Twente, P. O. Box 217, 7500 AE Enschede, The Netherlands \altaffiliationThese authors contributed equally to this work. \altaffiliationThese authors contributed equally to this work. \altaffiliationPresent address: School of Mechanical and Aerospace Engineering, Nanyang Technological University, 50 Nanyang Avenue, Singapore 639798 \alsoaffiliationMESA+ Institute for Nanotechnology, University of Twente, P. O. Box 217, 7500 AE Enschede, The Netherlands \alsoaffiliationDepartment of Mechanical Engineering, Johns Hopkins University, Baltimore, MD 21218, USA \alsoaffiliationMESA+ Institute for Nanotechnology, University of Twente, P. O. Box 217, 7500 AE Enschede, The Netherlands \alsoaffiliationMESA+ Institute for Nanotechnology, University of Twente, P. O. Box 217, 7500 AE Enschede, The Netherlands
1 Introduction
Spray cooling is an effective heat transfer mechanism as it is capable of delivering spatially uniform and high heat transfer rates (see e.g.1, 2, 3). An important new application of this technology is in electronic cooling, where the growing power consumption and decreasing sizes pose increasingly challenging heat dissipation demands (see e.g. 4, 5). Other common situations in which cold drops impact hot surfaces are found in internal combustion engines (see e.g. 6, 7), quenching of aluminum and steel (see e.g. 8), fire suppression (see e.g. 9, 10) and others.
In all these applications a stream of fine droplets dispensed, e.g., from a nozzle impinges on a solid surface and cools it by a combination of sensible heat absorption and latent heat of vaporization. Due to the inherent complexity of the phenomenon and the large number of parameters involved, such as droplet size, velocity distribution, droplet number density and material properties, many aspects of the physical mechanisms involved still remain incompletely understood1, 11, 12.
A fundamental understanding of the impact of an individual droplet on superheated surfaces is the first step toward a better understanding and eventual optimization of the process. Various aspects of this particular problem have been investigated, such as the effect of droplet size, velocity, physical properties (see e.g. 13, 14), and surface roughness (see e.g. 15, 16), the transition between different boiling regimes (see e.g. 17, 18, 19, 20, 16), the surface temperature change and heat transfer during impact (see e.g. 15, 21, 22, 23), the residence time of the impacting droplet (see e.g. 24, 16), the spreading factor (see e.g. 25, 20, 16) and others.
An important quantitative feature of the phenomenon is the transition temperature between the contact boiling regime, where the liquid makes direct contact with the heated surface, and the film boiling regime, where a stable vapor layer between the liquid and the surface is formed during impact. As the rate of heat transfer in the film boiling regime is significantly reduced due to the poor thermal conductivity of the vapor layer, this regime should be avoided for applications that require high heat transfer rates. Methods to increase , or delay the onset of the film boiling regime, are therefore of great interest for such applications.
Recently, surfaces covered with nanofibers were shown to effectively enhance the heat transfer from the surface to a liquid in contact with it23, 26. In particular, it was reported that for impacting ethanol droplets on surfaces covered with nanofiber mats, the film boiling behavior was not observed even when the surface temperature was as high as 300C22, which implies that the transition temperature to film boiling is increased compared to that observed on smooth surfaces. This is in marked contrast with the impact on surfaces covered with microstructures, for which the transition temperature is considerably decreased compared to a smooth surface 16. Indeed, numerous questions regarding the effects of nanostructures on the transition temperature are still open. First of all, why do nanofibers cause a higher compared to that on smooth surfaces? And, further, what is the transition temperature on this type of surfaces? how does it change with the size of the nanostructures on the surfaces?
To answer these questions, in this paper we study the impact of droplets on heated surfaces covered with carbon nanofibers (CNF), which are carbonaceous structures grown by catalytic vapor deposition of hydrocarbons. This type of nanostructures is well-known for their unique physical and chemical properties with a tunable morphology (the diameter can be varied from a few to hundreds of nanometers, the height can be controlled from a few micrometers to millimeters), which in turn can be exploited for tuning the roughness, porosity, and surface area27.
We use two types of CNF surfaces corresponding to two different typical fiber lengths and a smooth silicon surface. For each type of surface, we determine the transition temperature and its dependence on the impact velocity. We propose a quantitative explanation of the effect of nanofibers on the transition temperature . Furthermore, for impact of droplets in the film boiling regime, we measure the spreading factor and compare our data with existing models.
2 Experimental details
2.1 Synthesis of carbon nanofiber layers
Carbon nanofibers (CNFs) were synthesized on oxidized silicon wafers (p-type, Ohm-cm resistivity, mm diameter, µm thickness, crystal orientation; Okmetic Finland) using nickel (Ni) thin film as catalyst. First, a \ceSiO2 layer of 220 nm thickness was grown via wet oxidation (45 min, C) on these silicon substrates. Second, a pattern was defined in spin-coated photoresist (Olin, 906-12), resulting in unmasked squares of 8 mm8 mm, by means of standard UV lithography (EVG 620). Further, a 10 nm tantalum layer followed by a 25 nm nickel layer was deposited via electron-beam evaporation. Finally the samples were subjected to an ultrasonic lift-off step in acetone (min; VLSI 100038, BASF), followed by rinsing in water and spin drying. These nickel-coated substrates were diced into 1 cm1 cm samples (Disco DAD-321 dicing machine). To remove organic contaminants, these samples were ultrasonically cleaned in acetone (10 min, Branson 200 ultrasonic cleaner) and de-ionized water (2 min, 25∘C). 28
After drying with synthetic air, the samples were placed centrally on a flat quartz boat inside a quartz reactor and were loaded into a horizontal oven equipped with three temperature controllers along it. Nitrogen (\ceN2; 99.999 %, INDUGAS NV.) was used as carrier gas during heating, pretreatment, CNF synthesis and cooling. First, the temperature was increased (K min-1) to 500C. Second, the samples were pretreated with 20 vol. % of hydrogen (\ceH2; 99.999 %, INDUGAS NV.) for 2 hours at a total flow rate of 50 ml min-1 in order to reduce the passivated \ceNi thin film. Subsequently the temperature was increased (K min-1) to 635C, at which temperature the CNF synthesis was performed via catalytic vapor decomposition using 25 vol. % ethylene (\ceC2H4; 99.95 % Praxair Inc.) and 6.25 vol. % \ceH2 in a total flow rate 100 ml min-1. Finally the samples were cooled down to room temperature (K min-1).
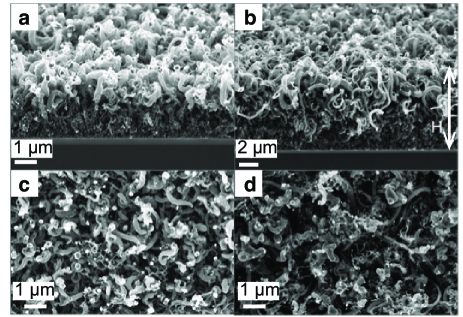
Two sets of samples were used for the droplet impact studies. One set was obtained after a CNF synthesis time of 11 min, resulting in a CNF layer thickness 3.40.3 µm. The other set was obtained after a CNF synthesis time of 14 min, resulting in a CNF layer thickness of 7.50.7 µm. More details of the influence of synthesis time on CNF layer thickness have been reported previously 28. These samples will be termed as CNF(3.5) and CNF(7.5), respectively. 1 shows representative scanning electron microscope (SEM) images with the side views (1(a) and (b)) and top views (1(c) and (d)) of the surfaces CNF(3.5) and CNF(7.5).
The thickness of the CNF layers was determined using 5 representative cross-sectional SEM images taken at various positions on the sample (10 height measurements were averaged per SEM image). The width of the nanofibers ranges from 32 nm to 220 nm with average value of 127 nm.
2.2 Experimental method

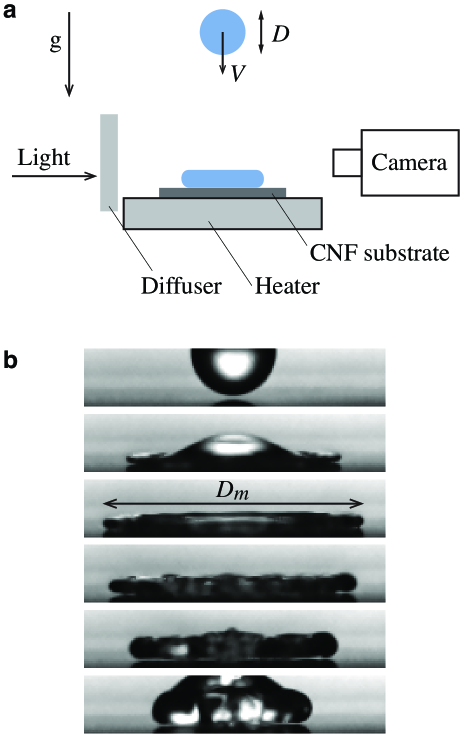
A schematic diagram of the experimental setup is shown in 2. All droplet impact experiments were performed with FC-72 (3M Fluorinert Electronic Liquid), a dielectric fluid commonly used in electronics cooling applications. The liquid has boiling point C, density kg m-3, and surface tension N m-1. We generate droplets by using a syringe pump (PHD 2000 Infusion, Harvard Apparatus) to inject liquid into a small fused silica needle where the droplets are formed at the tip. The flow rate is kept at a small value (mL min-1) so that droplet detachment from the needle is due only to gravitational force, hence keeping the droplet size uniform. After detaching from the needle, a droplet falls on the target surface placed on a brass plate with a cartridge heater and a thermocouple (Omega Inc.) embedded inside. The surface temperature was set by a controller and was varied between and . This temperature was also measured independently by a surface temperature probe (Tempcontrol B.V.). The difference between the controller’s set point and the surface probe measurement was less than . Thus we take the controller’s set point as the surface temperature of the surface.
Recordings of the impact events were made with a high-speed camera (Photron SA1.1) (see 2). From these high-speed recordings, the boiling behaviors were analyzed, and the droplet diameter , the impact velocity and the maximum spreading diameter (see 2) were measured. From the measured diameter and velocity, we calculated the Weber number , which is a dimensionless number that characterizes the droplet’s kinetic energy compared to its surface energy. The impact velocity was varied by changing the needle’s height. Impact events were repeated at least three times for every combination of and to test reproducibility of the experiment.
2.3 Characterization of boiling behavior
By varying the surface temperature between and 450C and the Weber number between 10 and 1000, we observed two characteristic boiling behaviors: contact boiling and film boiling. In 3 we show two series of images to illustrate the difference between these two regimes. The essential difference between the two is whether or not the liquid makes direct contact with the heated surface during impact 29, 20, 30. In the contact boiling regime (3(a)), as the pressure of the vapor generated underneath the droplet is not sufficient to support the droplet’s dynamic pressure, the liquid touches the heated surface and quickly boils due to the high heat flux through the contact area. The recorded snapshots show the small droplets ejected as a result of the boiling process. In contrast, an impacting droplet in the film boiling regime is separated from the heated surface by a developing vapor layer (see 3(b)). This vapor layer insulates the droplet during the impact time, hence prevents the liquid from boiling violently.
By carefully analyzing the recorded movies of impacting droplets, we categorized the impact as being in the film boiling regime when droplet ejection or vapor bubble generation were not observed.
3 Results and discussions
3.1 Dynamic Leidenfrost temperature
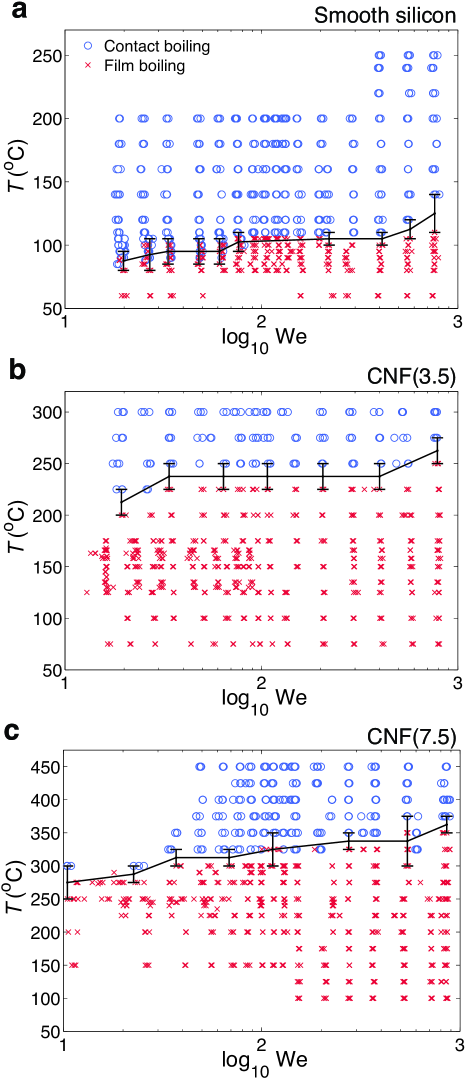
In 4 we show phase diagrams of the characteristic boiling behavior of impacting droplets on smooth silicon surfaces, CNF(3.5), and CNF(7.5), respectively. The temperature ranges were to for the smooth silicon surfaces, to for the CNF(3.5) surfaces, and C to 450C for the CNF(7.5) surfaces. In each phase diagram, there is a clear transition between the contact and the film boiling regimes. This transition temperature is marked by a solid line, with the vertical bars indicating the intermediate region where both boiling behaviors were observed. The transition temperature, known as the dynamic Leidenfrost temperature , increases with increasing kinetic energy of impacting droplets. This dependence of on is qualitatively similar to that found previously for droplets impacting on smooth and micro-structured surfaces 15, 20, 16, and is expected: the increasing momentum of the impact forces the droplet into contact with the surface at larger and larger temperature.
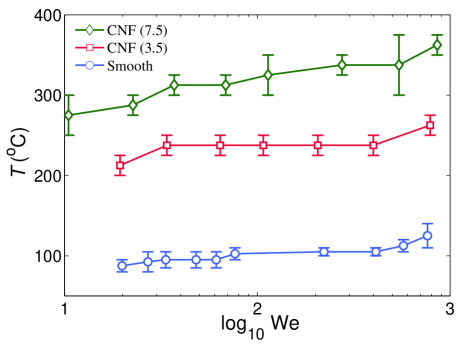
These results, however, are in stark contrast with those found for smooth and microstructured surfaces in two respects, as can be seen from 5 in which for the smooth and CNF surfaces is compared. The first unexpected finding is that, while is lower for microstructured surfaces as compared with smooth ones 16, it is actually higher in the case of carbon nanofibers. For example, for , for the smooth surface is 110C, whereas for CNF(3.5) and CNF(7.5) it increases to 250C and 350C, respectively. Secondly, increases with nanofiber length, again in contrast with surfaces covered with micrometer-size pillars for which, for given shape and spacing, the microstructure height is inversely correlated with 16. The tentative explanation of that latter finding offered in Ref. 16 is that the surface of the impacting liquid tends to penetrate the space between the pillars. This causes the liquid surface area to increase, the more the higher the pillars. As a consequence, the vapor generation rate also increases and the film boiling regime sets in at a lower temperature.
As explanation of the opposite behavior found with carbon nanofibers we suggest that they are efficiently cooled by the vapor flow before the drop touches the CNF surface. To support this conjecture in the following subsection we will estimate the time scale for the temperature of the nanofibers to cool, and compare it with the time scale the nanofiber is exposed to the vapor flow (which will be found to be somewhat larger), and also with the time scale for the heat flow inside the nanofiber (which will be found to be much larger).
3.2 Estimate of the relevant time scales
We start with the estimate for the time scale for the cooling of the nanofibers by the “vapor wind”. Since the cross section of the nanofibers is of the order of 100 nm, the time scale can be estimated by assuming their temperature to be uniform, which is the so-called lumped capacitance approximation (see e.g. 31). This time scale can then be estimated to be
| (1) |
in which is the diameter of the nanofiber, and its density and specific heat, and the heat transfer coefficient. The latter can be expressed in terms of a Nusselt number, , with the vapor thermal conductivity, so that
| (2) |
in which , , and are the vapor density, specific heat, and thermal diffusivity, respectively. The (approximate) proportionality of to the square of the fiber size is a particularly noteworthy feature of this expression. In standard correlations (see e.g. 31), Nu is given as a function of the fluid Prandtl and Reynolds numbers. No measured value for the former seems to be available for FC-72 vapor, but it is well known that the Prandtl number of gases is close to 1 and we can safely use this estimate here. Estimation of the Reynolds number requires a value for the viscosity of the vapor which, again, does not seem to have been measured. The order of magnitude of the viscosity of many gases and vapors is 10-5 Pa s, and this is the value we will use. The density of FC-72 vapor at the boiling point 56 ∘C is about 11.5 kg/m3. Taking 100 nm and using these values we then find , with the vapor velocity in m/s. This quantity has been estimated in 16 (see equation (13) of that paper) where it was found to be of the order of
| (3) |
with the liquid density, the liquid-surface temperature difference, the latent heat and the vapor Prandtl number. With = 1680 kg/m3, = 88 kJ/kg, = 910 J/kg K and = 11.5 kg/m3 (values at 56 ∘C), 100 K, the impact velocity 1 m/s and again taking 1, we find 12 m/s so that . The Churchill-Bernstein correlation 31 then gives a Nusselt number of about 1. Use of equation (2) requires values of or , neither of which seems to be available. For many gases and vapors is of the order of 10-5 m2/s. With this estimate, taking 2267 kg/m3, 709 J/kg K and, again, 100 nm, we find from eq. (2) 150 ns.
This time scale has to be compared with the characteristic time during which the fiber is exposed to the cooler vapor until the liquid makes contact with it, which can be estimated as
| (4) |
where is the characteristic thickness of the vapor layer at which the drop starts being deformed due to the increasing pressure on its underside 32. Here, as above, is the droplet diameter, is the impact velocity, and is the Stokes number, where is the viscosity of vapor. Hence we obtain the time during which the nanofibers are exposed to the cooler vapor flow . In the use of this estimate we again encounter the problem that is not available but, if we use the same estimate Pa s as before and take 1 m/s, 1 mm, we find 330 ns, which is seen to be long enough to cause a substantial cooling of the fibers.
Of course, as the fibers are cooled by the vapor, heat flows towards their tips from the silicon substrate with a characteristic time
| (5) |
in which is the fiber length and its thermal diffusivity of the carbon nanofibers. Since, in this experiment, the fibers had not been heat-treated, we can estimate their thermal conductivity on the basis of the results of Ref. 33 as = 4.6 W/m K and, therefore, m2/s. For the shorter fibers 3.4 µm and, therefore, 4 µs while, for the longer fibers, 7.5 µm and 20 µs. These times are much longer than both the cooling time and the exposure time to the vapor flow, which implies that the liquid encounters fibers at a much cooler temperature than the core silicon substrate. This circumstance would explain why the CNF surfaces require a higher temperature to achieve the film boiling regime compared to the smooth surfaces, and why the transition temperature increases with the fiber length.
The size of the cross section of the fibers in our experiment is close to the cross-over value at which cooling and exposure to the vapor flow have comparable time scales. It follows that fibers or, more generally, microstructures with a larger cross section would be insensitive to the cooling effect. As a check of this expectation we can apply the same estimates to the case of the microstructured surfaces studied earlier 16. In that case the fluid was water for which, of course, all the required physical properties are well known. The microstructures had the form of silicon pillars with a square cross section of about 1010 µm2 and heights from 2 to 8 µm. The vapor velocity estimated from eq. (3), again with and 1 m/s, is found to be 12 m/s. The corresponding Reynolds number is Re 6 with a corresponding Nusselt number Nu 1.7. In this case = 2330 kg/m3, = 705 J/kg K and eq. (2) gives 6.6 ms. The exposure time to the vapor is not very different from the previous estimate, and is therefore several orders of magnitude shorter. It is evident that, in this case, the vapor flow is just a small perturbation which does not have an appreciable effect on the pillar temperature.
3.3 Spreading factor
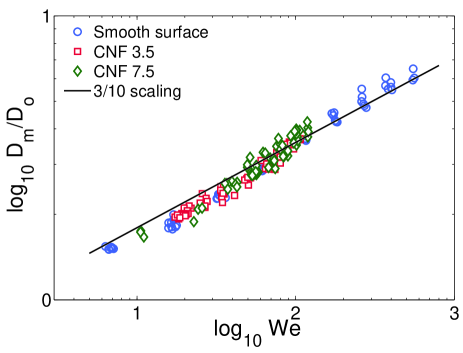
We devote this section to quantifying the spreading factor of impacting droplets in the film boiling regime. The spreading factor is defined as , where is the maximum spreading diameter. In fig. 6, we show a log-log plot of versus for all the impact experiments obtained on smooth and CNF surfaces. All the data points were collected for impacts in the film boiling regime and in the course of which the droplets did not disintegrate during the expanding phase. The Weber number ranges from 5 to 600. All data sets collected from the three different surfaces collapse on the same curve, showing that the spreading dynamics does not depend on the features and temperature of the surfaces. This result is consistent with the recent study of impacting droplets on micro-structured surfaces16, which showed that the spreading factor is independent of the microstructures and depends very weakly on the surface temperature. Moreover, the spreading factor is in agreement with the scaling . This scaling law embodies the main assumption that the spreading of the liquid is driven by the vapor flow underneath the droplet 16. As a result, we conclude that the presence of the carbon nanofibers only changes the transition temperature to film boiling of the impacting droplets, but does not affect the dynamics of the vapor flow in the film boiling regime or the liquid spreading.
4 Conclusions
We have explored the phase space of impact of FC-72 droplets on heated smooth silicon surfaces and surfaces coated with nanofibers (CNF) of different length. Unexpectedly, we have found that the dynamic Leidenfrost temperature , i.e., the transition temperature between the contact and film boiling regimes, is higher on the CNF surfaces than on smooth silicon surface. Increasing the fiber length from µm to µm causes to increase significantly due to the small time scale with which the nanofibers cool to the temperature of the vapor generated by the approaching liquid. Thus, the temperature of the fibers when contact with the liquid is established is much lower than their initial temperature. In other words, the temperature of the CNF surfaces has to be set higher than in the case of smooth silicon surfaces to bring the impact into film boiling regime. In contrast, the silicon microstructured surfaces studied in Ref.16 maintain their temperature during impact and is lower, possibly because the liquid surface area which generates the vapor is larger due to the curvature caused by the micro-pillars.
In spite of the effect on , we have found that, as long as the impact is in the film boiling regime, the spreading factor of the droplet does not depend on whether the surface is smooth or covered with carbon nanofibers, nor does it depend on the surface temperature. The spreading factor is consistent with the scaling law , which was derived based on the effect of vapor flow on the spreading dynamics16.
The increase in the dynamic Leidenfrost temperature caused by nanofibers fabricated on silicon surfaces has a considerable implication for various applications that require high operating temperature because CNF surfaces can operate at higher while still maintaining contact with the liquid.
This study was financially supported by the European Research Council ERC & FOM. We gratefully acknowledge Dr. Roald M. Tiggelaar and Stefan Schlautmann of MCS group for their assistance in the fabrication of Ni-Ta substrates for the CNF synthesis, M. Smithers (MESA+ Nanolab) for SEM imaging, B. Geerdink and Ruben Lubkemman for technical support.
References
- Kim 2007 Kim, J. Int. J. Heat Fluid Flow 2007, 28, 753 – 767
- Agostini et al. 2007 Agostini, B.; Fabbri, M.; Park, J. E.; Wojtan, L.; Thome, J. R.; Michel, B. Heat Transfer Eng. 2007, 28, 258–281
- Ebadian and Lin 2011 Ebadian, M. A.; Lin, C. X. J. Heat Transfer 2011, 133, 110801
- Pautsch and Shedd 2005 Pautsch, A. G.; Shedd, T. A. Int. J. Heat Mass Transfer 2005, 48, 3167–3175
- Visaria and Mudawar 2009 Visaria, M.; Mudawar, I. IEEE Trans. Compon. Packag. Technol. 2009, 32, 784–793
- Arcoumanis et al. 1998 Arcoumanis, C.; Cutter, P.; Whitelaw, D. S. Chem. Eng. Res. Des. 1998, 76, 124–132
- Panao and Moreira 2009 Panao, M. R. O.; Moreira, A. L. N. Int. J. Thermal Sci. 2009, 48, 1853–1862
- Mascarenhas and Mudawar 2012 Mascarenhas, N.; Mudawar, I. Int. J. Heat Mass Transfer 2012, 55, 2953–2964
- Yoon et al. 2010 Yoon, S. S.; Figueroa, V.; Brown, A. L.; Blanchat, T. K. J. Fire Sci. 2010, 28, 109–139
- Chen and Wang 2011 Chen, P.-P.; Wang, X.-S. Int. J. Heat Mass Transfer 2011, 54, 4143–4147
- Moreira et al. 2010 Moreira, A. L. N.; Moita, A. S.; Panão, M. R. Prog. Energy Combust. Sci. 2010, 36, 554–580
- Berberovic et al. 2011 Berberovic, E.; Roisman, I. V.; Jakirlic, S.; Tropea, C. Int. J. Heat Fluid Flow 2011, 32, 785–795
- Yarin 2006 Yarin, A. Annu. Rev. Fluid Mech. 2006, 38, 159–192
- Herbert et al. 2013 Herbert, S.; Gambaryan-Roisman, T.; Stephan, P. Colloids Surf. A 2013, 432, 57–63
- Bernardin et al. 1997 Bernardin, J. D.; Stebbins, C. J.; Mudawar, I. Int. J. Heat Mass Transfer 1997, 40, 247–267
- Tran et al. 2013 Tran, T.; Staat, H. J. J.; Susarrey-Arce, A.; Foertsch, T. C.; van Houselt, A.; Gardeniers, J. G. E.; Prosperetti, A.; Lohse, D.; Sun, C. Soft Matter 2013, 9, 3272–3282
- Bernardin and Mudawar 1999 Bernardin, J. D.; Mudawar, I. J. Heat Transfer 1999, 121, 894–903
- Wang et al. 2000 Wang, A. B.; Lin, C. H.; Chen, C. C. Phys. Fluids 2000, 12, 1622
- Bernardin and Mudawar 2004 Bernardin, J. D.; Mudawar, I. J. Heat Transfer 2004, 126, 272–278
- Tran et al. 2012 Tran, T.; Staat, H. J. J.; Prosperetti, A.; Sun, C.; Lohse, D. Phys. Rev. Lett. 2012, 108, 036101
- Lee et al. 2001 Lee, J.; Kim, J.; Kiger, K. Int. J. Heat Fluid Flow 2001, 22, 188–223
- Weickgenannt et al. 2011 Weickgenannt, C. M.; Zhang, Y.; Sinha-Ray, S.; Roisman, I. V.; Gambaryan-Roisman, T.; Tropea, C.; Yarin, A. L. Phys. Rev. E 2011, 84, 036310
- Weickgenannt et al. 2011 Weickgenannt, C. M.; Zhang, Y.; Lembach, A. N.; Roisman, I. V.; Gambaryan-Roisman, T.; Yarin, A. L.; Tropea, C. Phys. Rev. E 2011, 83, 036305
- Chen et al. 2007 Chen, R. H.; Chiu, S. L.; Lin, T. H. Appl. Therm. Eng. 2007, 27, 2079–2085
- Chen et al. 2007 Chen, R.-H.; Chiu, S.-L.; Lin, T.-H. Exp. Therm. Fluid Sci. 2007, 32, 587–595
- Jun et al. 2013 Jun, S.; Sinha-Ray, S.; Yarin, A. L. Int. J. Heat Mass Transfer 2013, 62, 99–111
- Bitter 2010 Bitter, J. H. J. Mater. Chem. 2010, 20, 7312–7321
- Nair et al. 2013 Nair, H.; Tiggelaar, R. M.; Thakur, D. B.; Gardeniers, J. G. E.; van Houselt, A.; Lefferts, L. Chem. Eng. J. 2013, 227, 56–65
- Fujimoto et al. 2010 Fujimoto, H.; Oku, Y.; Ogihara, T.; Takuda, H. Int. J. Multiphase Flow 2010, 36, 620–642
- Quéré 2013 Quéré, D. Annu. Rev. Fluid Mech. 2013, 45, 197–215
- Incropera et al. 2010 Incropera, F. P.; DeWitt, D. P.; Bergman, T. L.; Lavine, A. S. Fundamentals of Heat and Mass Transfer, 7th ed.; Wiley, 2010
- Mandre et al. 2009 Mandre, S.; Mani, M.; Brenner, M. P. Phys. Rev. Lett. 2009, 102, 134502
- Mayhew and Prakash 2013 Mayhew, E.; Prakash, V. Carbon 2013, 62, 493–500