Search for and Characterization of Open Clusters Toward the Galactic Anti-center with Pan-STARRS1
Abstract
We have used a star-count algorithm based the Panoramic Survey Telescope And Rapid Response System 3 survey data aim to identify and characterize uncharted open clusters (OCs). With limiting magnitudes of about 22 mag in , , bands and about 20 mag in and bands, our data are 100 times more sensitive than currently available surveys. We analyzed a trial region within field toward the Galactic anticenter and found 1660 density enhancement regions of which 79 (out of 129) are known OCs, and 949 are OC candidates.
1 Introduction
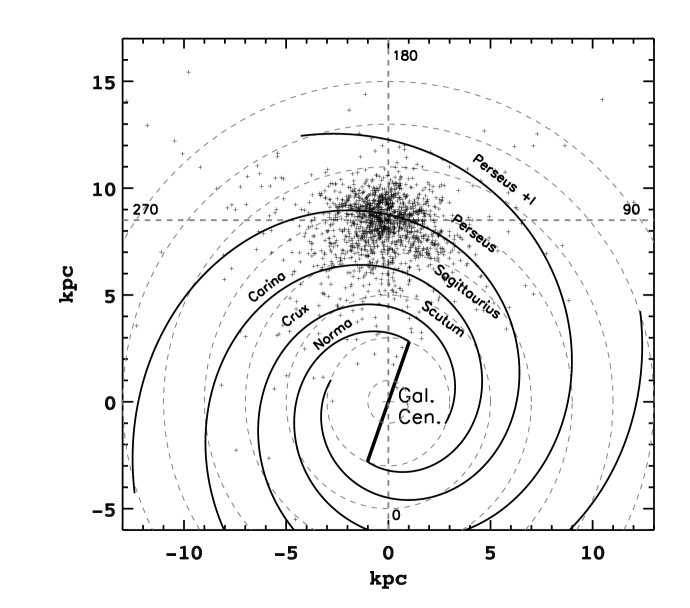
Hundreds of thousand open clusters (OCs) should exist currently in our Milky
Way Galaxy, based on the number of OCs in the solar neighborhood (Piskunov et al. 2006).
However, the databases of OCs (Dutra & Bica 2001; Dias et al. 2002; Bica et al. 2003; Dutra et al. 2003; Kronberger et al. 2006; Froebrich et al. 2007)
contain only a few thousand entries which are limited to OCs within 1 kpc (see
Fig. 1). The discrepancy is due partly to dust extinction in the
Galactic plane, and partly to lack of comprehensive all-sky searches for
distant systems.
Star clusters are grouping of member stars in a 6-dimensional phase space in
position and motion. Kinematic studies require special instrumentation and are
often time-consuming. Initial identification of a star cluster via space
grouping, i.e., by the “star-count” technique is relatively straightforward
and has been exploited efficiently on wide-field or all-sky surveys
(Schmeja 2011). Recent work by Bica et al. (2003); Dutra et al. (2003); Froebrich et al. (2007) have indeed found
hundreds of previously unknown infrared clusters with 2MASS, some of which turn
out to be bona fide star groups as verified by follow-up photometric studies.
A few newly found star clusters are associated with nebulosity, indicative of
their youth (Lin et al. 2013).
Nonetheless, a systematic analysis of star clusters from deeper optical
photometry survey has not yet been studied. Fig. 2 demonstrates the
incompleteness properties of OCs, only 1530 out of 2134 OCs have distance
information (Dias et al. 2002) and the completeness limit is only at 0.71 kpc.
Since all these OCs are analyzed with the different dataset, one needs a
more uniform and deeper dataset to resolve the properties of further OCs. The
Pan-STARRS1111http://ps1sc.org/ – Panoramic Survey Telescope And Rapid
Response System – survey provides us a deeper and wider coverage than
the recent sky survey, we therefore can not only discover more OCs to expand
their distance of the completeness limit, but also estimate the properties of
OCs more systematically and comprehensively.

As a training set for PS1 data, we have developed and tested a star-count algorithm to recognize star density enhancements toward the Galactic Anti-center with 400 square degrees in the PS1 catalog. Here we report on the completeness and limitation of our searching algorithm and preliminary characterization from PS1 data.
2 Data and Analysis
2.1 Pan-STARRS1 Data
The Pan-STARRS1 (PS1) is an innovative design for a wide-field imaging facility
developed at the University of Hawaii’s Institute for Astronomy and the 1.8 m
telescope is located on Haleakalā on the island of Maui, conducting a
multi-wavelength, multi-epoch, optical imaging survey (Kaiser et al. 2002). The
survey covers about 30,000 square degrees and the limiting magnitudes,
on the AB system, for each filter are 23.4, 22.8, 22.2, 21.6, and 20.1 mag in
, , , , and , respectively (Tonry et al. 2012).
We extract data within a field of view centered on ( with box size on PS1 survey data from PS1 Desktop Virtual Observatory (DVO) database (Magnier 2006). According to the photometric quality flags set, we exclude the extend sources and require objects to be detected at least five times to remove potential false detections. Furthermore, we require the scattering of object’s positions less than 200 mili-arcsec. Finally, we have 203,226 sources out of 211,668 entries.
2.2 Identification of Star Density Enhancements
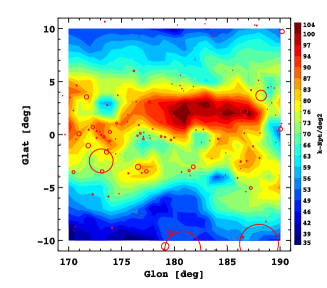
We choose good quality data to make the star density map whose pixel values
are determined by counting the number of stars in a 3 arcmin radius with 10
arcsec offset (see Fig. 3 left panel). The star density maps were
then divided into one square degrees and searched automatically for local
density enhancements by using the SExtractor software (Bertin & Arnouts 1996).
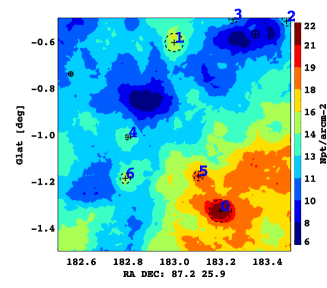
We found 1660 density enhancements toward Galactic anticenter in a region within field. In Fig. 3 right panel, we demonstrated a sample of our results. The black circles are our candidates, there may be some contaminations from (e.g., bright stars, chip gaps, clouds etc.). Therefore, a cluster candidate will be identified only if it satisfies with (a) the local star density is above the level of the background, (b) an effective radius of more than one arcmin, (c) having a positive core and tidal radius by fitting with the King’s model (King 1966), and (d) having more than 10 members. Following those criterias, we then have 949 probable OC candidates.
2.3 Characterization of Star Cluster Candidates
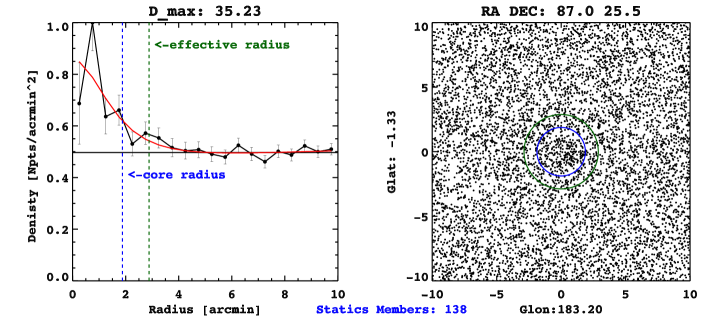
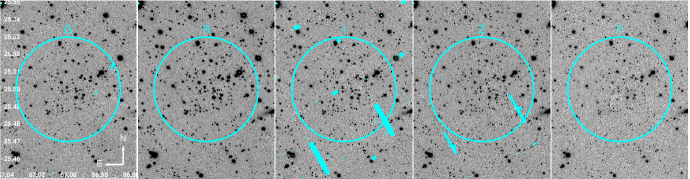
Fig. 4 shows our analysis of our candidates No. 0 in Fig. 2 right panel. The effective radius is determined by the density enhancement region, however we considered to use the radius derived by King’s model. The radial density profile suggested a field density of about 17 stars per square arcmins, and a density enhancement within about 2 arcmin radius by fitting with the King’s model. The central density in the cluster region reaches about 35 stars per square arcmins, and there are a total of 138 member stars within the 2 arcmin cluster radius. One can see the PS1 stacked images in the bottom of Fig. 3, and the central region indeed shows the stars concentration. The age, distance, and reddening of our candidates are not yet determined here, however we are improving our programs recently (Lin et al. 2013; Wang et al. in submission).
3 Results and Summary
We identified and characterized uncharted OCs based on PS1 survey data.
A total of 1660 detections were identified by our pipeline. In our search
field, there are 129 known OCs, for which 79 were rediscovered. Those not
found by our pipeline are either too extended ( arcmin) or with
uncertain position (offset arcmin). A total of 949 OC candidates have
been identified. The remaining 632 are unlikely real OCs because they are with
neither enough members nor significant radial profiles. We expect to produce a
comprehensive OC sample out to about 3 kpc. With PS1 photometry and proper
motion, very low-mass members down to 0.5 M at 3 kpc, 0.15 M
at 1 kpc can be identified.
Acknowledgments
We acknowledge the financial support from the National Science Council grant NSC 102-2119-M-008-001 and NSC 102-2119-M-008-002. The Pan-STARRS1 Surveys (PS1) have been made possible through contributions by the Institute for Astronomy, the University of Hawaii, the Pan-STARRS Project Office, the Max-Planck Society and its participating institutes, the Max Planck Institute for Astronomy, Heidelberg and the Max Planck Institute for Extraterrestrial Physics, Garching, The Johns Hopkins University, Durham University, the University of Edinburgh, the Queen’s University Belfast, the Harvard-Smithsonian Center for Astrophysics, the Las Cumbres Observatory Global Telescope Network Incorporated, the National Central University of Taiwan, the Space Telescope Science Institute, and the National Aeronautics and Space Administration under Grant No. NNX08AR22G issued through the Planetary Science Division of the NASA Science Mission Directorate, the National Science Foundation Grant No. AST-1238877, and the University of Maryland.
References
- Bertin & Arnouts (1996) Bertin, E., & Arnouts, S. 1996, A&AS, 117, 393
- Bica et al. (2003) Bica, E., Dutra, C. M., Soares, J. & Barbuy, B. 2003, A&A, 404, 223
- Dias et al. (2002) Dias, W. S., Alessi, B. S., Moitinho, A., & Lépine, J. R. D. 2002, A&A, 389, 871
- Dutra & Bica (2001) Dutra, C. M., & Bica, E. 2001, A&A, 376, 434
- Dutra et al. (2003) Dutra, C. M., Bica, E., Soares, J., & Burbuy, B. 2003, A&A, 400, 533
- Froebrich et al. (2007) Froebrich, D., Scholz, A., & Raftery, C. L. 2007, MNRAS, 374, 399
- Kaiser et al. (2002) Kaiser, N., Aussel, H., Burke, B. E., et al. 2002, Proc. SPIE, 4836, 154
- King (1966) King, I. R. 1966, AJ, 71, 64
- Kronberger et al. (2006) Kronberger, M., et al. 2006, A&A, 447, 921
- Lin et al. (2013) Lin, C. C., Chen, W. P., Panwar, N. 2013, ApJ, in press
- Magnier (2006) Magnier, E. 2006, in Proc. Advanced Maui Optical and Space Surveillance Technologies Conference, ed. S. Ryan (Wailea, HI: The Maui Economic Development Board), E50
- Piskunov et al. (2006) Piskunov, A. E., Kharchenko, N. V., Röser, S., Schilbach, E. & Scholz, R.-D. 2006, A&A, 445, 545
- Schmeja (2011) Schmeja, S. 2011, AN, 332, 172
- Tonry et al. (2012) Tonry, J. L., Stubbs, C. W., Lykke, K. R., et al. 2012, ApJ, 750, 99
- Vallée (2002) Vallée, J. P. 2002, ApJ, 566, 261
- Wang et al. (in submission) Wang, P. F., Chen, W. P., Lin, C. C., et. al. 2013, ApJ, in submission