Ionization State of Inter-Stellar Medium in Galaxies: Evolution, SFR-- Dependence, and Ionizing Photon Escape
Abstract
We present a systematic study for ionization state of inter-stellar medium in galaxies at with SDSS galaxies and intermediate to high redshift galaxies from the literature, using an ionization-parameter sensitive line ratio of [O iii][O ii] and photoionization models. We confirm that galaxies show an [O iii][O ii] ratio significantly higher than a typical star-forming galaxy of SDSS by a factor of , and the photoionization models reveal that these high- galaxies have an ionization parameter of cm s-1, a factor of higher than local galaxies. For galaxies at any redshift, we identify a correlation between the [O iii][O ii] ratio and galaxy global properties of star-formation rate (SFR), stellar mass (), and metallicity (). We extend the fundamental metallicity relation (FMR) and develop the fundamental ionization relation (FIR), a four-dimensional relation of ionization parameter, SFR, , and . The intermediate and high- galaxies up to follow the FIR defined with the local galaxies, in contrast with the FMR whose possible evolution from to is reported. We find that the FMR evolution of appears, if one omits ionization parameter differences, and that the FMR evolution does not exist for an average metallicity solution of galaxies with a high-ionization parameter. Interestingly, all of two local Lyman-continuum emitting galaxies (LyC leakers) have a high [O iii][O ii] ratio, indicating a positive correlation between [O iii][O ii] and ionizing photon escape fraction (), which is successfully explained by our photoionization models. Because [O iii][O ii] ratios of galaxies, especially Ly emitters (LAEs), are comparable to, or higher than, those of the local LyC leakers, these high- galaxies are candidates of Lyman-continuum emitting objects. A strong Ly emission can coexist with a large of , and the increasing fraction of LAEs towards high- reconciles the picture of cosmic reionization whose major ionizing sources are faint galaxies having intrinsically-bright Ly emission.
keywords:
galaxies: abundances — galaxies: evolution — galaxies: high-redshift — galaxies: ISM.1 Introduction
For galaxy formation studies, it is essential to understand physical conditions of inter-stellar medium (ISM) of galaxies. Physical properties of hot ISM are characterized by gas-phase metallicity and ionization parameter. A gas-phase metallicity is a record of galaxy’s star formation history and gas infalloutflow, and is commonly defined by oxygen abundance, . Metallicity estimates can be made with metal lines divided by a hydrogen recombination line, such as ([O iii][O ii])H (-index; e.g., Pagel et al. 1979; Kewley & Dopita 2002) and [N ii]H ratio (-index; e.g., Storchi-Bergmann et al. 1994; Kewley & Dopita 2002; Pettini & Pagel 2004). An ionization parameter, , is sensitive to the degree of excitation of an H ii-region. It is defined as the ratio of mean ionizing photon flux to mean atom density, and its dimensionless form, , is also used. Ionization parameters are estimated with emission lines of different ionization stages of the same element, such as [O iii][O ii] ratio (e.g., Kewley & Dopita 2002).
Metallicities of galaxies have been well studied in the local and high- universe in the diagram of stellar-mass vs. metallicity (–) relation. In the local universe, a tight – relation is recognized, where a metallicity increases with stellar mass (e.g., Tremonti et al. 2004). At high-, similar – relations are reported at (e.g. Savaglio et al. 2005; Erb et al. 2006; Maiolino et al. 2008; Mannucci et al. 2009; Zahid et al. 2011; Yabe et al. 2012). These studies find the evolution of – relation; a metallicity decreases towards high- at a given . Recently, Mannucci et al. (2010) and Lara-López et al. (2010) identify that the – relation depends on star formation rate (SFR), which is initially suggested by Ellison et al. (2008), and propose the fundamental metallicity relation (FMR) that forms a single plane in the stellar-mass, metallicity, and SFR space. The FMR holds over with no evolution. This would indicate that there are physical processes commonly found in local and high- galaxies. Many follow-up studies test the universality of the FMR over the wide range of stellar mass, SFR, and redshifts (e.g, Mannucci et al. 2011; Richard et al. 2011; Nakajima et al. 2012; Niino 2012; Yabe et al. 2012; Cresci et al. 2012; Wuyts et al. 2012; Christensen et al. 2012a; Belli et al. 2013; Lara-López et al. 2013). Although galaxies at follow the FMR, galaxies at appear to fall below the FMR (Mannucci et al., 2010). Mannucci et al. (2010) claim that this disagreement suggests that there are physical mechanisms different from those of low-z galaxies at . However, this is still an open question.
In contrast to metallicities, ionization parameters of galaxies are poorly understood. Recently, Nakajima et al. (2013) use a diagram of [O iii][O ii] ratio and -index to study ionization parameters and metallicities for galaxies at , focusing on the properties of Ly emitters (LAEs) at . Nakajima et al. (2013) report that a typical ionization parameter increases towards high-, and suggest the evolution of ionization parameter (see also, Lilly et al. 2003; Hainline et al. 2009; Richard et al. 2011). However, until recently, statistical studies for ionization parameters do not cover (i) physical relations between ionization parameter and galaxy global properties, such as stellar mass and SFR, and (ii) evolution of the physical relations with ionization parameter. Dopita et al. (2006a) present that in the local universe an ionization parameter seems to gradually decrease with , but do not address the issue about evolution of this trend (see also Brinchmann et al. 2008).
There is another diagnostics of ionization parameter, using a plot of [N ii]H and [O iii]H ratios that is referred to as the BPT diagram (Baldwin et al., 1981). Local star-forming galaxies form a tight sequence on the BPT diagram (e.g., Kauffmann et al. 2003a). In contrast, high- galaxies depart from the local star-forming sequence towards higher [O iii]H ratio (e.g., Shapley et al. 2005; Erb et al. 2006; Liu et al. 2008; Hainline et al. 2009; Finkelstein et al. 2009; Yabe et al. 2012). Similarly, recent spectroscopic surveys report that high- galaxies on average have [O iii]H ratios much higher than local similar mass galaxies (Cullen et al., 2014; Holden et al., 2014). One interpretation of that departure is evolution of ionization parameter (e.g., Brinchmann et al. 2008; Kewley et al. 2013a, b). Kewley et al. (2013a) have compared high- galaxy line ratios and theoretical predictions to investigate evolution of the star-forming sequence on the BPT diagram, and claimed that high- galaxies would have a larger ionization parameter, a higher electron density, and/or a harder ionizing radiation field (see also Brinchmann et al. 2008; Kewley et al. 2013b). Shirazi et al. (2013) have also argued a possibility that the typical gas density of H ii-regions would be much higher in high- galaxies.
Ionization parameters are also important for accurate estimates of metallicity from nebular emission lines. Metallicity estimation methods based on local empirical relations (e.g., Maiolino et al. 2008) are often applied to high- galaxies. These methods implicitly assume ionization parameters of typical local galaxies. Since various studies suggest that ionization parameter evolves with redshift, the estimated metallicities from local empirical relations would be biased.
Recently, a relationship between ionization parameter and escape fraction of ionizing photons () and its importance for cosmic reionization are discussed. Nakajima et al. (2013) have pointed out a possibility that positively correlates with ionization parameter, since an optically-thin nebula could show a high [O iii][O ii] ratio (e.g., Giammanco et al. 2005; Brinchmann et al. 2008; Kewley et al. 2013b). If this correlation of ionization parameter and is established, ionization parameters allow us to investigate ionizing photon escapes that cannot be directly observed for galaxies at the epoch of reionization (; Fan et al. 2006; Dunkley et al. 2009). Studies of galaxies at have identified a tension between the ionizing photon production rate and cosmic reionization (e.g., Ouchi et al. 2009; Robertson et al. 2010). A moderately high average of would be required for galaxies in the early universe to keep the inter-galactic medium (IGM) ionized. Nakajima et al. (2013) have suggested that LAEs exhibit higher ionization parameters than other high- galaxy populations such as Lyman-break galaxies (LBGs). Because observations reveal that a fraction of LAEs to star-forming galaxies of LBGs increases with redshift (e.g., Ouchi et al. 2008; Vanzella et al. 2009; Stark et al. 2010, 2011), more LAEs with a high ionization parameter, i.e., a high , would ease the tension of the deficit of ionizing photons at the early universe. However, the claim of Nakajima et al. (2013) is made only with two LAEs, and it is unclear whether this is a general feature of LAEs. One needs to (i) investigate the trend that LAEs typically show an ionization parameter higher than LBGs, and (ii) understand the physical reason of the correlation between ionization parameter and with theoretical models. Although predicting is challenging by using simulations or theoretical models due to the large uncertainties in the assumptions about the ISM and the limited resolutions (e.g., Rahmati et al. 2013), we investigate the correlation with photoionization models assuming a simple, homogeneous gas cloud as the first step.
This paper is organized as follows. We describe our samples of galaxies in Section 2, and test the main sample of SDSS in Section 3. In Section 4, we show all of our galaxies in the [O iii][O ii] vs. -index diagram, and investigate galaxy properties in the diagram with the aid of photoionization models. We then clarify the dependencies of ionization parameter on galaxy global properties of stellar mass, SFR, and metallicities. We introduce a new relation named fundamental ionization relation (FIR) that is described in the four-dimensional parameter space of [O iii][O ii] ratio, -index, stellar mass, and SFR. We discuss these observational results in Section 5, addressing the issues of (i) the evolution of ionization parameter, (ii) the FMR evolution at , (iii) the relations between [O iii][O ii] ratio, -index, stellar mass, and SFR, and (iv) the correlation between ionization parameter and . Finally, we summarize our results in Section 6. Throughout this paper, we estimate stellar masses and SFRs based on a Chabrier (2003) initial mass function (IMF), and assume an Asplund et al. (2009) solar metallicity, where . We adopt a concordance CDM cosmology with .
2 Galaxy Samples
2.1 Local Galaxies
2.1.1 SDSS galaxies
We make an SDSS sample from the SDSS Data Release 7 MPA/JHU catalog111 http://www.mpa-garching.mpg.de/SDSS/DR7/ including emission line properties and stellar masses (Kauffmann et al. 2003b; Brinchmann et al. 2004; Salim et al. 2007). We select galaxies with the criteria similar to those adopted by Mannucci et al. (2010); (1) , (2) a signal-to-noise ratio (S/N) of H , (3) , (4) HH , (5) active galactic nuclei (AGN) are removed based on the BPT diagram (Baldwin et al., 1981) with the classification of Kauffmann et al. (2003a)222 Although Brinchmann et al. (2004) recommend that requiring S/N in all four BPT diagram lines is useful, we do not adopt the criteria because the requirement could bias the sample regarding metallicity. Indeed, the criteria of S/N ratio of H is strong enough to remove lots of galaxies with low-S/N emission lines in the sample. By imposing S/N ratios of all four BPT diagram lines , the sample size decreases to . Nevertheless, we have checked that our main results do not depend significantly on the criteria. In order to fairly compare with the FMR of Mannucci et al. (2010), we do not impose the requirement of S/N ratios for the BPT diagram. , (6) metallicities estimated from the - and -index (Maiolino et al., 2008) agree within dex. We adopt the average value of the two metallicities333 These metallicities are only used for the consistency check of the FMR of Mannucci et al. (2010) (Section 3). , and use total stellar masses listed in the updated MPA/JHU stellar mass catalog444 http://home.strw.leidenuniv.nl/~jarle/SDSS/ . All the emission line fluxes are corrected for extinction using HH and the extinction curve given by Cardelli et al. (1989). SFRs are estimated from the H luminosities by using the Kennicutt (1998)’s relation, and (total) stellar masses from the broadband photometry. All of the SFRs and stellar masses are corrected to the Chabrier (2003) IMF. We remove the same objects in the catalog that are found by the MPA/JHU group. We thus obtain SDSS galaxies.
In this sample, we highlight two populations of galaxies shown below.
-
•
Green Pea galaxies (GPs; Cardamone et al. 2009) that are local star-forming galaxies with a very strong [O iii] emission line whose EW is Å. They are found in the SDSS spectroscopic sample of galaxies with green colors in the SDSS composite images, where the strong [O iii] emission fall in the band. Because the strong [O iii] emission has to be redshifted to the bandpass of , the redshift of GPs ranges from to . We use GPs given by Cardamone et al. (2009) that are free from AGN contamination. We cross-match the GPs to our SDSS galaxies, and identify GPs. To include GPs at , we perform the same cross-matching to SDSS galaxies that do not meet the redshift criterion of (1), and obtain additional GPs at . We use a total of GPs in our analysis.
-
•
Lyman Break Analogs (LBAs; Heckman et al. 2005; Hoopes et al. 2007; Basu-Zych et al. 2007; Overzier et al. 2008, 2009) that are super-compact UV-luminous local galaxies whose characteristics are similar to those of high- LBGs. The UV imaging survey performed by the Galaxy Evolution Explorer (GALEX) is used to select star-forming galaxies at with a high luminosity of and a high far UV surface brightness of . We compile catalogs of Hoopes et al. (2007), Basu-Zych et al. (2007), and Overzier et al. (2009), and obtain LBAs. Cross-matching them to our SDSS galaxies and removing AGN candidates, we make an LBA sample composed of LBAs.
We remove sources in our GP and LBA samples from our SDSS galaxies, and define a sample of SDSS galaxies with no GPs and LBAs as SDSS sample.
2.1.2 LyC leakers
There are two local star-forming galaxies emitting Lyman-continuum (LyC) radiation, Haro 11 (Bergvall et al., 2006; Leitet et al., 2011) and Tol 1247-232 (Leitet et al., 2013). They are initially selected as blue compact galaxies or H ii galaxies, and found to leak LyC radiation from the Far Ultraviolet Spectroscopic Explorer (FUSE) data. In order to study the relation between ionization state and ionizing photon escape, we investigate the two LyC leaking galaxies. Hereafter we refer to these two galaxies as LyC leakers. Emission line fluxes for Haro 11 and Tol 1247-232 are obtained from Bergvall & Östlin (2002) and Terlevich et al. (1993), respectively, and stellar masses from Leitet et al. (2013). Their SFRs are derived in the same manner as those of our SDSS galaxies (Section 2.1.1). Neither of them is contaminated by AGN (Leitet et al., 2013). We note that Haro 11 can be classified as an LBA (Heckman et al., 2011).
2.2 Intermediate and High Redshift galaxies
We make samples of intermediate- and high- galaxies that have firm estimates of stellar mass and spectroscopic measurements of nebular emission lines (hydrogen Balmer lines, [O ii], [O iii]). We particularly include strongly lensed galaxies, BX/BM galaxies, LBGs, and LAEs.
-
•
Intermediate redshift galaxy sample () is composed of galaxies from the Gemini Deep Deep Survey (GDDS) and galaxies from the Canada-France Redshift Survey (CFRS) (Savaglio et al., 2005; Maier et al., 2005). Moreover, we add low-mass galaxies recently reported by Henry et al. (2013), and strongly lensed galaxies (Christensen et al., 2012a; Queyrel et al., 2009) to the sample. In total, the intermediate- sample contains galaxies.
-
•
High redshift galaxy sample () consists of galaxies in total, strongly lensed galaxies (Pettini et al., 2001; Fosbury et al., 2003; Richard et al., 2011; Rigby et al., 2011; Christensen et al., 2012a; Wuyts et al., 2012; Belli et al., 2013), two LAEs (Nakajima et al., 2013), one metal-poor BX galaxy (Erb et al., 2010), and LBGs from the AMAZE and LSD projects (Maiolino et al., 2008; Mannucci et al., 2009).
We use a total of intermediate- and high- galaxies in our analysis.
We divide the high- galaxy sample into two subsamples, LAE and LBG samples, to investigate the relationship between ionization state and Ly photon escape. For high- galaxies with a Ly flux measurement, we classify galaxies with EWrest (Ly) Å as LAE; Lynx arc (Fosbury et al., 2003), BX418 (Erb et al., 2010), Abell 1689 31.1 arc, and SMACS J2031 arc (Christensen et al., 2012a, b). We include the two narrow-band selected LAEs, CDFS-3865 and COSMOS-30679 (Nakajima et al., 2013), to the LAE sample. For high- galaxies with EWrest (Ly) Å or no Ly flux measurement, we regard these galaxies as LBGs for simplification, given the observational fact that continuum-selected galaxies on average have an EW of Ly Å (e.g., Shapley et al. 2003; Kornei et al. 2010). Indeed, most of the galaxies in the sample of Maiolino et al. (2008) are originally spectroscopically-confirmed based on rest-frame UV absorption lines, not Ly emission line (see also Vanzella et al. 2006).
We derive physical quantities for these intermediate- and high-
galaxies with the same procedures as those for our SDSS galaxies.
Emission line fluxes are corrected for extinction with HH and
the extinction curve given by Calzetti et al. (2000). For galaxies with
no H or H measurement, we correct for extinction estimated from
spectral energy distribution (SED) fitting, assuming that the amount of
extinction is the same in continuum and emission lines. For galaxies
neither with HH nor dust extinction from SED fitting555
These galaxies are GDDS objects.
,
we adopt dust extinction inferred from stellar mass based on the
empirical relation (Gilbank et al., 2010). SFRs are estimated from a
hydrogen recombination line of H or H corrected for dust
extinction with the Kennicutt (1998)’s relation.
If [O iii] fluxes are not available in the literature666
There are , , and galaxies at , , and ,
respectively.
, we assume a value of for the [O iii] ratio
(Richard et al., 2011). We have confirmed that this assumption does
not affect our results significantly. We estimate intrinsic SFRs and
stellar masses, using lens magnification factors for the strongly
lensed galaxies. We place the lower (upper) limits on the SFR and
stellar mass of SGAS1527 (SGAS1226) that only has the upper (lower)
limit of the magnification factor (Wuyts et al., 2012).
We adopt the lower limit of stellar mass given by
Villar-Martín et al. (2004) for Lynx arc (Fosbury et al., 2003).
For high- galaxies with no [O ii] detections
(Fosbury et al., 2003; Erb et al., 2010; Richard et al., 2011),
we apply upper-limit fluxes of [O ii] for the lower limits
of [O iii][O ii], while we approximate -indices under the
assumption of no significant [O ii] flux. Using the BPT diagram, we
have identified no obvious AGN activity in the high- galaxies.
We note that all the properties for the local, intermediate-, and high- galaxies used in this paper are derived in a consistent manner, and that they can be fairly compared to each other.
3 Testing FMR with Our SDSS Sample
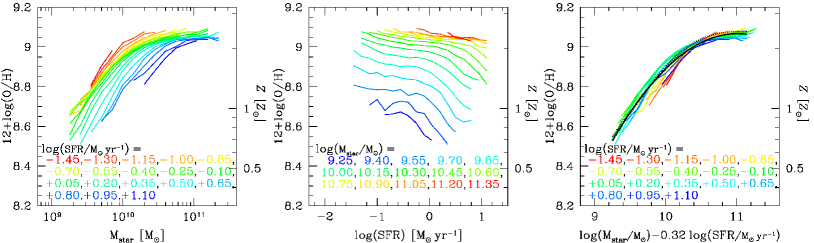
Before we present our analysis results, we test whether our SDSS sample reproduces the FMR (Mannucci et al., 2010). For this purpose, we derive metallicities based on the Maiolino et al.’s (2008) empirical relations, as adopted by Mannucci et al. (2010) (Section 2.1.1). It should be noted that our main discussion is based on metallicities derived with ionization parameter from the photoionization models of Kewley & Dopita (2002) (e.g., Section 4.3). In Figure 1, three panels from left to right show the -metallicity, SFR-metallicity, and -metallicity plots with our SDSS sample. The variable is defined as a combination of and SFR,
| (1) |
where is a free parameter. Mannucci et al. (2010) obtain that minimizes the scatter of their SDSS galaxies in the -metallicity plane. The colored lines in each panel represent a mean metallicity of our SDSS galaxies for subsamples defined with SFR (left and right panels) and (center panel) in a dex range. We display subsamples containing galaxies.
In the right panel of Figure 1, the solid black curve indicates the quadratic best-fit of our SDSS sample, while the dotted curve presents the original FMR (Mannucci et al., 2010, 2011). The original FMR is expressed by a combination of a linear and a 4th-order polynomial functions (Mannucci et al., 2011). From this plot, the FMR of our SDSS sample is almost identical to that of Mannucci et al. (2010, 2011). Therefore, we conclude that our SDSS sample successfully reproduces the original FMR of Mannucci et al. (2010)777 In our SDSS sample, we find a value of that minimizes the scatter in the -metallicity plane. However, the difference of residual dispersion of metallicity between and is negligibly small, and dex, respectively. .
4 Ionization State of Inter-Stellar Medium in Galaxies
4.1 [O iii][O ii] vs. -index Diagram
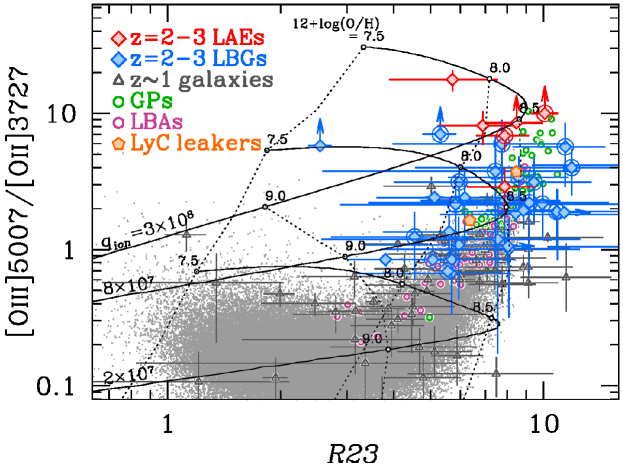
Nakajima et al. (2013) have demonstrated that [O iii][O ii] vs. -index diagram is useful to investigate ionization parameter and metallicity of galaxies (see also Kewley & Dopita 2002). Figure 2 is the diagram of [O iii][O ii] ratio and -index with our local, intermediate- (), and high- () galaxies. The underlying gray dots are the SDSS galaxies. Figure 2 indicates that galaxies with a higher -index have a higher [O iii][O ii] ratio. The red and blue diamonds denote LAEs and LBGs, respectively. Compared to the SDSS galaxies, these high- galaxies clearly present an [O iii][O ii] ratio higher than most of galaxies by a factor of . The majority of galaxies (the gray triangles) are placed at the middle between the SDSS galaxies and the LBGs. LBGs at (blue diamonds with a circle) have an [O iii][O ii] ratio higher than those at on average. In Figure 2, LAEs have the highest [O iii][O ii] ratio. This trend is first claimed by Nakajima et al. (2013), but we confirm this trend with our LAE and LBG samples significantly larger than those used in Nakajima et al. (2013). The two local galaxies of GPs (green open circles) and LBAs (purple circles) are placed near the high- galaxies. These galaxies present the highest -index and [O iii][O ii] ratio among the local galaxies. Interestingly, the LyC leakers (orange pentagons) have values of [O iii][O ii] ratio and -index similar to those of GPs, LBAs, and high- galaxies. It should be noted that some LAEs have a remarkably high [O iii][O ii] ratio that cannot be found in the local galaxies.
4.2 Physical Origin of Large [O iii][O ii] ratio
We investigate the physical origin of large [O iii][O ii] ratios found in Section 4.1, using photoionization models. There are five physical parameters of nebulae that change the [O iii][O ii] ratio, a) spectral shape of ionizing source, b) gas temperature, c) metallicity, d) ionization parameter, and e) gas density. First, if the incident ionizing source includes an AGN whose spectrum is hard, high-ionization lines are stronger than low-ionization lines. However, since our samples are free from a significant AGN contamination (Section 2.1.1), the ionizing source difference does not significantly change the [O iii][O ii] ratio. Second, gas temperature changes the emissivity of [O iii] and [O ii] lines. Gas temperature is determined by the metal abundance, because coolings are dominated by collisionally excited metal ions such as O+, O2+, N+ etc. We simply regard metallicity as a control parameter of temperature, and investigate the temperature dependence on the basis of gas metallicity. Thus, there are three key parameters, metallicity, ionization parameter, and gas density, that affect the [O iii][O ii] ratio.
In Figure 2, we plot the photoionization models given by Kewley & Dopita (2002) with the black curves. The models predict line ratios at a given metallicity and ionization parameter with a fixed gas pressure888 For electron temperatures of K. This pressure corresponds to a density of order cm-3. of cm-3 K assuming isobaric conditions. The models in Figure 2 indicate that the [O iii][O ii] ratio and -index depend on metallicity and ionization parameter.
The models of Figure 2 present three important trends on the [O iii][O ii] vs. -index diagram;
-
(1).
[O iii][O ii] ratio increases with ionization parameter.
-
(2).
[O iii][O ii] ratio decreases with metallicity.
-
(3).
-index increases in a low-metallicity regime (low- branch) from to , and decreases in a high-metallicity regime (high- branch) from towards a higher metallicity.
The trend of (1) is explained by the boost of high-energy ionizing photons as the ionization parameter increases. Such high-energy photons produce more abundant [O iii]. The trend of (2) is caused by a decrease of gas temperature in an H ii-region. As gas metallicity increases, gas temperature drops due to cooling of metal lines. For gas clouds with high metallicity, the far-infrared fine-structure cooling of O2+ is more efficient than those in optical wavelength (e.g., Charlot & Longhetti 2001; Dopita et al. 2000). Thus, in optical wavelength, [O iii] emission becomes faint, while [O ii] emission does not change dramatically, which makes a decrease of [O iii][O ii] ratio to a higher metallicity. Similarly, the trend of (3) in the high- branch of is explained by the weak optical [O iii][O ii] emission with more dominant far-infrared fine-structure cooling. Thus, the -index decreases with metallicity. On the other hand, in the low- branch of , optical collisional excitation lines including [O iii] and [O ii] are the most efficient cooling radiation, -index increases as oxygen abundance, i.e., metallicity, increases. To summarize, the [O iii][O ii] ratio depends strongly on ionization parameter and moderately on metallicity. -index is mainly governed by metallicity, but also depends, albeit weakly, on ionization parameter.
In addition to metallicity and ionization parameter, emission line ratios would be changed by gas density. In fact, the recent study of Shirazi et al. (2013) argues that a high gas density would be an origin of the large [O iii][O ii] ratio of high- galaxies. This argument is based on the following ideas. The ionization parameter is defined by
| (2) |
where is the number of hydrogen ionizing photons per second, is the Strömgren radius, and is the total hydrogen density. The hydrogen ionizing photon production rate of is balanced by a recombination rate under the assumption of ionization equilibrium,
| (3) |
where is a coefficient of the total hydrogen recombination to the levels, and is the volume filling factor of the ionized gas. The combination of Equations (2) and (3) yields
| (4) |
(see also Charlot & Longhetti 2001; Shirazi et al. 2013). By the comparison with low and high redshift galaxies with similar and specific SFR (and thus with similar metallicity under the assumption of the FMR being in place), Shirazi et al. (2013) have found that the high- galaxies show an [O iii][O ii] ratio higher than low- counterparts by dex, indicating that high- galaxies have a higher than the low- counterparts by dex. Based on Equation (4), Shirazi et al. (2013) have argued that increases by a factor of to high-, assuming that high- galaxies and their low- counterparts have similar and values. Indeed, Shirazi et al. (2013) have confirmed that high- galaxies tend to have a high electron density, which is measured directly from emission lines.
Because ionization parameter is determined by , , and (Equation 4), ionization parameter is a fundamental parameter of photoionization models, which allows the potential evolutions of , , and . The assumption of no evolution of IMF would also be an open question (e.g., Davé 2008; Narayanan & Davé 2013). Therefore, we interpret the [O iii][O ii] ratio as a function of ionization parameter and metallicity in this paper. Hereafter, we study the relation between [O iii][O ii] ratio and -index with various ionization parameters and metallicities in the following analysis.
4.3 Interpretation of the [O iii][O ii] and -index Relation
In this section, we evaluate the average values of our galaxies’ ionization parameter and metallicity that are sensitive to [O iii][O ii] ratio and -index measurements, using the method given by Kobulnicky & Kewley (2004). Kobulnicky & Kewley (2004) use the photoionization model of Kewley & Dopita (2002), showing an equation of ionization parameter,
| (5) |
where , and equations of metallicity,
| (6) | |||
| (7) |
where and the subscript low (high) corresponds to a metallicity value in the low- (high-) branch of metallicity. We use dust-corrected [O iii][O ii] ratio and -index. Note that, without other metallicity indicators, this method does not provide a single solution, but multiple solutions from low- and high- branches. The demarcation metallicity between the two branches is . We use Equations (5)–(7) to estimate a metallicity and ionization parameter iteratively until the metallicity converges. We evaluate errors of metallicity and ionization parameter by Monte Carlo simulations. For each galaxy sample, we obtain the average values of -index, [O iii][O ii] ratio, and their uncertainties. We assume that for each of the flux ratios, the probability distribution of the true value is a Gaussian with its sigma equal to the observed uncertainty in the flux ratio. We randomly select a set of -index and [O iii][O ii] ratio following these Gaussian probability distributions, and calculate metallicity and ionization parameter with the set of -index and [O iii][O ii] ratio based on Equations (5)–(7). We repeat the process times, and define one sigma errors of metallicity and ionization parameter by the percentile of the distribution.
| Sample | ||
|---|---|---|
| SDSS | – | – |
| galaxies | – | – |
| LyC leakers | – | – |
| LBAs | – | – |
| GPs | – | – |
| LBGs | – | – |
| LAEs | – | – |
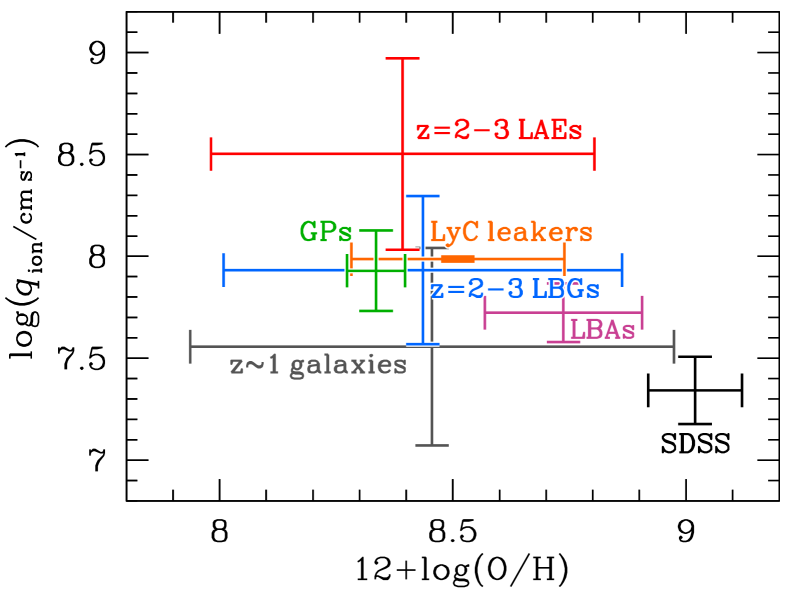
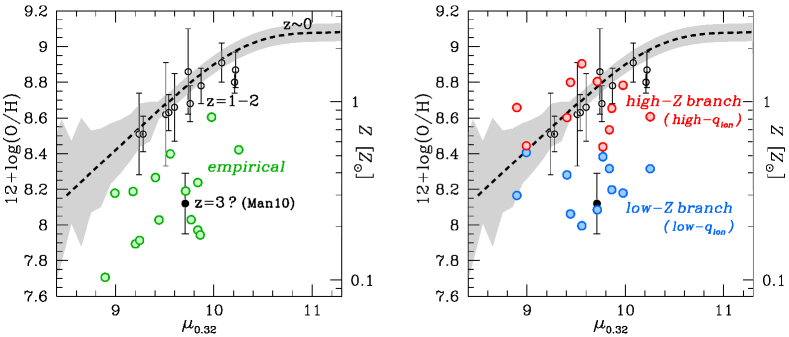
The estimated values are summarized in Table 1 and shown in Figure 3. We list the ranges of values in both the high- and low- branches for the intermediate and high- galaxy samples but for the local galaxy samples. For the SDSS sample, only the values in the high- branch are given, since the average metallicity for the low- branch, , is significantly lower than that estimated with -index and -index (Figure 1). We have checked that the SDSS high- branch metallicity of (Table 1) is consistent with our estimate in Section 3, as well as those estimated in previous studies (e.g., Tremonti et al. 2004; Mannucci et al. 2010). For GPs, LBAs, and LyC leakers, we calculate the metallicities and ionization parameters for individual objects, whose two-branch solutions are distinguished by other metallicity indicators of gas temperature and/or -index (see also Section 5.2). Their percentile of the distributions are listed in Table 1 and shown in Figure 3.
Although only weak constraints are placed on metallicity due to the degeneracy of the two branch solutions, the difference of ionization parameters between galaxy samples is clearly found in Figure 3. The SDSS galaxies have the average value of cm s-1 (see also e.g., Dopita et al. 2006a). In contrast, high- galaxies have an ionization parameter of cm s-1. High- LBGs have an ionization parameter higher than the SDSS galaxies by a factor of , and high- LAEs show the highest ionization parameter among the galaxy samples, which is about an order of magnitude higher than the SDSS galaxies. In the local galaxies, GPs and the LyC leakers exhibit ionization parameters much higher than the SDSS galaxies. Similarly, the ionization parameter of LBAs is high. These extreme local populations of GPs, LyC leakers, and LBAs have an ionization parameter as high as LBGs and LAEs at high redshifts. Moreover, the ionization parameter of GPs is comparable to that of LAEs. In this sense, GPs could be local counterparts of high- LAEs.
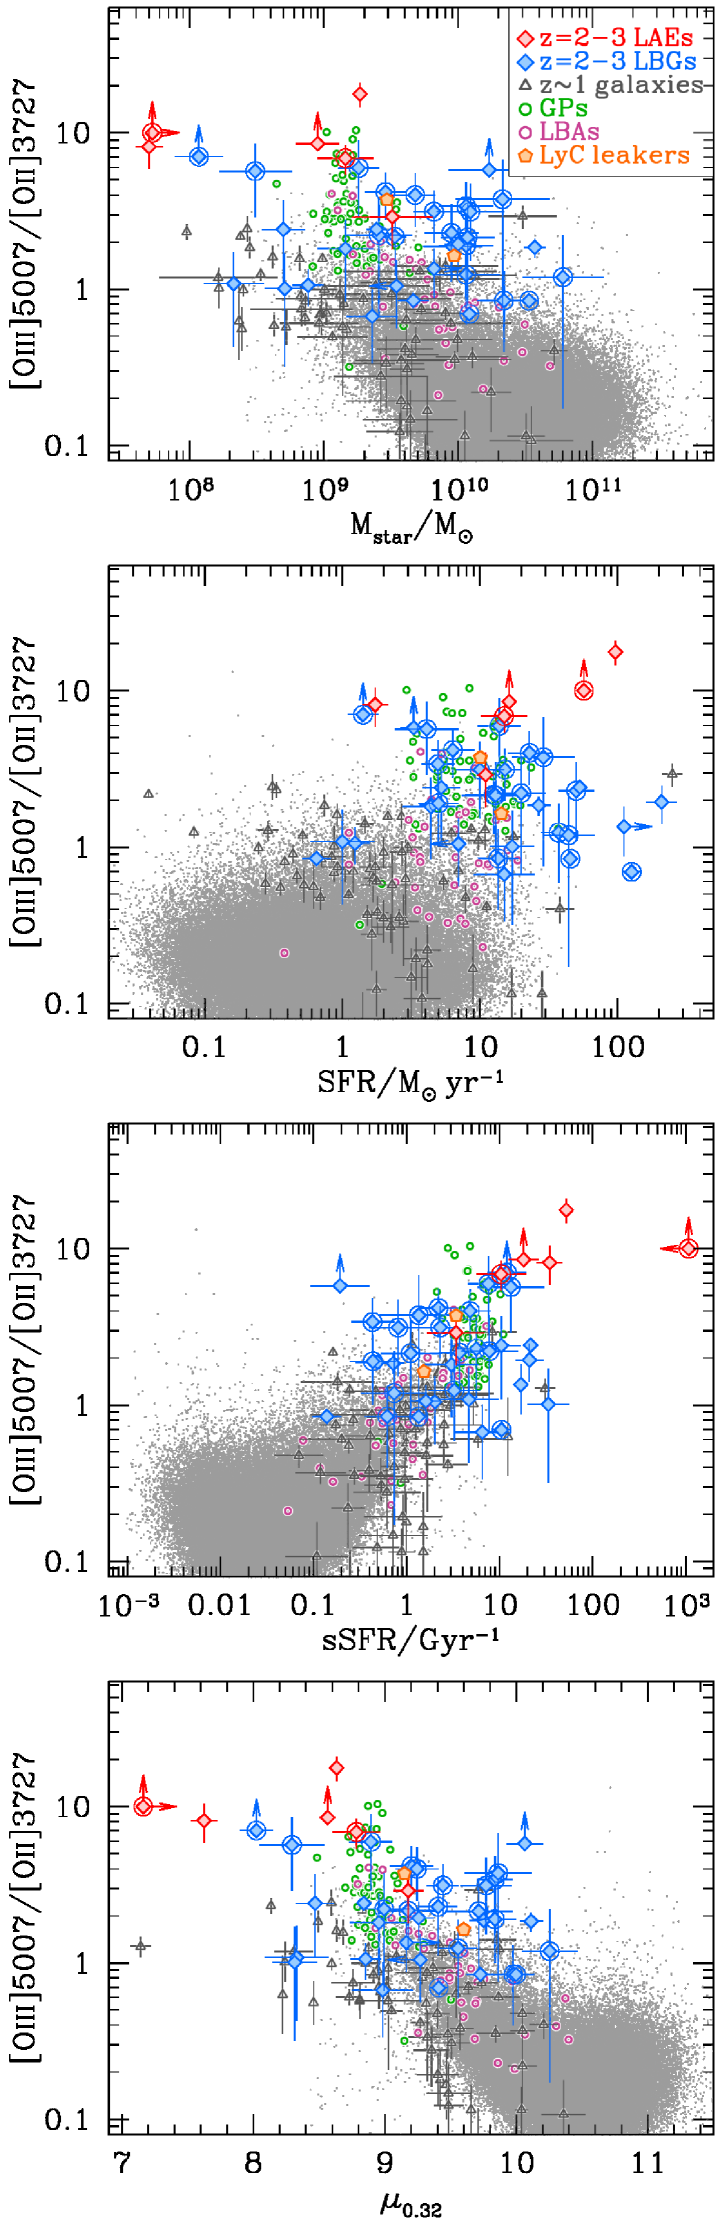
Figure 2 suggests that there is a variation of ionization parameter in the SDSS sample. In fact, the SDSS galaxy distribution sequence departs from the model curve of cm s-1. In the large -index regime, we recognize the slope of the SDSS galaxy sequence steeper than that of the photoionization model predictions. This trend indicates that galaxies with a low metallicity of have a high ionization parameter (e.g., Dopita et al. 2006a; Nagao et al. 2006). If the – relation is in place (e.g., Tremonti et al. 2004), this would imply that low- galaxies have a high ionization parameter. We examine the possible dependencies of and other galaxy global properties on ionization parameters in Sections 4.4 and 4.5. Similarly, the important characteristics can be found in the small -index regime. The sequence of SDSS galaxies presents an upturn from high to low -index values. This trend is probably caused by the presence of a hidden AGN activity in a galaxy. In this regime, the SDSS galaxies departing from the model curve would be also dominated by objects with a low SFR and a high (Section 4.5; see also Dopita et al. 2006a).
4.4 Dependence of [O iii][O ii] on and SFR
In Section 4.3, we have estimated the typical ionization parameters for our galaxy samples from the comparisons of the photoionization models with the measurements of [O iii][O ii] and -index, and compared them (Figure 3). However, these comparisons do not focus on possible dependencies on galaxy global properties such as and SFR. Figure 2 presents a relatively large scatter in [O iii][O ii] ratios at a given -index in one galaxy sample. This scatter could be originated from the galaxy global properties. To address the issue, we examine the dependencies of the [O iii][O ii] ratio on the galaxy global properties.
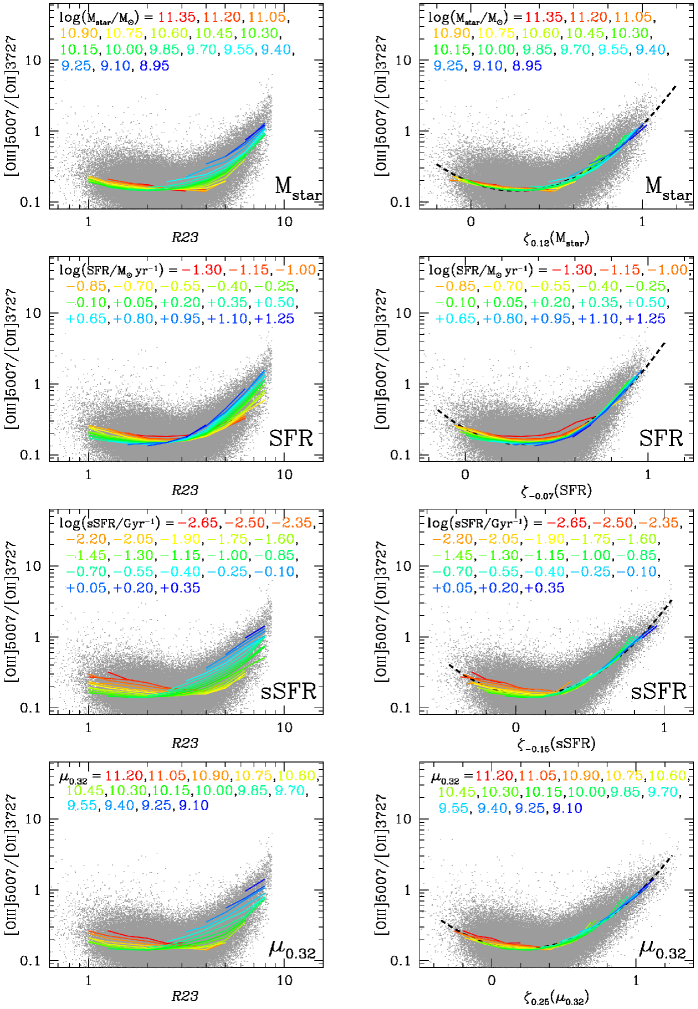
Figure 4 shows [O iii][O ii] ratios as a function of , SFR, specific SFR (sSFR; SFR divided by ), and (Equation (1) with ). Figure 4 indicates that the [O iii][O ii] ratio correlates with the galaxy global properties of , SFR, sSFR, and . A high [O iii][O ii] ratio is found in low , low , and high sSFR galaxies. A similar trend is initially proposed by Brinchmann et al. (2008), but we find these trends in local extreme populations and high- galaxies. There is an anti-correlation between [O iii][O ii] and metallicity (Section 4.2). Thus, the dependence of [O iii][O ii] ratio on and is reasonable, because the – relation and the FMR are in place. In this way, the [O iii][O ii] ratio is tightly related to the galaxy global properties, while this ratio is an indicator of ionization parameter and metallicity. In the next section, we investigate dependencies of the galaxy global properties on ionization parameter and metallicity with the SDSS sample on the [O iii][O ii] vs. -index diagram.
Before moving to the next section, we comment here on the variations of global properties for the galaxies shown in Figure 4. First, GPs are the least massive and the most actively star-forming galaxies in the local universe. Their low values are probably due to their low metallicities (e.g., Amorín et al. 2010). LBAs are the next extreme population. The LyC leakers have SFRs as high as GPs and LBAs. High- galaxies have a comparable with the SDSS galaxies, but a SFR higher than these local galaxies. This tendency is consistent with the evolution of the star-formation main sequence (e.g., Daddi et al. 2007). The SFRs and of high- galaxies are little higher than those of GPs and LBAs, while the sSFR of high- galaxies are comparable with those of GPs and LBAs. LAEs exhibit remarkable properties on average, having the least and the highest SFR among galaxies at any redshifts.
4.5 Fundamental Ionization Relation
As shown in Figure 2, the [O iii][O ii] vs. -index diagram allows us to study ionization state of hot ISM in galaxies. In Section 4.4, we discuss that the [O iii][O ii] ratio depends on four galaxy global properties of , SFR, sSFR, and . The large scatter found in Figure 2 would be explained by the differences of the galaxy global properties.
In order to investigate the dependencies of , SFR, sSFR, and on the [O iii][O ii] vs. -index plane, we make subsamples of our SDSS sample. We choose one quantity from the four galaxy global properties. The chosen quantity is referred to as a ‘3rd quantity’ hereafter. A bin size of a subsample is dex in the 3rd quantity. For a given subsample, we calculate a median [O iii][O ii] ratio of galaxies in a range of . We use subsamples with galaxies for our analysis. The left panels of Figure 5 show the subsamples of , SFR, sSFR, and on the [O iii][O ii] vs. -index plane. Figure 5 indicates that the relation between [O iii][O ii] and -index depends on the galaxy global properties. A high [O iii][O ii] ratio can be found in less massive, more efficiently star-forming, and probably more metal-poor galaxies (Dopita et al., 2006a). We introduce a parameter, , which combines -index and one of the 3rd quantities:
| (8) |
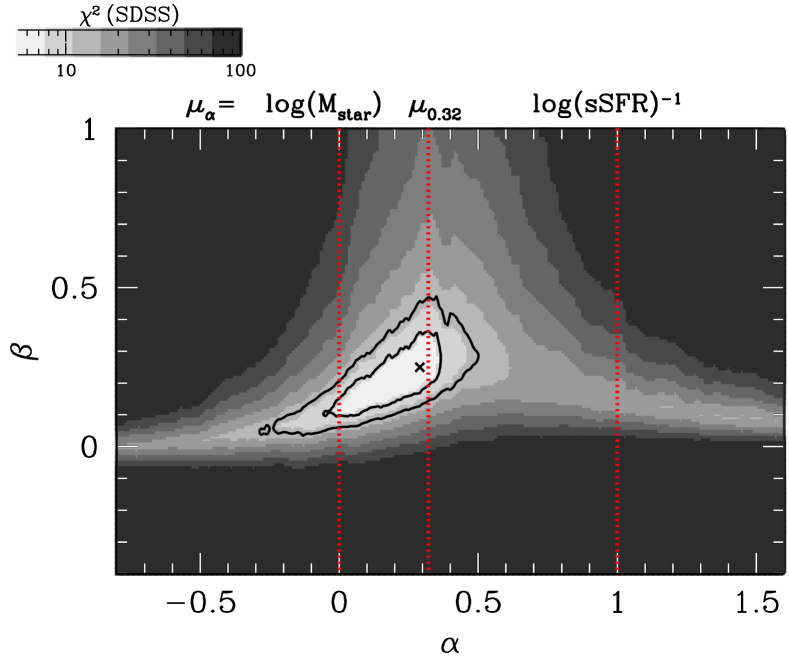
where is a free parameter and , , , and for a 3rd quantity of , SFR, sSFR, and , respectively. We calculate a scatter of the SDSS subsamples in the relation of [O iii][O ii] and by varying for each of the 3rd quantities, . As a result, the scatter is minimized at for of (, SFR, sSFR, ). The right panels of Figure 5 present our SDSS galaxies on the [O iii][O ii] and plane. The median values of the SDSS subsamples are fitted by a quadrature:
| (9) |
where – are free parameters. The best-fit parameters are given in Table 2. We show the best-fit quadratures in the right panels of Figure 5. These plots suggest that the 3rd quantity can reduce the systematic dispersions. However, it is unclear whether the new parameter of reduces the dispersion by a physical reason or a simple statistical reason. Here we use defined in Equation (1) as a 3rd quantity and search for an optimal combination of and SFR by varying parameters of both and 999 Although does not represent a function of SFR with no dependence of , we have found in our analysis that a function with provides the best-fit value of (Table 2), which indicates that a SFR alone does not reduce the scatter of the SDSS galaxy distribution. . Note that the parameter denotes the best combination of and SFR for metallicity (Mannucci et al., 2010), while the parameter defines the best combination of these quantities for both metallicity and ionization parameter. Based on Equation (8) with , we calculate of the free parameters, and . Here we assume that [O iii][O ii] dispersions of our subsamples are originated from measurement errors. These dispersions are used to obtain the values.
| 3rd quantity | ||||
|---|---|---|---|---|
| SFR | ||||
| sSFR | ||||
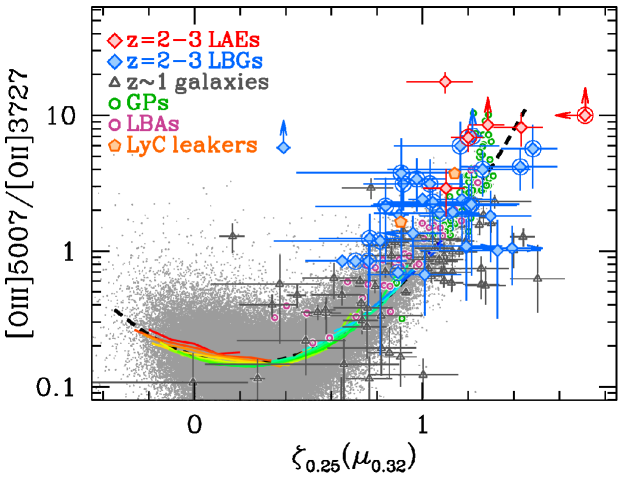
Figure 6 shows values of and . The minimum is provided by the parameters of . The best-fit parameters are and . Interestingly, the best-fit value of is consistent with the one of the FMR (). Thus, ( for ) is the best 3rd quantity to describe the relation. Moreover, we have newly constrained the parameter that is tightly related to ionization parameter. The best-fit rules out at the % confidence level. The results of our analysis suggest that ionization parameters given with the [O iii][O ii] vs. -index diagram is important to characterize galaxies, and that ionization parameters are closely related to the galaxy global properties of and SFR as well as metallicity.
We compare our various galaxy samples with the best-fit function of the SDSS galaxies in Figure 7. This figure is the same as the bottom right panel of Figure 5, but with high- galaxies and local extreme populations, GPs, LBAs, and the LyC leakers. Although the best-fit function is derived with the SDSS sample alone, high- galaxies and local extreme populations follow the same relation or fall on the extrapolation of the function. It should be noted that no significant differences are found between galaxies at and . The relation of best-fit function between [O iii][O ii] and (Figure 7) is thus thought to be a fundamental relation consisting of ionization parameter, metallicity, , and SFR over cosmic time. Hereafter we refer to the relation as fundamental ionization relation (FIR).
5 Discussion
5.1 Evolution of Ionization State
We have confirmed the trend that high- galaxies have ionization parameters significantly higher than local galaxies. The SDSS galaxies typically show cm s-1, while the high- LBGs exhibit an ionization parameter higher than the SDSS galaxies by a factor of (Table 1, Figure 3). This evolution of ionization parameter is consistent with the trend that high- galaxies depart from the local star-forming sequence in the BPT diagram towards higher [O iii]H ratio (e.g., Brinchmann et al. 2008; Kewley et al. 2013a, b), and with the recent spectroscopic surveys of high- galaxies (Cullen et al., 2014; Holden et al., 2014). The evolution of ionization parameter can be closely related to the evolution of SFR and . As shown in Figure 5, a high [O iii][O ii] ratio, i.e., a high ionization parameter, is found in low , low , and high sSFR galaxies. Since high- galaxies tend to have a higher sSFR (or smaller ) than local galaxies (Figure 4; cf. the evolution of the star-formation main sequence; Daddi et al. 2007), they are supposed to show an ionization parameter typically higher than local galaxies. Note that ionization parameter is, by definition, the ratio of ionizing photon and hydrogen atom densities. Since the amount of ionizing photons and hydrogen atoms would be positively correlated with SFR and stellar mass, respectively, the evolution of ionization parameter would be explained by the increase of sSFR, i.e., the high SFR and low mass for high- galaxies.
The local extreme populations of GPs, LyC leakers, and LBAs have an ionization parameter as high as LBGs and LAEs. Moreover, the ionization parameter of GPs is comparable to that of LAEs. GP’s low metallicities (see also Amorín et al. 2010) and SFR (Izotov et al., 2011) are also analogous to those observed in LAEs. In these senses, GPs could be local counterparts of LAEs. However, GPs are quite rare objects in the local universe, occupying only % of the SDSS sample (Nakajima et al., 2013; Cardamone et al., 2009). The number density of GPs is approximately two orders of magnitude smaller than that of LAEs. Interestingly, Heckman et al. (2005) report a similar difference of abundances between LBAs and LBGs. These results indicate that galaxies with a high ionization parameter would emerge in a high redshift universe, and that these galaxies are more dominant in high- than the local universe.
Recently, some studies have found galaxies with very strong nebular emission lines that are called extreme emission line galaxies (EELGs; e.g., van der Wel et al. 2011; Atek et al. 2011). van der Wel et al. (2011) investigate EELGs at in the CANDELS deep imaging data of HST/WFC3. These EELGs present a very strong [O iii] of EW Å that significantly boosts flux measurements in a NIR broadband, which are similar to the bright -band fluxes of GPs. Although no estimates of ionization parameter are given for EELGs due to lacks of [O ii] data, they could have a very high ionization parameter suggested from their very large EW([O iii]), low (), and high sSFR ( Gyr-1). Kakazu et al. (2007) study ultra-strong line galaxies (USELs) at identified by narrowband imaging, and find that USELs have extremely low metallicities ( ) and very high [O iii][O ii] ratios (). They argue that USELs typically have ionization parameters as high as cm s-1. Obviously, ionization parameter is a key quantity to characterize these extreme populations of galaxies.
5.2 Revisiting the Issue of FMR Evolution from to
Mannucci et al. (2010) have suggested that the FMR can describe properties of galaxies with no redshift evolution up to , and claimed that galaxies at fall significantly below the FMR by dex. The analysis of Mannucci et al. (2010) indicates the evolution of FMR from to , but it is not clear why the FMR evolves only between and . In contrast to the FMR evolution, we have argued in Section 4.5 that no significant differences are found between galaxies at and in the FIR (Figure 7). We address the question why the FMR shows the evolution but no evolution is found in the FIR.
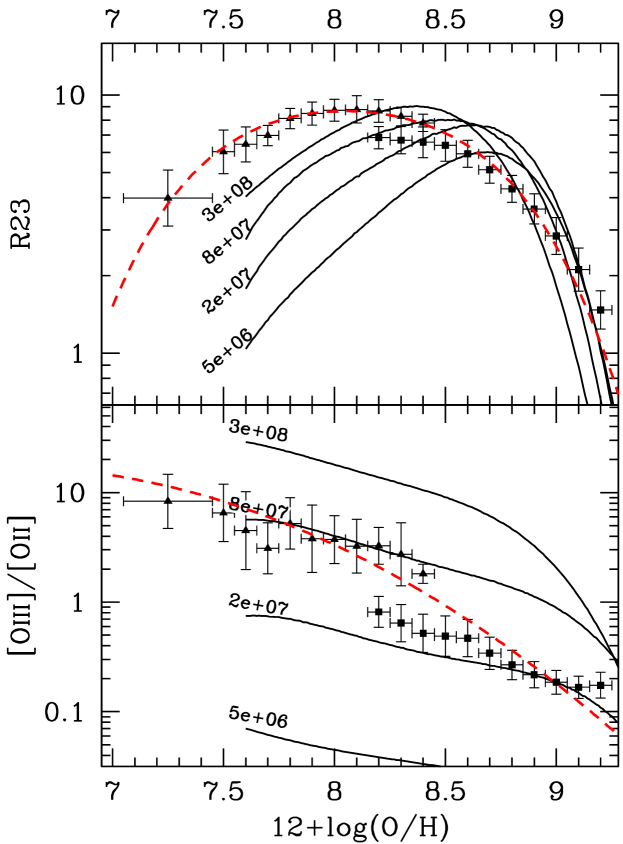
Mannucci et al. (2010) use metallicities of galaxies given by Maiolino et al. (2008) and Mannucci et al. (2009) that are estimated with the local empirical relations of Maiolino et al. (2008). The local empirical relations of Maiolino et al. (2008) are obtained from two samples, (i) local galaxies with whose metallicities are estimated by the electron temperature method, and (ii) star-forming SDSS galaxies with given with the photoionization model (Kewley & Dopita 2002; see also Nagao et al. 2006). Figure 8 presents -index and [O iii][O ii] ratio of the two samples. The red dashed curves denote the local empirical relations determined with these two samples (Maiolino et al., 2008). Figure 8 compares the photoionization models (black solid curves) with the local empirical relations, and indicates that the local empirical relations implicitly assume an ionization parameter. Given the fact that high- galaxies have an ionization parameter higher than local galaxies (Section 5.1), the local empirical relations assuming a relatively low ionization parameter would provide biased metallicity estimates for high- galaxies. At , the [N ii]H ratio can be used to estimate metallicities and/or to discriminate one from two metallicity solutions given by -index. However, at [N ii] and H lines cannot be detected from the ground. The [O iii][O ii] ratio is needed to determine one from two metallicity solutions of -index. The bottom panel of Figure 8 shows that the photoionization model predicts a lower metallicity if a lower ionization parameter is assumed. Thus, one may underestimate metallicities of galaxies with the local empirical relations, since the ionization parameter of galaxies is significantly higher than those of local galaxies (Section 5.1).
We evaluate the bias of galaxy metallicity estimates, which is originated from the local empirical relation. We estimate metallicities of galaxies with the Kobulnicky & Kewley (2004) method in the same manner as Section 4.3, allowing the ionization parameter evolution. We compile a total of galaxies from AMAZE (Maiolino et al., 2008) and LSD (Mannucci et al., 2009) projects. First, for a consistency check, we estimate metallicities of our galaxies with the local empirical relation used by Mannucci et al. (2010). We find that the average metallicity of the galaxies is (left panel of Figure 9), which is consistent with that of Mannucci et al. (2010) ( ). We confirm that our galaxies and the local empirical relation can reproduce the results of Mannucci et al. (2010). Then, using the Kobulnicky & Kewley (2004) method, we obtain average metallicities of our galaxies for the low- and high- branches that are and , with ionization parameters of and cm s-1, respectively. Typically dex errors are associated with the estimates of metallicity and ionization parameter for each of the galaxies. Note that four out of fifteen galaxies are omitted from these metallicity estimates, since their -index values fall out of the range covered by Equations (6) and (7). The right panel of Figure 9 compares the metallicity estimate of Mannucci et al. (2010) with ours allowing the ionization parameter evolution. The high- branch metallicities appear to follow the FMR (black dashed curve; Mannucci et al. 2010, 2011). In contrast, the low- branch metallicities fall below the FMR, which is consistent with the result of Mannucci et al. (2010).
Because there is no useful line ratio, such as [N ii]H, that determines one from two metallicity solutions of low and high- branches, we cannot conclude which metallicities are correct and whether galaxies follow the FMR. However, we find that the high ionization parameter of cm s-1 for the high- branch solution agrees with the our findings of ionization parameter evolution from to (Section 5.1). Moreover, there are no physical reasons for the sudden departure from the FMR from to , e.g., the smooth evolution of cosmic SFR/stellar mass densities at (Bouwens et al., 2011; Stark et al., 2013). Theoretical studies do not find the departure from the FMR at . Our metallicity estimates of high- branch of galaxies are comparable with those predicted by Davé et al. (2011) who perform cosmological hydrodynamical simulations. Dayal et al. (2013) have explained the trend of the FMR with the redshift-independent simple analytic model. These pieces of evidence imply that the galaxy metallicities of high- branch with the high-ionization parameter are correct, and that galaxies follow the FMR.
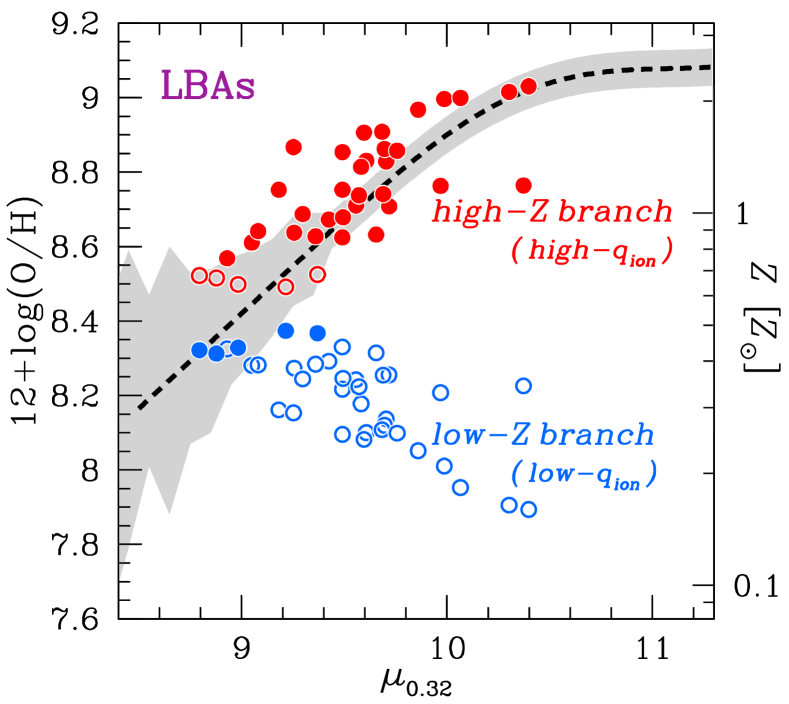
As local counterparts of high- galaxies, we also examine LBAs in the FMR plot in Figure 10. Their metallicities are estimated in the same manner as those for galaxies. However, their two metallicity solutions can be distinguished, since other metallicity indicators of gas temperature and/or [N ii]H ratio are available for the local galaxies. The filled circles display metallicities that agree better with those estimated by the other metallicity indicators. Figure 10 suggests that LBAs follow the FMR if their metallicities are estimated with ionization parameter. We have also checked that the FMR is valid for GPs, whose metallicities are estimated in the same manner as those for LBAs. These findings confirm the validity of the FMR over the wide ranges of stellar mass and SFR in the local universe. Another notable trend in Figure 10 is that the LBAs metallicities of high- branch with high-ionization parameter are generally correct. This is what we argue for the galaxies. Since LBAs are local UV-selected galaxies whose characteristics are similar to those for LBGs (e.g., Overzier et al. 2009), their trends in the FMR plot support our argument that LBGs have metallicities of high- branch with high-ionization parameter and follow the FMR.
For more conclusive discussion of galaxies, one needs deeper NIR spectroscopy to provide an ionization parameter indicator of [Ne iii][O ii] (e.g., Nagao et al. 2006; Levesque & Richardson 2013; Richardson et al. 2013) or IR (m) spectroscopy from the space to obtain [N ii]H that determines one from two metallicity solutions. In particular, the [Ne iii][O ii] ratio is observable from the ground up to . We have confirmed the utility of the [Ne iii][O ii] ratio for LAEs, whose ionization parameters are very high (Fosbury et al. 2003; Christensen et al. 2012b).
5.3 Fundamental Ionization Relation
As demonstrated in Section 5.2, ionization parameter is important for metallicity estimates. Although the FMR reproduces properties of galaxies with no significant evolution, input metallicities to the FMR would be sometimes biased due to the evolution of ionization parameters. In this sense, the FIR is advantageous because the FIR allows the difference of ionization parameter. The FIR consisting of the fiducial parameter requires non-zero , where is ruled out at the % confidence level (Section 4.5). This indicates that the four-dimensional relation of FIR between ionization parameter, metallicity, SFR, and is useful to characterize gas properties of galaxies.
5.4 Relationship between Ionization State and Ionizing Photon Escape
We have found in Figure 2 that the LyC leakers show [O iii][O ii] ratios significantly higher than typical low- galaxies, which suggest that these LyC leakers have a high ionization parameter. The LyC leakers’ [O iii][O ii] ratios are comparable to those of GPs, LBAs, and galaxies. These results imply that galaxies with a high [O iii][O ii] ratio, GPs, LBAs, and galaxies, may have a high .
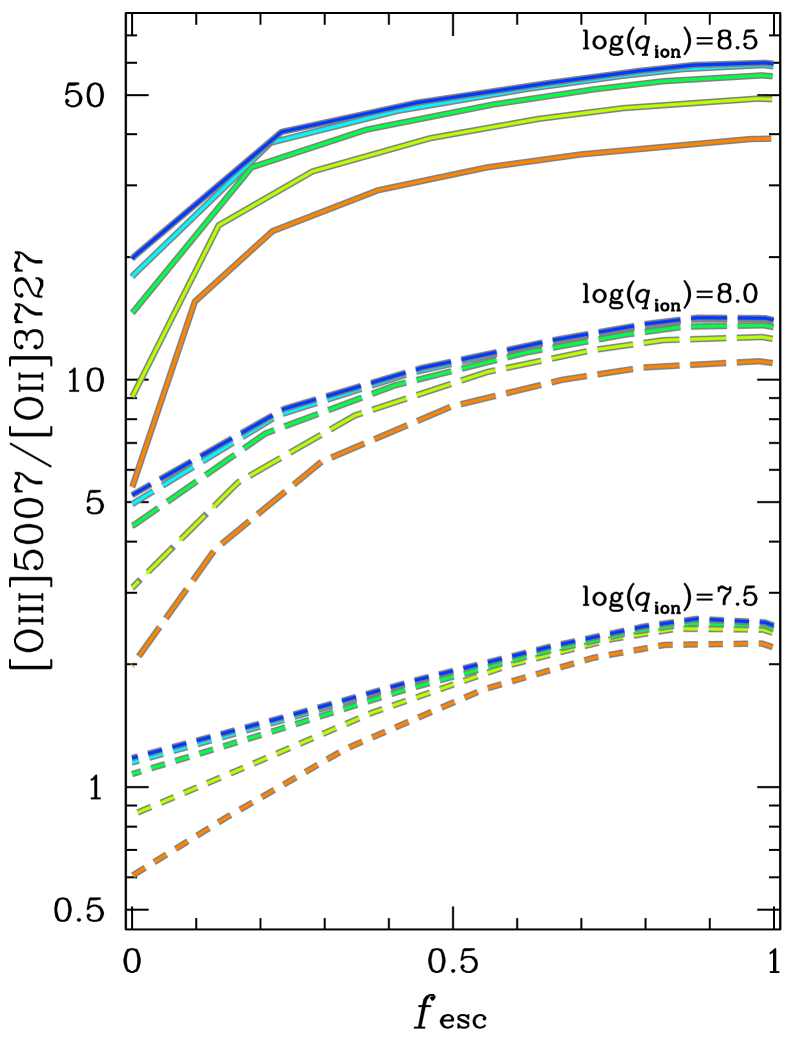
To examine the dependence of [O iii][O ii] ratio on , we perform photoionization model calculations with cloudy (version 13.02; Ferland et al. 1998, 2013). We assume a constant-density homogeneous inter-stellar gas cloud with a spherically closed geometry. A volume filling factor of the ionized gas is assumed to be unity for simplification. We include dust physics and the depletion factors of the various elements from the gaseous phase in the same manner as the analysis of Dopita et al. (2006b). In non-solar metallicities, we assume that both the dust model and the depletion factors are unchanged, but the dust abundance is assumed to scale linearly with the gas metallicity, as adopted in Nagao et al. (2011). All elements except for nitrogen, carbon, and helium are taken to be primary nucleosynthesis elements. For nitrogen, we use a form given by López-Sánchez et al. (2012) to take account of its secondary nucleosynthesis component in a high metallicity range. For carbon and helium, we use forms in Dopita et al. (2006b). Photoionization models are calculated with the parameters of , cm s-1, and cm-3 101010 We have checked that changing the density to cm-3 and cm-3 does not alter our results. Since both [O iii] and [O ii] are collisionally excited lines, their intensities are similarly enhanced if the density is smaller than their critical densities of cm-3 for [O iii] and – cm-3 for [O ii] (Osterbrock, 1989). is mainly governed by . . The incident ionizing radiation fields are generated by Starburst99 (Leitherer et al., 1999). We use instantaneous burst models at zero age with a Kroupa (2001) IMF and lower and upper mass limits of and , respectively. Stellar metallicities are matched to the gas-phase ones. Under these assumptions and conditions, we evaluate with the number of ionizing photons escaping from a thin cloud with a low column density. We adopt a neutral hydrogen column density, , as the stopping criterion of our calculations that ranges from to cm-2. The escape fraction is defined as a ratio of transmitted ionizing photons ( Å) to input ionizing photons.

Figure 11 shows the cloudy calculation results on the [O iii][O ii] vs. plot. Figure 11 indicates that the [O iii][O ii] ratio increases with . This trend qualitatively explains the large [O iii][O ii] ratio of the LyC leakers in Figure 2. This relationship between [O iii][O ii] ratio and is understood by one of the two classifications of star-forming nebulae;
- (1).
-
(2).
Density-bounded nebula whose radius is determined by the distribution of gas cloud (Figure 12b). The density-bounded nebula does not expend all of ionizing photons, but leak ionizing photons that are not used for the ionization of the nebula.
The ionizing photon escape takes place in the density-bounded nebula under the assumption of homogeneous gas cloud. A density-bounded nebula with a less emits more ionizing photons, and has a higher (Giammanco et al., 2005). On the other hand, in the ionization-bounded nebula, lower ionization species of O+ (producing [O ii]) dominate in the outer region of the nebula, while an O2+ zone (producing [O iii]) exists near the ionizing source (e.g., Shields 1990; Oey & Kennicutt 1997; Pellegrini et al. 2012). Thus, the O+ zone of density-bounded nebula is smaller than that of an ionization-bounded nebula, but the size of O2+ zone is similar in the density-bounded and ionization-bounded nebulae. As a result, the [O iii][O ii] ratio is large in density-bounded nebulae, and nebulae with a less have a higher [O iii][O ii] ratio. From the combination of vs. and vs. [O iii][O ii] relations, we understand the positive correlation between [O iii][O ii] and . We note that we consider a very simple case, with the assumption that H ii-regions are homogeneous density-bounded nebulae. In reality, conditions of H ii-regions with ionizing photon escape could be more complex, e.g., ionization-bounded nebulae with highly ionized low density holes (e.g., Zackrisson et al. 2013; see also the end of this section). However, we present in this paper the simple case to investigate the possibility that the [O iii][O ii] ratio could be affected by the condition of H ii-regions where ionizing photon escapes take place. It is beyond the scope of this paper whether or not the assumption of the density-bounded nebulae is reasonable. The assumption remains to be tested by future observations.
In Figure 11, [O iii][O ii] ratios are determined not only by , but also by ionization parameter and metallicity. For example, the [O iii][O ii] ratio increases by an order of magnitude from to . Similarly, the [O iii][O ii] ratio increases by a factor of from and , although this dependence is small (Section 4.2). On the other hand, the [O iii][O ii] ratio increases by a factor of from to . The [O iii][O ii] ratio is thus sensitive to as well as ionization parameter and metallicity. These results would suggest that a galaxy with a high [O iii][O ii] ratio can be a candidate of high object, but that not all of high [O iii][O ii] objects are LyC leakers.
In Figure 7, we have found that most of galaxies at follow the FIR within the uncertainties. However, some galaxies clearly depart from the FIR at a few sigma level. The two LyC leakers have an [O iii][O ii] ratio higher than the FIR by a factor of at high significance. The enhancement of [O iii][O ii] ratio may be caused by an ionizing photon escape. If it is true, some GPs and LAEs lying above the FIR would be good candidates of ionizing photon emitting objects. In Figure 7, LAEs particularly have a very high [O iii][O ii] ratio, some of which are departing from the FIR more significantly than LBGs over the sizes of error bars. This physical characteristics would be originated from a very large given by a low of LAE. The low of LAE is also supported by the gas-dynamics study of Hashimoto et al. (2013) who claim that LAEs typically have a lower than LBGs from the analysis of velocity offsets between a Ly line and low-ionization interstellar absorption lines with respect to the systemic velocity. This tendency is confirmed with a larger number of LAEs by Shibuya et al. (2014a). In this companion paper, Shibuya et al. (2014b) examine LAE structures, suggesting that LAEs with a large Ly EW tend to have a small ellipticity. This is consistent with the theoretical results that Ly photons can more easily escape from face-on disks having a small ellipticity, due to a low (e.g., Verhamme et al. 2012; Yajima et al. 2012; Zheng & Wallace 2013). Moreover, recent deep narrowband imaging surveys have indicated diffuse Ly emitting halos around high- star-forming galaxies that are more prominent for LBGs (e.g., Steidel et al. 2011) than LAEs (Feldmeier et al., 2013). Since most of the observed Ly emission in the diffuse halos is probably originated from the galaxy H ii-regions and scattered to the line of sight by extended H i gas in the galaxy’s circum-galactic medium (CGM), LAEs could exhibit Ly halos weaker than LBGs due to their smaller amounts of H i gas in the CGM. This scenario is consistent with our argument of low of LAE. Interestingly, that interpretation also consistently explains the results of direct LyC detections of galaxies that reveal a high for LAEs () than LBGs () (Iwata et al., 2009; Nestor et al., 2011, 2013). Thus, an origin of the high in LAEs would be their optically thin H i gas surrounding star-forming regions. A similar suggestion of the high is inferred for GPs (Jaskot & Oey, 2013). The local LyC leakers show an comparably high as LBGs (; Bergvall et al. 2006; Leitet et al. 2013), and thus have an [O iii][O ii] ratio as high as LBGs.
LAEs with a high would play a key role in supplying
ionizing photons for cosmic reionization in the early universe.
Previous galaxy surveys have suggested that the
universe could not be totally ionized by galaxies alone at
if one assumes similar properties of galaxies at
that include
(e.g., Ouchi et al. 2009; Robertson et al. 2010).
Because the fraction of LAEs in star-forming galaxies increases
with redshift (at least up to ;
e.g., Ouchi et al. 2008; Vanzella et al. 2009; Stark et al. 2010, 2011; Hayes et al. 2011),
the average for galaxies would be higher
than that for galaxies. The higher for
galaxies may resolve the problem of ionizing photon
deficit in cosmic reionization.
Note that the number of observed LAEs suddenly drops from
to .
This could be due to the Ly damping absorption of partly
neutral IGM
(Vanzella et al., 2011; Pentericci et al., 2011; Ono et al., 2012; Schenker et al., 2012)
or optically thick systems in the intervening IGM
(Bolton & Haehnelt, 2013).
Alternatively, the decreasing fraction of LAEs could be
explained by the intrinsic decrease of galaxies with
strong Ly emission at (Dijkstra et al., 2014).
If we assume the former scenarios, galaxies with an
intrinsically bright Ly line would not decrease from
to .
However, this is still an open question.
A similar implication is provided by Schenker et al. (2013) on the
basis of a small velocity offset of Ly line with respect to
the systemic velocity for galaxies.
We also note that this picture would be consistent with the
observational fact that gas fraction of star-forming galaxies
increases with redshift, or more properly, with sSFR
(e.g., Tacconi et al. 2010, 2013; Santini et al. 2014).
If the molecular gas exists in dense cores of clumps embedded in
density-bounded nebulae ionized by young stars, the galaxy could
have a high gas fraction and high .
A dense molecular gas clump could reside inside the H ii-region,
since the dense gas could be self-shielded from ionizing radiation.
A good example is found in the Orion nebula
(see, e.g., Genzel & Stutzki 1989 for a review).
Such clumpy geometry of dense molecular gas could explain the
high gas fraction, active star-formation, and high in
high- LAEs.
In the discussion of high for LAEs, there is one caveat that Ly emission would become weaker in a high , because less ionizing photons are spent for making ionized gas that emit Ly. Therefore, LAEs may not be a population of high . The dashed curve in Figure 13 shows the relation between EW(Ly) and predicted by our cloudy models. Here we assume cm s-1 and , typical values observed in GPs (Amorín et al., 2010) and LAEs (Nakajima et al. 2013). The dashed curve presents that the EW(Ly) decreases sharply if its are over . However, in , EW(Ly) remains unchanged within a factor of . We have checked that the overall trends are the same, adopting other values of and . For example, EW(Ly) increases (decreases) by a factor of for (). LAEs are usually defined as galaxies with EW(Ly) Å. If an escape fraction is very high, , a galaxy cannot be observed as an LAE. However, LAEs, or galaxies with EW(Ly) Å, can exist in the range of . Since a very high of is not required for cosmic reionization but only (Robertson et al., 2013), the weakening of Ly in density-bounded nebulae does not rule out the possibility that major ionizing sources are LAEs. Figure 13 also compares our model and the recent observational results for LAEs and LBGs whose are measured from LyC fluxes (Nestor et al., 2013)111111 We refer to Nestor et al. (2011) and Shapley et al. (2003) for the ranges of EW(Ly) of LAEs and LBGs, respectively. . EW(Ly) values of our model are regarded as upper limits, because EW(Ly) decreases by dust extinction and hydrogen scattering. The observational results fall below our model, and are consistent with our model. The observations indicate a positive correlation between and EW(Ly) in , while our model shows a nearly constant EW(Ly) in this regime. This difference would infer that LAEs have a less dust extinction, a more homogeneous geometry for isotropic Ly scattering, a less metallicity, and more ionizing photons than LBGs.
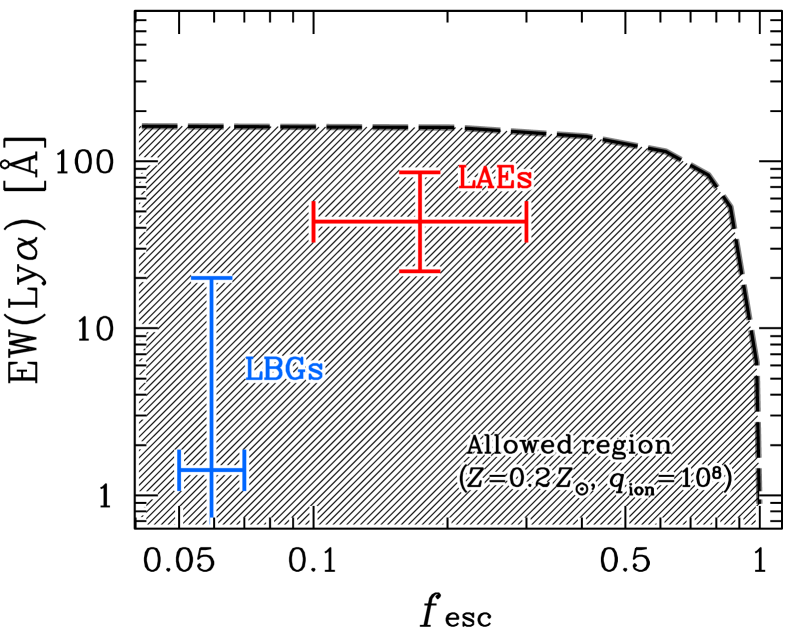
We note that our calculations assume a density-bounded nebula with a spherically closed geometry, and predict dependencies of on the emergent spectra. A volume filling factor of the ionized gas is assumed to be unity. Thus, we have presented this specific case of EW(Ly) as a function of . However, the EW(Ly) and involve various complex physical effects. EW(Ly) depends on gas and dust geometries (e.g., Neufeld 1991; Scarlata et al. 2009; cf. Duval et al. 2014) and galactic scale outflow (e.g., Kunth et al. 1998; Verhamme et al. 2006). anti-correlates with a covering fraction of neutral gas. Recent spectroscopic studies suggest a low covering fraction of neutral gas in high- star-forming galaxies (e.g., Shapley et al. 2003; Steidel et al. 2010; Jones et al. 2013). There exist the other complex physics of EW(Ly) and . Nevertheless, our analysis reveals the relation of EW(Ly) and for the case that H ii-regions are homogeneous density-bounded nebulae.
6 Summary
We investigate ionization state of hot ISM in galaxies at with SDSS galaxies and intermediate and high redshift galaxies, using an ionization parameter and metallicity sensitive line ratios of [O iii][O ii] and [O iii][O ii]H (-index). Our main results are summarized as follows.
- •
-
•
We find a high ionization parameter in local extreme populations of green pea galaxies (GPs), Lyman-continuum emitting galaxies (LyC leakers), and Lyman break analogs (LBAs), and the ionization parameters of these galaxies are comparable with the ones of galaxies (Figure 3). These local extreme populations are quite rare, and their number densities are nearly two orders of magnitude smaller than those of galaxies.
-
•
We identify a correlation between the [O iii][O ii] ratio and galaxy global properties of star-formation rate (SFR), stellar mass (), and metallicity (Figure 4). A high [O iii][O ii] ratio is found in less massive, efficiently star-forming, and metal-poor galaxies.
-
•
We develop a four-dimensional relation of ionization parameter, SFR, , and metallicity (Figure 5), extending the fundamental metallicity relation (FMR; Mannucci et al. 2010; Lara-López et al. 2010) with ionization parameter. The intermediate and high- galaxies up to as well as the local extreme populations follow the same relation defined with the SDSS galaxies (Figure 7). The relation is thus referred to as the fundamental ionization relation (FIR).
-
•
We particularly find no significant differences between galaxies at and in the FIR (Figure 7). This is in contrast with the FMR whose possible evolution from to is reported (Mannucci et al., 2010). We suggest that the FMR evolution can arise, if one omits ionization parameter differences and adopts local empirical metallicity relations for high- galaxies. We indicate that the FMR evolution does not exist for one out of two average metallicity solutions of galaxies with a high ionization parameter of cm s-1 (right panel of Figure 9).
-
•
We find the LyC leakers exhibit [O iii][O ii] ratios significantly higher than typical low- galaxies, although there are only two LyC leakers. This trend suggests a positive correlation between [O iii][O ii] and ionizing photon escape fraction (). Our photoionization models of cloudy reproduce the trend (Figure 11). Since [O iii][O ii] ratios for galaxies, especially Ly emitters (LAEs), are comparable to, or higher than, those of the low- LyC leakers, these high- galaxies are candidates of high objects.
-
•
Our cloudy photoionization models reveal that EW(Ly) remains almost unchanged if its is (Figure 13), indicating that galaxies are identified as LAEs of a Ly emitting population if their values are below . Faint galaxies with intrinsically-bright Ly having a high could significantly contribute to the ionizing photon production for cosmic reionization, since recent observations report that a fraction of LAEs in star-forming galaxies increases with redshift at the epoch with no IGM damping absorption (e.g., Ouchi et al. 2008; Vanzella et al. 2009; Stark et al. 2010, 2011). If it is true, this would ease the tension of ionizing photon deficit problem (e.g., Ouchi et al. 2009; Robertson et al. 2010).
Acknowledgments We are grateful to Tohru Nagao, Lisa J. Kewley, Kazuhiro Shimasaku, Filippo Mannucci, Giovanni Cresci, Alessandro Marconi, Eros Vanzella, Maritza Lara-Lopez, Masato Onodera, Jarle Brinchmann, Maryam Shirazi, Yuu Niino, Ken-ichi Tadaki, Sally Oey, Kentaro Motohara, Toshikazu Shigeyama, Yuzuru Yoshii, Hideyuki Kobayashi, and Nobunari Kashikawa for their helpful comments and suggestions. A careful reading and valuable report by the referee is very much appreciated. We thank the MPA/JHU teams which made their measured quantities on SDSS galaxies publicly available. This work was supported by World Premier International Research Center Initiative (WPI Initiative), MEXT, Japan, and KAKENHI (23244025) Grant-in-Aid for Scientific Research (A) through Japan Society for the Promotion of Science (JSPS). K.N. also acknowledges the JSPS Research Fellowship for Young Scientists.
References
- Amorín et al. (2010) Amorín, R. O., Pérez-Montero, E., Vílchez, J. M., 2010, 715, L128
- Asplund et al. (2009) Asplund, M., Grevesse, N., Sauval, A. J., Scott, P., 2009, ARA&A, 47, 481
- Atek et al. (2011) Atek, H.,et al., 2011, ApJ, 743, 121
- Baldwin et al. (1981) Baldwin, J. A., Phillips, M. M., Terlevich, R., 1981, PASP, 93, 5
- Basu-Zych et al. (2007) Basu-Zych, A. R., et al., 2007, ApJS, 173, 457
- Belli et al. (2013) Belli, S., Jones, T., Ellis, R. S., Richard, J., 2013, ApJ, 772, 141
- Bergvall & Östlin (2002) Bergvall, N., Östlin, G., 2002, A&A, 390, 891
- Bergvall et al. (2006) Bergvall, N., Zackrisson, E., Andersson, B. -G., Arnberg, D., Masegosa, J., Östlin, G., 2006, A&A, 448, 513
- Bolton & Haehnelt (2013) Bolton, J. S., Haehnelt, M. G., 2013, MNRAS, 429, 1695
- Bouwens et al. (2011) Bouwens, R. J., et al., 2011, ApJ, 737, 90
- Brinchmann et al. (2004) Brinchmann, J., Charlot, S., White, S. D. M., Tremonti, C., Kauffmann, G., Heckman, T., Brinkmann, J., 2004, MNRAS, 351, 1151
- Brinchmann et al. (2008) Brinchmann, J., Pettini, M., Charlot, S., 2008, MNRAS, 385, 769
- Calzetti et al. (2000) Calzetti, D., Armus, L., Bohlin, R. C., Kinney, A. L., Koornneef, J., Storchi-Bergmann, T., 2000, ApJ, 533, 682
- Cardamone et al. (2009) Cardamone, C., et al., 2009, MNRAS, 399, 1191
- Cardelli et al. (1989) Cardelli, J. A., Clayton, C., Mathis, J. S., 1989, ApJ, 345, 245
- Chabrier (2003) Chabrier, G., 2003, PASP, 115, 763
- Charlot & Longhetti (2001) Charlot, S., Longhetti, M., 2001, MNRAS, 323, 887
- Christensen et al. (2012a) Christensen, L., et al., 2012a, MNRAS, 427, 1953
- Christensen et al. (2012b) Christensen, L., et al., 2012b, MNRAS, 427, 1973
- Cresci et al. (2012) Cresci, G., Mannucci, F., Sommariva, V., Maiolino, R., Marconi, A., Brusa, M., 2012, MNRAS, 421, 262
- Cullen et al. (2014) Cullen, F., Cirasuolo, M., McLure, R. J., Dunlop, J. S., Bowler, R. A. A. 2014, MNRAS, 440, 2300
- Daddi et al. (2007) Daddi, E., et al., 2007, ApJ, 670, 156
- Davé (2008) Davé, R., 2008, MNRAS, 385, 147
- Davé et al. (2011) Davé, R., Finlator, K., Oppenheimer, B. D., 2011, MNRAS, 416, 1354
- Dayal et al. (2013) Dayal, P., Ferrara, A., Dunlop, J. S., 2013, MNRAS, 430, 2891
- Dijkstra et al. (2014) Dijkstra, M., Wyithe, S., Haiman, Z., Mesinger, A., Pentericci, L., 2014, arXiv e-prints, arXiv:1401.7676
- Dopita et al. (2000) Dopita, M. A., Kewley, L. J., Heisler, C. A., Sutherland, R. S., 2000, ApJ, 542, 224
- Dopita et al. (2006a) Dopita, M. A., et al., 2006a, ApJ, 647, 244
- Dopita et al. (2006b) Dopita, M. A., et al., 2006b, ApJS, 167, 177
- Dunkley et al. (2009) Dunkley, J., et al., 2009, ApJS, 180, 306
- Duval et al. (2014) Duval, F., Schaerer, D., Östlin, G., Laursen, P., 2014, A&A, 562, 52
- Ellison et al. (2008) Ellison, S. L., Patton, D. R., Simard, L., McConnachie, A. W., 2008, ApJ, 672, L107
- Erb et al. (2006) Erb, D. K., Shapley, A. E., Pettini, M., Steidel, C. C., Reddy, N. A., Adelberger, K. L., 2006, ApJ, 644, 813
- Erb et al. (2010) Erb, D. K., Pettini, M., Shapley, A. E., Steidel, C. C., Law, D. R., Reddy, N. A., 2010, ApJ, 719, 1168
- Fan et al. (2006) Fan, X., et al., 2006, AJ, 132, 117
- Feldmeier et al. (2013) Feldmeier, J. J., et al., 2013, ApJ, 776, 75
- Ferland et al. (1998) Ferland, G. J., et al., 1998, PASP, 110, 761
- Ferland et al. (2013) Ferland, G. J., et al., 2013, RMxAA, 49, 137
- Finkelstein et al. (2009) Finkelstein, S. L., et al., 2009, ApJ, 700, 376
- Fosbury et al. (2003) Fosbury, R. A. E., et al., 2003, ApJ, 596, 797
- Genzel & Stutzki (1989) Genzel, R., Stutzki, J., 1989, ARA&A, 27, 41
- Giammanco et al. (2005) Giammanco, C., Beckman, J. E., Cedrés, B, 2005, A&A, 438, 599
- Gilbank et al. (2010) Gilbank, D. G., Baldry, I. K., Balogh, M. L., Glazebrook, K., Bower, R. G., 2010, MNRAS, 405, 2594
- Hainline et al. (2009) Hainline, K. N., Shapley, A. E., Kornei, K. A., Pettini, M., Buckley-Geer, E., Allam, S. S., Tucker, D. L., 2009, ApJ, 701, 52
- Hashimoto et al. (2013) Hashimoto, T., et al., 2013, ApJ, 765, 70
- Hayes et al. (2011) Hayes, M., Schaerer, D., Östlin, G., Mas-Hesse, J. M., Atek, H., Kunth, D., 2011, ApJ, 730, 8
- Heckman et al. (2005) Heckman, T. M., et al., 2005, ApJL, 619, L35
- Heckman et al. (2011) Heckman, T. M., et al., 2011, ApJ, 730, 5
- Henry et al. (2013) Henry, A., Kartin, C. L., Finlator, K., Dressler, A., 2013, ApJ, 769, 148
- Holden et al. (2014) Holden, B. P., et al., 2014, arXiv e-prints, arXiv:1401.5490
- Hoopes et al. (2007) Hoopes, C. G., et al., 2007, ApJS, 173, 441
- Iwata et al. (2009) Iwata, I., et al., 2009, ApJ, 692, 1287
- Izotov et al. (2011) Izotov, Y. I., Guseva, N. G., Thuan, T. X., 2011, ApJ, 728, 161
- Jaskot & Oey (2013) Jaskot, A. E., Oey, M. S., 2013, ApJ, 766, 91
- Jones et al. (2013) Jones, T. A., Ellis, R. S., Schenker, M. A., Stark, D. P., 2013, ApJ, 779, 52
- Kakazu et al. (2007) Kakazu, Y., Cowie, L. L., Hu, E. M., 2007, ApJ, 668, 853
- Kauffmann et al. (2003a) Kauffmann, et al., 2003a, MNRAS, 346, 1055
- Kauffmann et al. (2003b) Kauffmann, G., et al., 2003b, MNRAS, 341, 33
- Kennicutt (1998) Kennicutt, R. C., Jr., 1998, ARA&A, 36, 189
- Kewley & Dopita (2002) Kewley, L. J., Dopita, M. A., 2002, ApJS, 142, 35
- Kewley et al. (2013a) Kewley, L. J., Maier, C., Yabe, K., Ohta, K., Akiyama, M., Dopita, M. A., Yuan, T., 2013a, ApJ, 774L, 10
- Kewley et al. (2013b) Kewley, L. J., et al., 2013b, ApJ, 774, 100
- Kobulnicky & Kewley (2004) Kobulnicky, H. A., Kewley, L. J., 2004, ApJ, 617, 240
- Kornei et al. (2010) Kornei, A. K., Shapley, A. E., Steidel, C. C., Reddy, N. A., Pettini, M., Bogosavljević, M., 2010, ApJ, 711, 693
- Kroupa (2001) Kroupa, P., 2001, MNRAS, 322, 231
- Kunth et al. (1998) Kunth, D., Mas-Hesse, J. M., Terlevich, E., Terlevich, R., Lequeux, J., Fall, S. M., 1998, A&A, 334, 11
- Lara-López et al. (2010) Lara-López, M. A., et al., 2010, A&A, 521, L53
- Lara-López et al. (2013) Lara-López, M. A., et al., 2013, MNRAS, 434, 451
- Leitet et al. (2011) Leitet, E., Bergvall, N., Piskunov, N. Andersson, B. -G., 2011, A&A, 532, A107
- Leitet et al. (2013) Leitet, E., Bergvall, N., Hayes, M., Linné, S., Zackrisson, E., 2013, A&A, 553, A106
- Leitherer et al. (1999) Leitherer, C., et al., 1999, ApJS, 123, 3
- Levesque & Richardson (2013) Levesque, E. M., Richardson, M. L. A., 2013, ApJ, 780, 100
- Lilly et al. (2003) Lilly, S. J., Carollo, C. M., Stockton, A. N., 2003, ApJ, 597, 730
- Liu et al. (2008) Liu, X., Shapley, A. E., Coil, A. L., Brinchmann, J., Ma, C. -P., 2008, ApJ, 678, 758
- López-Sánchez et al. (2012) López-Sánchez, Á. R., Dopita, M. A., Kewley, L. J., Zahid, H. J., Nicholls, D. C., Scharwächter, J., 2012, MNRAS, 426, 2630
- Maier et al. (2005) Maier, C., Lilly, S. J., Carollo, C. M., Stockton, A., Brodwin, M., 2005, ApJ, 634, 849
- Maiolino et al. (2008) Maiolino, R., et al., 2008, A&A, 488, 463
- Mannucci et al. (2009) Mannucci, F., et al., 2009, MNRAS, 398, 1915
- Mannucci et al. (2010) Mannucci, F., Cresci, G., Maiolino, R., Marconi, A., Gnerucci, A., 2010, MNRAS, 408, 2115
- Mannucci et al. (2011) Mannucci, F., Salvaterra, R., Campisi, M. A., 2011, MNRAS, 414, 1263
- Nagao et al. (2006) Nagao, T., Maiolino, R., Marconi, A., 2006, A&A, 459, 85
- Nagao et al. (2011) Nagao, T., Maiolino, R., Marconi, A., Matsuhara, H., 2011, A&A, 526, 149
- Nakajima et al. (2012) Nakajima, et al., 2012, ApJ, 745, 12
- Nakajima et al. (2013) Nakajima, K., Ouchi, M., Shimasaku, K., Hashimoto, T., Ono, Y., Lee, J. C., 2013, ApJ, 769, 3
- Narayanan & Davé (2013) Narayanan, D., Davé, R., 2013, MNRAS, 436, 2892
- Nestor et al. (2011) Nestor, D. B., Shapley, A. E., Steidel, C. C., Siana, B., 2011, ApJ, 736, 18
- Nestor et al. (2013) Nestor, D. B., Shapley, A. E., Kornei, K. A., Steidel, C. C., Siana, B., 2013, ApJ, 765, 47
- Neufeld (1991) Neufeld, D. A., 1991, ApJL, 370, L85
- Niino (2012) Niino, Y., 2012, ApJ, 761, 126
- Oey & Kennicutt (1997) Oey, M. S., Kennicutt, R. C., Jr., 1997, MNRAS, 291, 827
- Ono et al. (2012) Ono Y., et al., 2012, ApJ, 744, 83
- Osterbrock (1989) Osterbrock, D. E., 1989, Astrophysics of Gaseous Nebulae and Active Galactic Nuclei (Suasalito, CA: University Science Books)
- Ouchi et al. (2008) Ouchi, M., et al., 2008, ApJS, 176, 301
- Ouchi et al. (2009) Ouchi, M., et al., 2009, ApJ, 706, 1136
- Overzier et al. (2008) Overzier, R. A., et al., 2008, ApJ, 677, 37
- Overzier et al. (2009) Overzier, R. A., et al., 2009, ApJ, 706, 203
- Pagel et al. (1979) Pagel, B. E. J., Edmunds, M. G., Blackwell, D. E., Chun, M. S., Smith, G., 1979, MNRAS, 189, 95
- Pellegrini et al. (2012) Pellegrini, E. W., Oey, M. S., Winkler, P. F., Points, S. D., Smith, R. C., Jaskot, A. E., Zastrow, J., 2012, ApJ, 755, 40
- Pentericci et al. (2011) Pentericci, L., et al., 2011, ApJ, 743, 132
- Pettini & Pagel (2004) Pettini, M., Pagel, B. E. J., 2004, MNRAS, 348, L59
- Pettini et al. (2001) Pettini, M., et al., 2001, ApJ, 554, 981
- Queyrel et al. (2009) Queyrel, J., et al., 2009, A&A, 506, 681
- Rahmati et al. (2013) Rahmati, A., Schaye, J., Pawlik, A. H., Raičevic̀, M., 2013, MNRAS, 431, 2261
- Richard et al. (2011) Richard, J., Jones, T., Ellis, R., Stark, D. P., Livermore, R., Swinbank, M., 2011, MNRAS, 413, 643
- Richardson et al. (2013) Richardson, M. L. A., Levesque, E. M., McLinden, E. M., Malhotra, S., Rhoads, J. E., Xia, L., 2013, arXiv e-prints, arXiv:1309.1169
- Rigby et al. (2011) Rigby, J. R., Wuyts, E., Gladders, M. D., Sharon, K., Becker, G. D., 2011, ApJ, 732, 59
- Robertson et al. (2010) Robertson, B. E., Ellis, R. S., Dunlop, J. S., McLure, R. J., Stark, D. P., 2010, Nature, 468, 55
- Robertson et al. (2013) Robertson, B. E., et al., 2013, ApJ, 768, 71
- Salim et al. (2007) Salim, S., et al., 2007, ApJS, 173, 267
- Santini et al. (2014) Santini, P., et al., 2014, A&A, 562, 30
- Savaglio et al. (2005) Savaglio, S., et al., 2005, ApJ, 635, 260
- Scarlata et al. (2009) Scarlata, C., et al., 2009, ApJL, 704, L98
- Schenker et al. (2012) Schenker, M. A., et al., 2012, ApJ, 744, 179
- Schenker et al. (2013) Schenker, M. A., Ellis, R. S., Konidaris, N. P., Stark, D. P., 2013, ApJ, 777, 63
- Shapley et al. (2003) Shapley, A. E., Steidel, C. C., Pettini, M., Adelberger, K. L., 2003, ApJ, 588, 65
- Shapley et al. (2005) Shapley, A. E., Coil, A. L., Ma, C. -P., Bundy, K., 2005, ApJ, 635, 1006
- Shibuya et al. (2014a) Shibuya, T., et al., 2014a, arXiv e-prints, arXiv:1402.1168
- Shibuya et al. (2014b) Shibuya, T., et al., 2014b, ApJ, 785, 64
- Shields (1990) Shields, G. A., 1990, ARA&A, 28, 525
- Shirazi et al. (2013) Shirazi, M., Brinchmann, J., Rahmati, A., 2013, arXiv e-prints, arXiv:1307.4758
- Stark et al. (2010) Stark, D. P., Ellis, R. S., Chiu, K., Ouchi, M., Bunker, A., 2010, MNRAS, 408, 1628
- Stark et al. (2011) Stark, D. P., Ellis, R. S., Ouchi, M., 2011, ApJ, 728, L2
- Stark et al. (2013) Stark, D. P., Schenker, M. A., Ellis, R. S., Robertson, B. E., McLure, R., Dunlop, J., 2013, ApJ, 763, 129
- Steidel et al. (2010) Steidel, C. C., et al., 2010, ApJ, 717, 289
- Steidel et al. (2011) Steidel, C. C., Bogosavljevic, M., Shapley, A. E., Kollmeier, J. A., Reddy, N. A., Erb, D. K., Pettini, M., 2011, ApJ, 736, 160
- Storchi-Bergmann et al. (1994) Storchi-Bergmann, T., Calzetti, D., Kinney, A. L., 1994, ApJ, 429, 572
- Tacconi et al. (2010) Tacconi, L. J., et al., 2010, Nature, 463, 781
- Tacconi et al. (2013) Tacconi, L. J., et al., 2013, ApJ, 768, 74
- Terlevich et al. (1993) Terlevich, E., Díaz, A. I., Terlevich, R., Vargas, M. L. G., 1993, MNRAS, 260, 3
- Tremonti et al. (2004) Tremonti, C. A., et al., 2004, ApJ, 613, 898
- van der Wel et al. (2011) van der Wel, A., et al., 2011, ApJ, 742, 111
- Vanzella et al. (2006) Vanzella, E., et al., 2006, A&A, 454, 423
- Vanzella et al. (2009) Vanzella, E., et al., 2009, ApJ, 695, 1163
- Vanzella et al. (2011) Vanzella, E., et al., 2011, ApJL, 730, L35
- Verhamme et al. (2006) Verhamme, A., Schaerer, D., Maselli, A., 2006, A&A, 460, 397
- Verhamme et al. (2012) Verhamme, A., et al., 2012, A&A, 546, A111
- Villar-Martín et al. (2004) Viilar-Martín, M., Cerviño, M., Delgado, G., 2004, MNRAS, 355, 1132
- Wuyts et al. (2012) Wuyts, E., Rigby, J. R., Sharon, K., Gladders, M. D., 2012, ApJ, 755, 73
- Yabe et al. (2012) Yabe, K., et al., 2012, PASJ, 64, 60
- Yajima et al. (2012) Yajima, H., Li, Y., Zhu, Q., Abel, T., Gronwall, C., Ciardullo, R., 2012, ApJ, 754, 118
- Zackrisson et al. (2013) Zackrisson, E., Inoue, A. K., Jensen, H., 2013, ApJ, 777, 39
- Zahid et al. (2011) Zahid, H. J., Kewley, L. J., & Bresolin, F., 2011, ApJ, 730, 137
- Zheng & Wallace (2013) Zheng, Z., Wallace, J., 2013, arXiv e-prints, arXiv:1308.1405