Benchmarking Summarizability Processing in XML Warehouses with Complex Hierarchies
Abstract
Business Intelligence plays an important role in decision making. Based on data warehouses and Online Analytical Processing, a business intelligence tool can be used to analyze complex data. Still, summarizability issues in data warehouses cause ineffective analyses that may become critical problems to businesses. To settle this issue, many researchers have studied and proposed various solutions, both in relational and XML data warehouses. However, they find difficulty in evaluating the performance of their proposals since the available benchmarks lack complex hierarchies. In order to contribute to summarizability analysis, this paper proposes an extension to the XML warehouse benchmark (XWeB) with complex hierarchies. The benchmark enables us to generate XML data warehouses with scalable complex hierarchies as well as summarizability processing. We experimentally demonstrated that complex hierarchies can definitely be included into a benchmark dataset, and that our benchmark is able to compare two alternative approaches dealing with summarizability issues.
category:
H.2.7 Database Management Database Administrationkeywords:
Benchmark, XML warehouse, OLAP, TPC-H, Complex hierarchies, Summarizability, XWeB1 Introduction
With the world in competitive business and innovation, Business Intelligence (BI) and Data Warehouses (DWs) play a major role in decision support. BI is famed for its complex analyses in many areas such as customer behavior, business trends, and new opportunities. BI heavily relies on DWs for storing and managing data. Without effective DWs, organizations cannot extract the required information for decision support. In addition, Online Analytical Processing (OLAP) is a notable BI tool for information analysis. To allow OLAP analyses, DWs are modeled as multidimensional structures [2, 21], where an observed fact is described by several hierarchical dimensions (star or snowflake schema).
DWs are designed to collect possible historical and concurrent data from various resources. This effort may produce complex hierarchies [3, 14, 20] that impact effective multidimensional analysis. For example, a book in an online bookstore may belong to more than one category (e.g., database and Web), and some book-sales may miss customer information if they are sold to anonymous customers. Such hierarchical information may lead to analysis errors, e.g., if we are trying to calculate the total quantity of books of computer science, which is the parent category of database and Web, or the total amount of sales by customer region. Such errors critically lead to poor or wrong decisions. These issues are termed as summarizability issues [9, 11, 12, 15, 19] and have been extensively surveyed by Mazòn et al. [16].
Concurrently, many people, companies, and organizations share information via online business, management, and social networking. The eXtensible Markup Language (XML) is widely used as a standard format for representing, transferring, and sharing data on the Web. Moreover, the XML tree-like format tends to be more efficient in representing complex hierarchical data than traditional relations of DWs [3].
Finally, many benchmarks support performance evaluation, including both relational and XML decision support benchmarks. Still, researchers have difficulty in evaluating the performance of summarizability processing algorithms, since there exists no benchmark with scalable complex hierarchies. In order to fill in this gap, we extend in this paper the XML data warehouse benchmark [13] with scalable complex hierarchy generation and summarizability processing.
The remainder of this paper is organized as follows. Section 2 formally defines complex hierarchies and discusses related work. Section 3 presents the data model and the algorithms we design for complex hierarchy generation, a query workload inducing summarizability issues and the performance metrics of our benchmark. Section 4 illustrates the applicability of our benchmark through experiments. Section 5 gives the conclusion and perspectives of this work..
2 Background
In this section, we characterize complex hierarchies, which cause summarizability issues and present the research literatures related to decision support benchmarks.
2.1 Complex Hierarchies
We term a dimension hierarchy as complex if it is both non-strict and incomplete.
2.1.1 Non-Strict Hierarchy
A hierarchy is non-strict [1, 14, 24] or multiple-arc [20] when an attribute is multivalued. In other terms, from a conceptual point of view, a hierarchy is non-strict if the relationship between two hierarchical levels is many-to-many instead of one-to-many. For example, in a dimension describing products, a product may belong to several categories instead of just one.
Similarly, a many-to-many relationship between facts and dimension instances may exist [20]. For instance, in a sale data warehouse, a fact may be related to a combination of promotional offers rather than just one.
2.1.2 Incomplete Hierarchy
A hierarchy is incomplete [16], non-covering [1, 14, 24] or ragged [20] if an attribute allows linking between two hierarchical levels by skipping one or more intermediary levels. For example, in a dimension describing stores, the hierarchy allows a store to be located in a given region without being related to a city (stores in rural areas).
Similarly, facts may be described at heterogeneous granularity levels. For example, in our sale data warehouse, sale volume may be known at the store level in one part of the world (e.g., Europe), but only at a more aggregate level (e.g., country) in other geographical areas.
2.1.3 Discussion
Dimension hierarchy characterizations vary widely in the literature related to multidimensional models. For example, Beyer et al. name complex hierarchies ragged hierarchies [3], while Rizzi defines ragged hierarchies as incomplete only [20]. Malinowski and Zimànyi also use the terms of complex generalized hierarchy [14]. Even though they include incomplete hierarchies, they do not include non-strict hierarchies. Thus, we prefer the term complex hierarchies.
Finally, note that some papers, addressing the summarizability problem, differentiate between intradimensional relationships and fact-to-dimension relationships [16]. By contrast, as Pedersen et al. [19], we consider that summarizability issues and solutions are the same in both cases, since facts may be viewed as the finest granularity in the dimension set.
2.2 Related Work
2.2.1 Relational Decision Support Benchmarks
The Transaction Processing Performance Council (TPC) defines standard benchmarks and publishes objectives and verifiable performance evaluations to the industry. The TPC currently supports two decision support benchmarks: TPC-H and TPC-DS.
TPC-H’s database follows a classical product-order-supplier relational model [26]. Its workload is constituted of twenty-two SQL-92, parameterized, decision support queries, and two refreshing functions that insert tuples into and delete tuples from the database, respectively. Query parameters are randomly instantiated following a uniform law. Three primary metrics are used in TPC-H. They describe performance in terms of power, throughput, and a combination of these two criteria. Power and throughput are the geometric and arithmetic mean values of database size divided by workload execution time, respectively.
Although decision-oriented, TPC-H’s database schema is not a typical star-like data warehouse schema. Moreover, its workload does not include any explicit OLAP query. The TPC-DS benchmark addresses this shortcoming [25]. TPC-DS’ schema represents the decision support functions of a retailer under the form of a constellation schema with several fact tables and shared dimensions. TPC-DS’s workload is constituted of four classes of queries: reporting, ad-hoc decision support, interactive OLAP, and extraction queries. SQL-99 query templates help randomly generate a set of about five hundred queries, following non-uniform distributions. The warehouse maintenance process includes a full Extract, Transform, and Load (ETL) phase, and handles dimensions with respect to their nature (non-static dimensions scale up while static dimensions are updated). One primary metric is proposed in TPC-DS to take both query execution and the maintenance phase into account.
The Star Schema Benchmark (SSB) has been proposed as a simpler alternative to TPC-DS [17]. It is based on TPC-H’s database remodeled as a star schema. It is basically designed around an order fact table merged from two TPC-H tables. More interestingly, SSB features a query workload that provides both functional and selectivity coverages.
In TPC-H, TPC-DS, and SSB, scaling is achieved through a scale factor SF that defines data size (from 1 GB to 100 TB). Both database schema and workload are fixed. The number of generated queries in TPC-DS also directly depends on SF. TPC standard benchmarks aim at comparing the performances of different systems in the same experimental conditions, and are intentionally not very tunable. By contrast, the Data Warehouse Engineering Benchmark (DWEB) helps generate various ad-hoc synthetic data warehouse (modeled as star, snowflake, or constellation schemata) and workloads that include typical OLAP queries [6]. DWEB targets data warehouse designers and allows testing the effectiveness of designed choices or optimization techniques in various experimental conditions thanks to complete set of parameters. Thus, it may be viewed more like a benchmark generator than a single benchmark. Nevertheless, DWEB’s complete set of parameters makes it somewhat difficult to master.
2.2.2 XML Decision Support Benchmarks
There are many XML benchmarks such as the Michigan Benchmark [22], MemBer [3], X-Mach [5], XMark [23], XOO7 [4] and XBench [27]. Unfortunately, none of these benchmarks exhibits any decision support feature. XWeB is the only decision support XML benchmark [13].
As in SSB, XWeB’s DW schema is a simplified, snowflake version of TPC-H’s schema. Moreover, XWeB’s DW schema is logically and physically represented in XML. Since existing XML DW architectures mostly differ in the way dimensions are handled and the number of XML documents that are used to store facts and dimensions, XWeB exploits a unified model that is close to XCube [10]. In this representation, an XML DW is composed of three XML documents at the physical level: dw-model.xml defines the multidimensional structure of the warehouse (metadata); each document stores information related to set of facts , including measure values and dimension references; and each document stores dimension ’s hierarchy level instances.
Finally, XWeB’s workload, expressed in XQuery, is constituted of twenty decision support queries labeled to . The workload is structured in increasing order of complexity: reporting ( to ), one dimension cubing ( to ), two dimension cubing ( to ), three dimension cubing ( to ), and complex hierarchy querying ( to ).
2.2.3 Discussion
XWeB includes only one complex hierarchy into its workload, i.e., part/category. Complexity lies on the possible combination of instances in three levels, and queries are restricted by specific levels. Moreover, this complex hierarchy is not scalable and it does not cover all the cases of complex hierarchies defined in Section 2.1.
3 Benchmark Specification
We first present in this section our database model and complex hierarchies (Section 3.1). We further describe how to generate complex hierarchies in the dataset (Section 3.2). Then, we specify the benchmark’s query workload, which operates onto complex hierarchies, induces summarizability issues (Section 3.3), and is aimed at being executed on the dataset to output performance metrics (Section 3.4).
3.1 Data Model
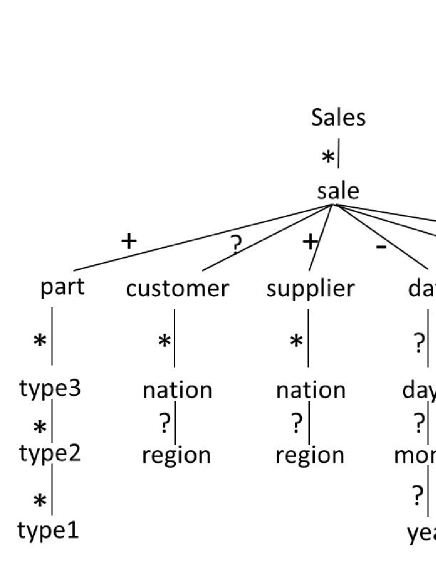
We model our benchmark’s database after TPC-H’s as illustrated in Figure 1. The data model consists of a DW, a fact, four dimensions: , , , and , and two measures: and . Each dimension is subdivided into hierarchical levels. As specified by XWeB, the dimension contains three categorical levels that we label as type3, type2, and type1. Their instances are listed in Table 1. The and dimensions possess two geographical levels: nation and region. The last dimension contains three levels: day, month, and year. In Figure 1, we borrow Annotated Tree Pattern’s (APT) [18] notations to specify the cardinality of relationships (edges); that is : 0 or one, : one only, : 0 to many, and : one to many. Note that relationships reveal complex hierarchies as defined in Section 2.1, i.e., incomplete and non-strict hierarchies. We can interpret the APT notations in Figure 1 into complex hierarchies as follows: : only incompleteness is possible when it is zero, : incompleteness and non-strictness are impossible (simple hierarchy), : incompleteness and non-strictness are possible, and : only non-strictness is possible.
| type3 | ECONOMY, LARGE, STANDARD, PROMO, MEDIUM, SMALL |
|---|---|
| type2 | ANODIZED, BURNISHED, BRUSHED, POLISHED, PLATED |
| type1 | COPPER, NICKEL, STEEL, TIN, BRASS |
At the logical level, we utilize an instance of dw-model.xml to represent the test DW (Figure 2). We exclude attribute values that store fact and dimension IDs from fact and dimension tags for brevity.
At the physical level, fact and dimension instances are stored in a set of XML documents, namely = , = , = , = , and = .
| <?xml version=‘1.0’ encoding=‘UTF-8’?> | |||
| <dw-model> | |||
| <fac | t id=‘sale’ path=‘f_sale.xml’> | ||
| <dim | ension idref=‘part’ path=‘d_part.xml’> | ||
| <typ | e3><type2><type1/></type2></type3> | ||
| </dimension> | |||
| <dimension idref=‘customer’ path=‘d_customer.xml’> | |||
| <nation><region/></nation> | |||
| </dimension> | |||
| <dimension idref=‘supplier’ path=‘d_supplier.xml’> | |||
| <nation><region/></nation> | |||
| </dimension> | |||
| <dimension idref=‘date’ path=‘d_date.xml’> | |||
| <day><month><year/></month></day> | |||
| </dimension> | |||
| <measure id=‘f_quantity’/> | |||
| <measure id=‘f_totalamount’/> | |||
| </fact> | |||
| </dw-model> |
3.1.1 Non-strict Hierarchies
According to the reality of sales, only the and dimensions may have non-strict characteristics w.r.t. facts, since a sale may consist of many parts (special promotion or offer) and many suppliers (many suppliers or a supplied company whose branches are located in various countries). Moreover, non-strict hierarchies can appear among all hierarchical levels of the dimension, as a may belong to many categories and a finer level category may belong to many coarser level categories. The and dimensions may also contain non-strict hierarchies at the nation level in case the or is a company whose branches are located in various countries. However, the hierarchy is strict since a nation belongs to one region only. Lastly, the dimension cannot be non-strict since a sale is restricted to a specific date.
3.1.2 Incomplete Hierarchies
Incomplete hierarchies can occur between the and dimensions in case of anonymous customer, or whose information including nation and region is unknown. Moreover, incompleteness may happen on hierarchical levels of the four dimensions because of missing values.
3.2 Generating Complex Hierarchies
As we pointed out in Section 3.1, complexity in hierarchies may occur at any level of any dimension. We divide the “degree” of complexity into four kinds: simple, incomplete only, non-strict only, and complex (both incomplete and non-strict). To generate a DW with scalable complex hierarchies, we propose some parameters: , , , and .
The number of facts to be generated can be specified by . The occurrence probability of incomplete or non-strict hierarchy instances among the total number of dimension instances are defined by or , respectively. Lastly, the number of non-strict hierarchy instances in a dimension is specified by . Consequently, four kinds of hierarchies can be specified as follows.
-
1.
Simple (default): = 0 and = 0
-
2.
Incomplete: > 0 and = 0
-
3.
Non-strict: > 0, > 1 and = 0
-
4.
Complex: >0, > 0 and > 1
3.2.1 Simple Hierarchies
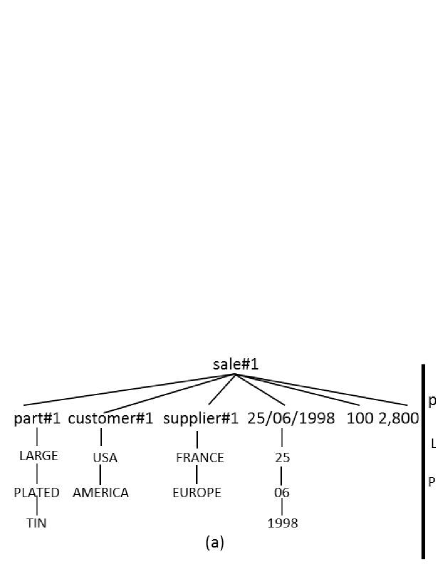
XWeB directly provides simple hierarchies, so there is nothing to enhance at this point. Let us nonetheless provide a running example of fact, modeled as a data tree in Figure 3(a), which we reuse in the following subsections. The example shows that on 25/06/1998, customer #1 from USA of America region bought 100 parts (part #1), costing 2,800 from supplier #1, which is located in France, Europe.
3.2.2 Incomplete Hierarchies
Incomplete hierarchies are generated according to the and parameters. For example, if = 10, 40 dimension instances (1 fact = 4 dimension instances) are generated. A dimension instance includes the dimension and its hierarchical instances. Then, if we set to 50, a hierarchy is randomly removed among every 2 (100/50) dimension instances to form an incomplete hierarchy.
Algorithm 1 depicts incomplete hierarchy generation. An incomplete hierarchy is generated on the dimension specified by the input parameter . We use to verify the occurrences of incomplete hierarchies, that is at least one incomplete hierarchy exists in the given dimension and each level of hierarchy in the dimension is randomly chosen to be removed (for statement of the algorithm). Let us look at the example in Figure 3(b). Suppose that dimension in Figure 3(a) is randomly selected for incompleteness on its first level (“LARGE”). Then, the level “LARGE” is deleted from the dimension.
3.2.3 Non-strict Hierarchies
We use the parameter to specify the distribution of non-strictness. In addition, is used to specify the maximum number of non-strict instances in a dimension. Note that at least two non-strict instances are generated (definition of non-strictness in Section 2.1.1).
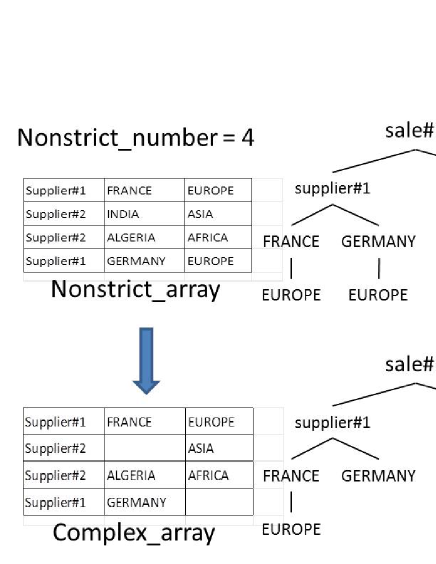
Algorithm 2 depicts non-strict hierarchy generation. Non-strict instances are formed in an array whose rows represent non-strict dimension instances and columns represent hierarchical levels. The input parameter is used to specify the non-strict dimension instance. The algorithm randomly assigns dimension instances to an (non-strict array). Finally, the is translated into an XML segment. Let us look at the example in the upper part of Figure 4. Suppose that the dimension instance of Figure 3 (a) is chosen for non-strictness with = 4. As a result, an array of four rows is created as in the left upper part of Figure 4. The right upper part of the figure shows the data tree translated from the array. In this example, we can see that a sale is supplied by two suppliers (supplier#1 and supplier#2), and each of the suppliers owns two branches located in two different nations.
3.2.4 Complex Hierarchies
Complex hierarchies occur when a dimension instance is chosen for both incompleteness and non-strictness. We use (greater than zero) and (greater than one) to specify non-strictness to be generated on the target dimension. Moreover, is set to be greater than zero to specify that incompleteness is also generated, especially over non-strict dimension instances. Algorithm 3 depicts complex hierarchy generation. Firstly, the algorithm generates a non-strict array using Algorithm 2. Then, the algorithm uses to confirm that at least one non-strict instance is randomly selected. Then incomplete hierarchies are generated only on randomly selected non-strict dimension instances using Algorithm 1. The lower part of Figure 4 illustrates an example. Here, a dimension instance is chosen for both non-strictness (as in the upper part of the figure) and incompleteness. Consequently, an array (left lower part of Figure 4) is generated from by Algorithm 3. Finally, this array is translated into a data tree as in the right lower part of Figure 4, where “EUROPE” and “INDIA” are deleted.
3.3 Query Workload
Since complex hierarchy queries in XWeB run only on the dimension, we complement its workload to cover all possible complex hierarchies on all dimensions, as discussed in Section 3.1. Our benmark’s workload complements XWeB’s to include up to 4-dimension cubing, and also supports both simple and complex hierarchies.
The following list itemizes our workload’s queries on complex hierarchies that build 4-dimension cubes (4D), basic aggregation operations, and some OLAP operations. Queries are presented in natural language for space constraints. A 4D cube is extracted by Q21, i.e., total quantity and amount of sales in groups of part, customer, supplier, and date dimensions. We can also extract a 4D cube at specific hierarchical level of dimensions as in Q22, i.e., min quantity of sales among the groups of dimensions: customer at nation level, part at type3 level, supplier at nation level, and date at day level. Moreover, we can slice the cube into a 3D cube with max aggregation by Q23, i.e., max of total amount among the groups of month, part’s type2, supplier’s nation, and customer’s region. Finally, a 3D cube with average of total amount in groups of supplier’s region, part’s type1, customer’s region, and year is also built by Q24.
-
•
Q21: sum of , from , , , group by , , ,
-
•
Q22: min of from , , , group by , , ,
-
•
Q23: max of from , , , group by , , ,
-
•
Q24: average of from , , , group by , , ,
3.4 Performance Metrics
In this benchmark, we define two performance metrics for summarizability processing algorithms.
The first metric is quantitative: it is response time, i.e., the execution time of the query workload over a given dataset. Whether the overhead of summarizability processing can be distinguished from query processing or not depends on cases, but it is always included in the global execution time.
The second metric is qualitative: when running the benchmark, we check whether aggregation queries provided the expected results, i.e., we check whether summarizability issues are correctly handled. To do so, we check if the resulted groups are not duplicated, the total of aggregation values is equal to grand total, if average is the division of total and its number, min is the least value, or max is the highest value.
4 Experimental Demonstration
To illustrate the feasibility and usefulness of our benchmark, we report in this section experiments in which we compare two methods for processing summarizability issues in DWs with the help of our benchmark. Note that our objective is to show that our benchmark provides useful insights regarding the behavior and performance of such approaches, and not so much to actually compare them.
4.1 Studied Algorithms
The first approach for addressing summarizability issues we test in this paper is a reference approach by Pedersen et al. [19] (labeled Pedersen in the remainder of this section), which we adapt to the XML DW case. Pedersen transforms dimension and fact instances to enforce summarizability by using two algorithms named MakeCovering and MakeStrict. MakeCovering inserts new values, exploited from metadata and/or expert advice, into the missing hierarchical levels to ensure that mappings to coarser hierarchical levels are covering/complete. MakeStrict avoids “double counting” by “fusing” multiple values in a parent hierarchical level into one “fused” value, and then linking the child value to the fused value. Fused values are inserted into a new hierarchical level in-between the child and the parent. Consequently, reusing this new level for computing coarser level aggregate values leads to correct aggregation results. MakeCovering and MakeStrict transform both the DW schema and data, and are applied once in a static way.
The second approach we test is a new, dynamic approach called Query-Based Summarizability [8] (labeled QBS in the remainder of this section). QBS deals with summarizability issues by firstly avoiding multiplying the aggregation of measure instances of a hierarchical level when rolling up to a coarser level in non-strict hierarchies. Thus, when building the set of groups with respect to a grouping criterion, multiple values in the coarser level are fused into one single "fused value". Secondly, when rolling from a hierarchical level up to a coarser level, measure instances of the finer level that are not present in the coarser level must still be agregated (incomplete hierarchies). Thus, when building a group, all "missing instances" are grouped into an artificial "Other" group. By contrast to Pedersen, QBS does not transform schema nor data and applies automatically, on the fly, at query time.
4.2 Experimental Configuration
4.2.1 System Configuration
Our experiments are done on a Toshiba laptop with an Intel(R) Core(TM) i7-2670QM CPU @ 2.20GHz, 4.00 GB of memory, and 64-bit Windows 7 Home Premium Service Pack 1. The algorithms are implemented in Java JDK 1.7 using the SAX parser to read XML data.
4.2.2 Experimental Setup
We use DWs with complex hierarchies scaling in size from 50,000 to 250,000 facts as in the first row of Table 2. The second row ranges simple hierarchy data in kilobytes (27 MB minimum and 134 MB maximum). The third, fourth, and fifth rows list the size of DWs with 5% incomplete, non-strict, and complex hierarchies respectively. The sixth, seventh, and eighth rows denote the size of DWs with 50% incomplete, non-strict, and complex hierarchies respectively.
| No. Facts | 50,000 | 100,000 | 150,000 | 200,000 | 250,000 |
|---|---|---|---|---|---|
| Simple | 27,700 | 55,390 | 82,800 | 110,577 | 138,015 |
| Incomplete 5% | 27,626 | 55,242 | 82,543 | 110,249 | 137,573 |
| Non-strict 5% | 28,669 | 57,328 | 85,671 | 114,422 | 142,786 |
| Complex 5% | 28,376 | 56,742 | 84,791 | 113,252 | 141,319 |
| Incomplete 50% | 25,020 | 50,030 | 74,769 | 99,842 | 124,601 |
| Non-strict 50% | 35,412 | 70,826 | 105,914 | 141,397 | 176,527 |
| Complex 50% | 32,522 | 65,031 | 97,263 | 129,839 | 162,088 |
Among the workload of queries, we focus on four queries with various number of dimensions (labeled : 1D to 4D), and select the most detailed hierarchy levels for grouping since they form more complex groups (Table 3). We roll up the queries to levels day, type3, nation, and nation of the date, part, customer, and supplier dimensions, respectively.
| part | customer | supplier | date | |
|---|---|---|---|---|
| 1D | day | |||
| 2D | type3 | day | ||
| 3D | type3 | nation | day | |
| 4D | type3 | nation | nation | day |
4.3 Experimental Results
The following subsections present our experimental results of comparing QBS and Pedersen. For Pedersen, we differentiate between query execution time and preprocessing overhead, while it is impossible for QBS, as overhead is embedded within query execution.
The following results focus on the response time metric, because both our implementations of Pedersen and QBS compute correct aggregates (the quality metric is met in both cases).
4.3.1 Results on Simple Hierarchies
Our first comparison is run on simple hierarchies only and the results are shown in the left-hand side of Figure 5. Figure 5(a) shows that QBS’ time performance increases linearly with data size and the number of dimensions in the query, except the 3D query on 50,000 facts, which incidentally bears lower grouping complexity. Figure 5(b) shows that the time performance of both approaches increases linearly w.r.t. data size and the number of dimensions used in queries. Moreover, QBS expectingly performs a little worse than Pedersen without overhead, but tends to perform a little better when Pedersen’s overhead is accounted for.
However, both QBS and Pedersen consume a lot of time, especially when running the 4D query (about an hour). To find out the cause, we perform two more experiments, disassociating complex hierarchy processing time from group matching time. This is possible because XWeB’s data are originally summarizable. Figure 5(c) shows that enforcing summarizability in QBS does not much affect time performance, while group matching has a great impact that increases with the number of dimensions. Figure 5(d) confirms that Pedersen also spends most of its time processing group matching, while overhead consumes little time. We notice that, when processing group matching, we indeed need to check whether the group exists. Thus, we must check every hierarchy level instance in the whole group, which contains several instances from all dimensions. Doing so is very time consuming comparing to traditional aggregation, which only checks for the existing group as a whole. However, no approach dealing with summarizability can avoid this issue.
4.3.2 Results on Complex Hierarchies
Due to space limitations, we only present here our experiments on 5% and 50% incomplete, non-strict and complex hierarchies (the approximate minimum and maximum scales), but we did go through the whole range. The results we obtain are shown on the right-hand side of Figure 5.
Incomplete Hierarchies
The results from Figures 5(e) and 5(f) reveal two cases. When the number of dimensions is small (up to query 2D), QBS is comparable to Pedersen when overhead is excluded, and tends to perform better than Pedersen when overhead is included. For a larger number of dimensions (query 3D), both approaches are comparable. Both approaches actually have different tradeoffs. QBS takes less time when reading incomplete data, but more time to solve incompleteness, while the reverse is true for Pedersen. Thus, when the number of dimensions increases, the QBS’s processing of incomplete hierarchies at query time is a handicap that evens global performances w.r.t. Pedersen. Still, we observe that both approaches are affected by the poor performance of group matching, which explains why we did not include query 4D in these experiments.
Non-Strict Hierarchies
The results from Figures 5(g) and 5(h) show similar trends to those of Figures 5(e) and 5(f), because the tradeoffs in QBS and Pedersen are essentially the same for non-strictness management. However, non-strictness processing takes much more time than incompleteness processing in checking the existing non-strict instances in each dimension, as shown in Figures 5(k) and 5(l) for QBS. Ultimately, we can again record that QBS is comparable to Pedersen without overhead, and a little better when overhead is included.
Complex Hierarchies
The results from Figures 5(i) and 5(j) bear similar results to the non-strict case, again because the cost of non-strictness processing is much higher than that of incompleteness processing (Figures 5(k) and 5(l)). Group matching is indeed mainly impacted by non-strict hierarchies. However, in some cases, such as in the 3D query on 250,000 facts in Figure 5(k), QBS performs better in the complex case than in the non-strict case, because non-strict processing incidentally produces fewer complex groups, thus simplifying group matching.
5 Conclusion
To the best of our knowledge, our benchmark is the first XML data warehouse benchmark with complex hierarchies. It has been designed to conform to Gray’s criteria (relevance, portability, scalability, and simplicity) [7]. Our benchmark is relevant since it refers to the TPC-H standard, while adding complex hierarchies that answer to precise engineering needs, i.e., summarizability processing performance testing. The benchmark is portable as it is written in Java, making it easy to implement and connect to various systems, including XML DBMSs. It is scalable by number of facts and complex hierarchy distributions. Finally, it is simple since its model, which is inherited from XWeB, is a simplified, star-like version of TPC-H’s.
Morevover, we demonstrate the use of our benchmark by comparing two approaches that address sumarizability issues when processing complex hierarchies, namely Pedersen and QBS. Our benchmark highlights two main insights. First, run-time summarizability management is feasible, since QBS performs almost as well as Pedersen dynamically, and would retain the same perfomance if DW shema or data changed, while Pedersen would have to be run again. Second, we show that both algorithms spend most of their time processing group matching. This is thus the main process to be optimized in future research on summarizability processing in XML environments.
Finally, a raw, preliminary version of our benchmark111http://eric.univ-lyon2.fr/~ckit/DOLAP12.zip is freely available online as a NetBeans project222http://netbeans.org . A more streamlined version is in the pipe and will be distributed under a Creative Commons license333http://creativecommons.org/licenses/by-nc-sa/2.5/.
In the future, we intend to integrate our benchmark with XWeB, including an XQuery parser that supports where clauses and OLAP operators (slice, dice, rotate, roll-up, drill-down, and cube). Furthermore, it would be interesting to add more unstructured business information (i.e., document-oriented XML data) such as in XMark and XBench into our benchmark.
References
- [1] A. Abelló, J. Samos, and F. Saltor. YAM: A Multidimensional Conceptual Model Extending UML. Inf. Syst., 31(6):541–567, 2006.
- [2] R. Agrawal, A. Gupta, and S. Sarawagi. Modeling Multidimensional Databases. In ICDE, Birmingham, UK, pages 232–243, 1997.
- [3] K. S. Beyer, D. D. Chamberlin, L. S. Colby, F. Özcan, H. Pirahesh, and Y. Xu. Extending XQuery for Analytics. In SIGMOD, Baltimore, Maryland, USA, pages 503–514, 2005.
- [4] S. Bressan, G. Dobbie, Z. Lacroix, M.-L. Lee, Y. G. Li, U. Nambiar, and B. Wadhwa. X007: Applying 007 Benchmark to XML Query Processing Tool. In CIKM, Atlanta, Georgia, USA, pages 167–174, 2001.
- [5] T. B hme and E. Rahm. Multi-user Evaluation of XML Data Management Systems with XMach-1. In EEXTT, Singapore, pages 148–158, 2002.
- [6] J. Darmont, F. Bentayeb, and O. Boussaid. Benchmarking Data Warehouses. IJBIDM, 2(1):79–104, 2007.
- [7] J. Gray, editor. The Benchmark Handbook for Database and Transaction Systems (2nd Ed.). 1993.
- [8] M. Hachicha, C. KIT, and J. Darmont. A Novel Query-Based Approach for Addressing Summarizability Issues in XOLAP. In Submission to COMAD, Pune, India, 2012.
- [9] J. Horner and I.-Y. Song. A Taxonomy of Inaccurate Summaries and Their Management in OLAP Systems. In ER, pages 433–448, 2005.
- [10] W. Hümmer, A. Bauer, and G. Harde. XCube: XML for Data Warehouses. In DOLAP, New Orleans, Louisiana, USA, pages 33–40, 2003.
- [11] C. A. Hurtado, C. Gutiérrez, and A. O. Mendelzon. Capturing Summarizability with Integrity Constraints in OLAP. TODS, 30(3):854–886, 2005.
- [12] H.-J. Lenz and A. Shoshani. Summarizability in OLAP and Statistical Data Bases. In SSDBM, Olympia, Washington, USA, pages 132–143, 1997.
- [13] H. Mahboubi and J. Darmont. XWeB: the XML Warehouse Benchmark. In VLDB/TPCTC, Singapore, volume 6417, pages 185–203, 2010.
- [14] E. Malinowski and E. Zimànyi. Hierarchies in a Multidimensional Model: from Conceptual Modeling to Logical Representation. DKE, 59(2):348–377, 2006.
- [15] S. Mansmann and M. H. Scholl. Empowering the OLAP Technology to Support Complex Dimension Hierarchies. IJDWM, 3(4):31–50, 2007.
- [16] J.-N. Mazón, J. Lechtenbörger, and J. Trujillo. A Survey on Summarizability Issues in Multidimensional Modeling. DKE, 68(12):1452–1469, 2009.
- [17] C. X. O’Neil P., O’Neil E. and R. S. The Star Schema Benchmark and Augmented Fact Table Indexing. In VLDB/TPCTC, Lyon, France, volume 5895, pages 237–252. LNCS, 2009.
- [18] S. Paparizos, Y. Wu, L. V. S. Lakshmanan, and H. V. Jagadish. Tree Logical Classes for Efficient Evaluation of XQuery. In SIGMOD, Paris, France, pages 71–82. ACM, 2004.
- [19] T. B. Pedersen, C. S. Jensen, and C. E. Dyreson. Extending Practical Pre-Aggregation in On-Line Analytical Processing. In VLDB, Edinburgh, Scotland, UK, pages 663–674, 1999.
- [20] S. Rizzi. Conceptual Modeling Solutions for the Data Warehouse. In R. Wrembel and E. Christian Koncilia, editors, Data Warehouses and OLAP: Concepts, Architectures and Solutions, pages 1–26. IRM Press, Hershey, USA, 2007.
- [21] S. Rizzi, A. Abelló, J. Lechtenbörger, and J. Trujillo. Research in Data Warehouse Modeling and Design: Dead or Alive? In DOLAP, Arlington, Virginia, USA, pages 3–10. ACM, 2006.
- [22] K. Runapongsa, J. M. Patel, H. V. Jagadish, Y. Chen, and S. Al-khalifa. The Michigan Benchmark: Towards XML Query Performance Diagnostics. VLDB, Hong Kong, China, 31:97, 2002.
- [23] A. Schmidt, F. Waas, M. L. Kersten, M. J. Carey, I. Manolescu, and R. Busse. Assessing XML Data Management with XMark. In VLDB/EEXTT, Hong Kong, China, pages 144–145, 2002.
- [24] R. Torlone. Conceptual Multidimensional Models. In E. Maurizio Rafanelli, editor, Multidimensional Databases: Problems and Solutions, pages 69–90. IDEA Group Publishing, Hershey, USA, 2003.
- [25] TPC. TPC Benchmark DS (Decision Support) Draft Specification revision 32. TPPC, April 2012.
- [26] TPC. TPC Benchmark H Standard Specification revision 2.14.4. TPPC, April 2012.
- [27] B. B. Yao and M. T. zsu. XBench benchmark and performance testing of XML DBMSs. In ICDE, Boston, MA, USA, pages 621–633, 2004.