The Astrophysics of the Intracluster Plasma
Abstract
Since 1971 observations in X rays of thousands galaxy clusters have uncovered huge amounts of hot baryons filling up the deep gravitational potential wells provided by dark matter (DM) halos with sizes of millions light-years and masses of some . At temperatures K and with average densities of particle per liter, such baryons add up to some . With the neutralizing electrons, they constitute the best proton-electron plasma in the Universe (whence the apt name Intra Cluster Plasma, ICP), one where the thermal energy per particle overwhelms the average electron-proton Coulomb interactions by extralarge factors of order . The ICP shines in X rays by thermal bremsstrahlung radiation, with powers up to several erg s-1 equivalent to some solar luminosities.
The first observations were soon confirmed in X rays by the detection of high excitation emission lines, and in the radio band by studies of streamlined radiogalaxies moving through the ICP. Later on they were nailed down by the first measurements in microwaves of the Sunyaev-Zel’dovich effect, i.e., the inverse Compton upscattering of cold cosmic background photons at K off the hot ICP electrons at keV.
A key physical feature of the ICP is constituted by its good local thermal equilibrium, and by its overall hydrostatic condition in the DM wells, modulated by entropy. The latter is set up in the cluster center by the initial halo collapse, and is progressively added at the outgrowing cluster boundary by standing shocks in the supersonic flow of intergalactic gas into the DM potential wells. Such physical conditions are amenable to detailed modeling. We review here these entropy-based models and discuss their outcomes and predictions concerning the ICP observables in X rays and in microwaves, as well as the underlying DM parameters. These quantitative outcomes highlight the tight relationship between the detailed ICP profiles and the cosmological evolution of the containing DM potential wells. The results also provide the simplest baseline for disentangling a number of additional and intriguing physical processes superposed to the general equilibrium.
The present Report is focused on the ICP physics as specifically driven by the two-stage evolution of the containing DM halos. We extensively discuss the basic entropy pattern established by the cluster formation and development, and cover: the central entropy erosion produced by radiative cooling that competes with the intermittent energy inputs mainly due to active galactic nuclei and mergers; outer turbulent support linked with weakening shocks and decreasing inflow through the virial boundary, causing reduced entropy production during the late stage of DM halo evolution; the development from high to low entropy levels throughout a typical cluster; perturbations of the equilibrium up to outright disruption due to deep impacts of infalling galaxy groups or collisions with comparable companion clusters; relativistic energy distributions of electrons accelerated during such events, producing extended radio emission by synchrotron radiation, and contributing to non-thermal pressure support for the ICP.
We conclude with discussing selected contributions from cluster astrophysics to cosmology at large, and by addressing how the ICP features and processes will constitute enticing targets for observations with the ongoing Planck mission, for upcoming instrumentation like ALMA and other ground-based radio observatories, and for the next-generation of X-ray satellites from ASTRO-H to eROSITA.
keywords:
galaxies: clusters: general , X rays: galaxies: clusters , X rays: intracluster medium , cosmic background radiation,
1 Hot Baryons in Galaxy Clusters
F. Zwicky championed back in 1933 the notion that the high line-of-sight galaxy velocities of order km s-1 optically observed in clusters were to be interpreted not as bulk motions toward or outward of a chance ‘constellation’ of galaxies, but rather as -D random velocities with dispersions in a statistically steady ensemble confined by gravity within a few Mpcs. The virial theorem appropriate for an approximately spherical and homogeneous mass distribution reads
| (1) |
This shows such high random velocities to require for ‘rich’ clusters (as defined by Abell 1958) a then outlandish binding mass around , far larger than the sum of all galaxies in a cluster. Now we know this to constitute a major piece of evidence for non-baryonic dark matter (DM), but controversy lingered down to the early 1970’s, and was still echoed in otherwise knowledgeable textbooks of the time on basic Astronomy.
As to the baryonic content, any gas at thermal equilibrium floating in the system would feature comparably high thermal velocities, corresponding to temperatures
| (2) |
being the Boltzmann constant and the proton mass. Thus it will emit by thermal bremsstrahlung photons in a continuum out to several keVs, smack in the middle of the X-ray band. Such an emission was indeed detected in 1971 for a handful of nearby clusters standing out in the quick-look data from the first X-ray satellite Uhuru, that by the technology of the time was particularly sensitive in the keV range.
Cavaliere, Gursky & Tucker (1971) were the first to suggest these ought to be just the tips of a new class of extragalactic X-ray sources; similar conditions should prevail in all galaxy clusters and even in smaller galaxy associations like groups with appropriately cooler X-ray temperatures keV, as indeed found later on in the 1990’s in the softer bands of Einstein and ROSAT. The above authors stressed that the emission process would most likely involve an extended, thermal but not necessarily isothermal intra cluster medium rather than a multiplicity of non-thermal sources like active galactic nuclei as contended for a while.
These notions were nailed down by the detection and by size measurements of a growing number of such cluster sources from Gursky et al. (1972) to Forman et al. (1978). They squared up with the observations in the radioband of head-tail radiogalaxies streamlined by the ram pressure from their motion through the intracluster medium (see Miley et al. 1972). On the other hand, Sunyaev & Zel’dovich (1972) were prompt to point out that the hot electrons in the ICP are bound to cause inverse-Compton upscattering of cold cosmic microwave background (CMB) photons crossing the clusters, so providing an independent probe of the thermal pressure in the intracluster medium. Finally, all controversy was ended by the first detections of high excitation, coronal-like emission lines; these pinpointed conditions of thermal equilibrium from a few to several keVs (see Mitchell et al. 1976, Serlemitsos et al. 1977), and also indicated definite, subsolar metallicities .
On the other hand, the hot medium is bound to emit in X rays copious thermal, optically-thin bremsstrahlung radiation, to attain from the cluster volume bright luminosities erg s-1. These emissions enable us to probe in fine detail the surface brightness profiles and so the number densities, in some instances out to the virial radius ; these profiles turn out to peak at cm-3 in the centers, and to decline outwards by factors of order . The radial integration of the full profiles yields large amounts of baryons up to masses , implying a baryon to DM ratio close to the universal value (see White et al. 1993). It is interesting to note that shortly before 1971 false X-ray detections and upper limits had still yielded baryonic contents ranging by an order of magnitude up and down relative to the true amount (see also Sarazin 1988 for the historical context and developments).
In fact, we now know that the DM ‘halo’ accounts for some of the total masses from poor groups to rich clusters, with its collisionless constituent particles entertaining little or no interactions other than gravity. So it is the DM that sets the overall gravitational wells virialized within radii a few Mpcs, where all bodies in dynamical equilibrium from whole galaxies to single particles possess or acquire the -D velocity dispersions km s-1 entering Eq. (1).
The bulk of the baryons, to a fraction that happens to approach of their total, is found in the diffuse form of a hot intracluster medium. Given its temperature well above most ionization potentials, this is fully ionized, and is mostly comprised of protons and neutralizing electrons close to local thermal equilibrium, with proton mean free paths ranging from a few kpcs at the center to some kpc in the outskirts.
To put such numbers in a physical perspective, note that the constituent particles floating in the DM gravitational wells must have very large specific kinetic relative to the electrostatic energy at their mean separation ; in fact, the ratio implies the latter to be by far dominated by the former energy. This is an astounding ratio when compared with its counterparts: some in stellar interiors, or in the pre-recombination Universe. It applies despite gravity being so exceedingly feeble at a microscopic level as to attain a mere of the strength that marks the electromagnetic interactions. This occurs because the condition
| (3) |
is dominated by the huge number expressing in proton units the total DM mass with its overwhelming gravity. As a result, the intracluster medium by far constitutes the best proton-electron plasma in the Universe ever, and may be aptly named IntraCluster Plasma (henceforth ICP, including the intragroup plasma). Equivalently, the particle number in a Debye cube is as large as , which ensures the ICP can be very closely treated as a single fluid.
Thus the ICP constitutes a nearly perfect gas of protons and electrons with degrees of freedom and effective mass in terms of the mean molecular weight . At intermediate scales of some kpc the protons share their momentum and energy over mean free paths kpc, and the electrons follow suite over some toward local thermal equilibrium.
In simple terms, the total thermal energy in these ICP ‘clouds’ is up to ergs, comparable with the fireball from a titanic -bomb of some Megaton. Given that (differently from most laboratory plasmas) the magnetic pressure is often subdominant in the ICP, the containment of such a cloud plainly requires a monster gravitationally binding mass of some . By such simple considerations, the mere detection in 1971-72 of many clusters in X rays swept away at a single stroke any lingering doubt over the ‘stability’ of galaxy clusters and the reality of dark halos. It may be reassuring to note that these enormous super-hot hydrogen clouds cannot explode since their tenuous densities make nuclear reactions rates slow even compared to the Hubble scales, by virtue of the long mean free paths for reactions and the low deuterium cosmological abundance . We will see that such clouds actually result not from explosions but rather from prolonged gravitational implosions of intergalactic gas along with DM.
Excellent reviews have been recently devoted to broadband descriptions of the formation and evolution of galaxy clusters (Kravtsov & Borgani 2012) and of cosmology with cluster observations (Allen et al. 2011). In this Report we will focus on thermodynamic entropy as the pivotal hinge to link the ICP physics with the collapse and growth of the containing DM halos; this not only provides a handy tool for analysing the ICP observables, but also yields a coherent view of cluster evolution. In equilibrium within the gravitational potential well, the collisionless DM and the collisional ICP will be distributed in different and telling ways, worth to be measured and modeled in detail.
In the following, we will adopt the standard, flat CDM cosmology with currently accelerating expansion (cf. Hinshaw et al. 2013; Planck Collaboration 2013). In round numbers, the parameters read: matter density , baryon density , Hubble constant km s-1 Mpc, and cosmic mass variance on a scale of Mpc.
2 IntraCluster Plasma in the DM Potential Wells
The overall process of gravitational collapse that builds up the DM halos is very relevant to the physics of the ICP, and deserves some preliminary discussion.
2.1 DM gravitational wells
We recall that the formation of a DM halo starts from a small amplitude, large-scale overdensity; this initially shares the Hubble expansion until it detaches under the pull of its own gravity, turns around, collapses and eventually virializes with a density contrast over the average background (see Peebles 1993).
The updated view of the process envisages two stages, concurrently found in many state-of-the-art numerical simulations and in semianalytic studies (e.g., Zhao et al. 2003, Fakhouri et al. 2010, Wang et al. 2011, Lapi & Cavaliere 2011). The first stage is constituted by an early fast collapse at of the cluster core including many major mergers; these events reshuffle the gravitational potential, and cause the DM to undergo (incomplete) dynamical mixing and relaxation over a wide radial range . After a transition redshift , this is followed by a long stage of slow, inside-out development of the halo outskirts fed by diffuse accretion and punctuated by residual mergers; these events little affect the inner potential well, but contribute most of the overall mass.
This view of the hierarchical clustering process substantiates the schematic lore concerning the gross behavior (with implied considerable variance) of the mass-dependent epoch for halo formation ; here is the effective power spectrum index of the initial DM density perturbations, that ranges from for groups to for rich clusters (cf. Peebles 1993). Note that the two-stage picture is borne out also in the galaxy domain by the violent, dust-enshrouded star formation activity at high redshifts in the progenitors of massive ellipticals, as recently pinpointed by Lapi et al. (2011) from the Herschel satellite data.
After the turmoil of the initial collapse has subsided in the core, at a quasi-static development sets in, resulting in the growth of a roughly spherical and scale-invariant mass distribution. It is now agreed (e.g., Navarro et al. 2010, Wang et al. 2011) that the DM density profile providing the gravitational potential wells is accurately rendered in terms of a Sérsic-Einasto (see Sérsic 1963, Einasto 1965, Lapi & Cavaliere 2011) shape
| (4) |
This is written in terms of the reference radius a few kpc where the dependence locally holds, with the parameters describing the middle curvature of the profile and expressing the slope of the mild inner cusp. The above shape is now competing with the standard Navarro, Frenk & White (1997) formula, since it is concurrently indicated by high-resolution -body simulations (see Genel et al. 2010, Navarro et al. 2010, Wang et al. 2011), and by increasing observational evidences from gravitational lensing (like in Coe et al. 2012, Newman et al. 2013a and references therein). It is also substantiated by many theoretical analyses of the halo equilibrium based on the static Jeans equation (e.g., Taylor & Navarro 2001, Dehnen & McLaughlin 2005, Lapi & Cavaliere 2009a), and by semianalytic models for the underlying process of dynamical relaxation (e.g., Zukin & Bertschinger 2010, Lapi & Cavaliere 2011).
The DM radial distribution in Eq. (4) is represented in Fig. 1, together with powerlaw piecewise approximations. Note that the outer slope is steep enough to ensure a finite total mass, while the inner cusp is mild enough to ensure a vanishing central force and so a round minimum in the gravitational potential. The basin-like profile of the latter is also shown in Fig. 1 for later use, and so is the peaked profile of the velocity dispersion that is related to the ‘cold’ nature of the DM particles. Of course, on small scales the potential profiles may be indented down by local baryonic contributions from bright galaxies, while a central cusp in the total density profile may be reestablished by the central massive galaxies; at the other end, the outer shapes will be increasingly stirred by non-static conditions, as observed by Newman et al. (2013a,b).
The overall halo extent (given by the current virial defined in Eq. [1]) relative to the core (given by ) is marked by the so called ‘concentration’ parameter . In fact, during the development from to the observation redshift the concentration increases (see Zhao et al. 2003, Prada et al. 2012) approximately following , and so provides an estimate for the effective dynamical age of a cluster or a group.
We stress that the resulting DM halos are closely self-similar, i.e., halos of different masses in the range from rich clusters to small groups are close to rescaled versions of each other, with the scaling provided by the depth of the potential wells but with otherwise similar profiles. The remaining differences in shape are limited: the group halos feature slightly flatter outskirts and central cusps, but these peculiarities are easily swamped into the effects of angular momentum and of baryon contributions (cf. Lapi & Cavaliere 2011); the concentration are higher on average for the generally older groups.
Standard reference points in the DM density profile are provided by the radii wherein the average overdensity takes on a given value relative to the critical Universe; frequently used values read and . The absolute densities scale with the redshift following .
Note for future use that the cumulative mass can be derived by direct integration of Eq. (4), with explicit expressions given by Lapi & Cavaliere (2011).
2.2 Baryons in the DM wells
One may wonder whether the baryon dispositions within the DM halos also follow a self-similar pattern, as proposed by Kaiser (1986) and discussed by Rosati et al. (2002), Lapi et al. (2005) and many others. This would imply the ICP to passively follow the DM gravity pull so as to feature and with invariant profiles of and . On the other hand, signals pointing to broken similarity have been highlighted by Ponman and collaborators (see Osmond & Ponman 2004, and references therein); in fact, groups differ from clusters for emitting in X rays quite lower core luminosities than expected from extending down to their temperatures keV the self-similar cluster scaling . The latter obtains from the dependencies of the continuum emission combined with the scaling derived at from Eqs. (1) and (2), on assuming a constant baryon fraction; if anything, ought to be larger and the scaling flatter upon including the intense line emissions at group temperatures keV (see Cavaliere et al. 2005, their Fig. 1).
Such a deficit in group emissions correlates with an excess in the ICP ‘entropy’ (actually the adiabat; see Bower 1997) that is defined as
| (5) |
and is related to the standard specific entropy by . In fact, the values of computed from and observed in group cores lie considerably above the self-similar expectation for the core entropy (see Cavaliere et al. 2005, their Fig. 2).
We stress that entropy constitutes the key state variable for the ICP, since it records gains of thermal energy and radiative losses into the vast cold Universe, while being obviously insensitive to adiabatic compressions and expansions. On a heuristic approach, entropy quantifies the resistance of the ICP to compression or sinking into the DM potential wells (cf. Voit 2005). In an active view of the ICP, various processes of entropy production and radiative losses will combine and cause the ICP to react in different ways to the gravity pull. The observed levels range around keV cm2 in group and cluster cores, and increase by factors into the outskirts. Such levels correspond to specific energies of some keVs per particle at densities cm-3, which sum up to the huge overall thermal energies around ergs anticipated in § 1. In the present context, entropy excesses in the shallow group cores imply lower densities and so emission deficits as observed.
How do these simple considerations withstand the recent advances in the databases and in their physical understanding? As to the latter issue, it has been convincingly argued by Voit (2005) that simple schemes meant to tame or explain out such large numbers are doomed to fail. For example, stellar energies fall substantially short of sufficiently preheating the gas prior to its infall, on account of the limited amount of star formation and SN explosions reckoned for the intergalactic medium, or actually observed within the clusters; the latter constraint also rules out any major, indirect increase in entropy left over from condensing and burying the coldest gas into stars (see Bryan 2000, Voit & Bryan 2001). On the other hand, central Active Galactic Nuclei (AGNs) with outputs enhanced by gas accreting from their cluster/group environment can heat the ICP up to some keVs per particle; this requires a reasonable energy coupling to the ICP, but also implies a tuned balance of gas accretion vs. ejection (cf. Fabian 2012).
Concerning the first issue, as the databases widened so also did the scatter in the core values and within groups, to the point of blurring the quantitative signatures of broken similarity (see Sun 2012). In addition, all ICP observables are projected along the line of sight and relate to positions on the sky plane, whilst the scalings relate to a -D radius; so the integrated values considerably exceed their -D counterparts, while easily amplifying any intrinsic scatter, especially that arising in the hectic outskirts. Robust signals and tests of broken self-similarity require extended profiles with the leverage provided by the range, taking advantage of the resolution of current X-ray space telescopes that attain arcsecs with Chandra and XMM-Newton.
We conclude that understanding the ICP physics has to come to grips with closer modeling of the thermal state and radial dispositions, based on gravitational energy and directly keyed to an entropy spine; a relevant unifying view will only result as a last, overarching step. We shall begin with ICP in overall quasi-static thermal equilibrium within spherically symmetric DM potential wells, where the pressure obeys the equation
| (6) |
over times longer than the sound crossing Gyr. Clearly, to close this equation and solve for our primary variable a local relation between and is needed; this is provided just by the entropy .
Next we discuss how entropy is produced at the center and in the outskirts of the ICP under the gravitational energy drive during the two stages of the halo formation processes. We begin with rich clusters in the mass range around , and postpone to § 4.3 the conditions prevailing in poor clusters and groups with masses . In addition, we focus first on thermal conditions, and defer to § 5 the definition and use of entropy when non-thermal, turbulent contributions are included.
2.3 Baryons in cluster outskirts
In a cluster-sized halo formed at , the outskirts are still developing at redshifts . The development (outlined in Fig. 2) implies a continued gravitational inflow of DM across the virial boundary, settling at radii ; meanwhile, outer intergalactic gas also flows into the forming cluster. At variance with the collisionless DM, the gas inflow is mostly halted within a few proton mean-free paths kpc from the virial boundary, and is thermalized in a layer of accretion shocks hovering there (see Lapi et al. 2005). These constitute the main means for converting gravitational into thermal energy, so producing much of the ICP entropy.
At a shock the net outcome from the classic Rankine-Hugoniot jump conditions (detailed in Lapi et al. 2005, see their Appendix B) is to raise the density by modest factors from the intergalactic levels cm-3, while boosting the temperature from the ‘field’ value keV by factors that approach for (see Fig. 3), here referred to as the regime of ‘strong’ shocks. The inflow Mach number appearing here is the ratio of the gravitational inflow velocity km s-1 to that of sound km s-1 in the preshock medium.
As a result of Eq. (5), the entropy of the intergalactic gas (itself conserved during the stretches of adiabatic cosmological expansion; cf. Kolb & Turner 1990) is also boosted from levels keV cm2 to keV cm2, see Fig. 3. Past the boundary shocks, and in the absence of other energy sources, the entropy of the accreted gas shells will be conserved and stratified. In other words, the radial entropy distribution preserves the memory of the past development.
Soon after the core collapse, when the inflow is still sustained and strong shocks efficiently thermalize the infall energy, this process produces an outer entropy ramp with . In round terms, such a slope obtains mainly because the boundary temperature from gravitational heating grows under the pull of the progressively increasing cluster mass.
In closer detail, the entropy slope has been derived by Cavaliere et al. (2009) on matching the jumps at the boundary shocks and the adjoining hydrostatic equilibrium of the ICP (see Eq. [6]) to obtain
| (7) |
in terms of the ratio of the gravitational to the thermal energy at the boundary. This reads when ‘strong’ shocks with Mach numbers efficiently thermalize the infall energy to yield the ceiling temperature . 111Here we have neglected the residual kinetic energy corresponding in the shock frame to , to be taken up in § 5.1. When this is accounted for, one obtains ..
The values of (clearly smaller than ) sensitively depend on ; to see how, it is convenient to relate the inflow Mach number to the relevant potential drop (normalized with the squared circular velocity ) from the turnaround to the shock radius ; this yields depending on the outer shape of the well.
In the way of a significant example, an initial scale-invariant perturbation yields the outer potential drop , as depicted in Fig. 2; for values that describe the fast collapse of the core as a whole, values and obtain. On using the detailed shapes of the gravitational potentials associated to Eq. (4) and represented in Fig. 1, values and are found (see also Tozzi & Norman 2001, Lapi et al. 2005, Voit 2005).
However, as the cluster outskirts grow the inflows through the boundary dwindle and slow down considerably; this occurs when the accretion feeds on the tapering wings of a DM perturbation over the background, itself lowering under the accelerated cosmic expansion at low (see Fig. 2). In addition, the shocks will outgrow the virial radius and move into a region of flatter . These conditions are conducive to lower the inflow Mach numbers to values and so weaken the shock jumps. Thus the latter will produce less entropy (see Fig. 3), with boundary values lowered to levels keV cm2 and slopes flattened considerably below or even bent over (Lapi et al. 2010, Cavaliere et al. 2011a).
To make our discussion explicit, we pursue the above example based on the DM perturbation ; according to this, outskirts development corresponds to effective values of growing above , as is seen on considering the accretion rate . A shell enclosing the mass will collapse when attains the critical threshold in terms of the linear growth factor , cf. Weinberg (2008). Accordingly, the shape parameter also governs the mass buildup after ; on the other hand, the growth factor may be represented as , with ranging from for to approach as lowers to and below. So the outskirts develop from the inside-out, with accretion rates that decrease for exceeding as the accretion involves the perturbation wings, and as decreases toward at late cosmic times in the accelerating Universe. In such conditions, the effective potential drop quoted above lowers so does the infall speed proportional to , including the effects of shock outgrowth beyond by decreasing ram pressure, see Fig. 2.
Thus the outer entropy profiles will flatten out on the timescale set by the halo development, as the concentration grows to values from the initial set soon after the core collapse at ; the time involved will amount to some Gyrs for a cluster collapsed at and observed at . On the other hand, generally flatter entropy slopes apply whenever the boundary shocks are weaker due to less supersonic inflows. This condition may occur in clusters, when the infalling gas is preheated as it runs down filaments of the Large Scale Structure (e.g., Valageas & Silk 1999, Wu et al. 2000, Scannapieco & Oh 2004, McCarthy et al. 2008). It often applies to groups where lower infall is driven by a smaller mass with a generally shallower and flatter potential well relative to clusters (see Fig. 2 in Lapi & Cavaliere 2009a; also Sun 2012). Observational outcomes will be discussed in § 4.3.
2.4 Baryons in cluster cores
At the other end, the central entropy originated in the early fast collapse is set at keV cm2, not far above the intergalactic levels. This is because during the initial fast collapse the temperatures in the virialized core are raised to a few keVs weakly depending on mass, while the ICP is thickened to some cm-3, in step with the overdensities marking all virializing structures. These levels of keV cm2 are similar from clusters to groups, so emulating the outcome from a general preheating, which would require very large, diffuse energy inputs into the intergalactic gas.
But in clusters such initial entropy levels at the center may be subsequently eroded or even erased due to the cooling by the observed bremsstrahlung radiation and line emissions for keV. The cooling timescale for a single-phase ICP at keV (cf. Sarazin 1988) reads Gyr. While in the low-density outskirts radiative cooling is slow and little relevant, it is speeded up in the dense central ICP, so that in some Gyr the initial levels may be considerably lowered down to keV cm2. Whence cooling would become so fast as to match the dynamical times Gyr, to the effect of impairing the thermal pressure support; the process is even faster in multi-phase ICP with a considerable cold component as stressed by Rossetti & Molendi (2010).
This leads to ICP condensation and to cooling faster yet, so as to start an accelerated settling to the cluster center and onto the central galaxies (the classic ‘cooling catastrophe’; e.g., White & Rees 1978, Fabian et al. 1984, Blanchard et al. 1992), were it not for renewed energy injections (as widely entertained by, e.g., Binney & Tabor 1995, Cavaliere et al. 2002, Lapi et al. 2003, Voit & Donahue 2005, Tucker et al. 2007, Hudson et al. 2010). Such injections occur when the condensing ICP reaches down into the galactic nuclei and onto their central supermassive black holes, to trigger or feed a loop of intermittent starbursts and AGN activities. In the form of gentle bubbling or moderate outbursts over some Gyr, these can stabilize the time-integrated values at levels around keV cm2 (see, among others, Roychowdhury et al. 2004, Ruszkowski et al. 2004, Sijacki & Springel 2006, Ciotti & Ostriker 2007, McNamara & Nulsen 2007, Fabian 2012).
In addition, the levels of may be abruptly raised up to some keV cm2 when substantial energy injections occur into the ICP from violent outbursts of AGNs in central galaxies, and even more from deep mergers. These injections launch through the central ICP outgoing blastwaves bounded by a leading shock with Mach number given by in terms of the central ICP thermal energy erg (see Lapi et al. 2005, their Fig. 7). Strong outgoing shocks with require injections , i.e., some keV per particle. This may be the case for deep major mergers, more easily than for AGNs powered by a supermassive black hole of with just some of the discharged energy effectively coupled to the ICP, as argued by Lapi et al. (2005).
Blasts that preserve overall virial equilibrium may still leave a long-lasting imprint onto the central ICP in the form of an entropy hot spot spread out to a radius kpc, where the blast has expanded, stalled and degraded into sound waves (see McNamara & Nulsen 2007, Fabian et al. 2011; also Fusco-Femiano et al. 2009). Even stronger if rarer energy injections with will be produced when major, head-on mergers (e.g., McCarthy et al. 2007, Norman 2011) deposit at the center large energies around some keV per particle, leading to entropy levels up to keV cm2.
3 Hydrostatic Equilibria of the ICP
The above processes for entropy production and stratification combine into the basic pattern proposed by Lapi et al. (2005) and Voit (2005)
| (8) |
This rises from the central ‘floor’ keV cm2 into a ramp with slope toward the boundary value keV cm2, and is outlined in Fig. 4.
3.1 The entropy-based Supermodel
Entropy constitutes not only the thermodynamical handle to the behavior of the ICP, but also the operational key to ‘close’ Eq. (6) of hydrostatic equilibrium on expressing the density as . The resulting first-order differential equation for the primary variable is linear, and straightforwardly integrates (e.g., Dwight 1961) to yield
| (9) |
as proposed by Cavaliere et al. (2009), and used by Allison et al. (2011).
Eq. (9) has the stand of a theorem in hydrostatics (with the attendant asymptotic corollaries spelled out below), once the basic pattern of is pinpointed; as to the latter, a physical model is provided by the two-stage halo formation discussed in § 2.1, and is presented in Eq. (8). In the following, this approach is tested on observables. To begin with, the run of integrated along the l.o.s. is directly probed with the Sunyaev-Zel’dovich (1980; SZ) effect, to be discussed in § 4.5. On the other hand, from the model profiles of the density and of the temperature obtain in closed forms, linked together through the same underlying ; below these observables will be compared first with the X-ray data. Meanwhile, note that among these variables has the weakest dependence on , with implications taken up in § 4.4 and 5.
Some simple asymptotics is reported here for later use. At the cluster center, the integral term in Eq. (9) behaves like as discussed by Cavaliere et al. (2009), to imply the scaling laws , and the projected X-ray brightness . These show how for low values of keV cm2 the central temperature drops to a non-zero value before rising to a middle maximum marked by at ; meanwhile, the central emissivity peaks to a finite value due to the finite ICP pressure. Such features mark the standard, relaxed cool-core (CC) clusters as defined by Molendi & Pizzolato (2001; see also Hudson et al. 2010). On the other hand, high values of imply flat emissivity profiles together with a central temperature plateau or high rise, typical of the many unrelaxed non-cool-core (NCC) clusters. We illustrate these model morphologies in Figs. 5 and 6. We add that the central cooling time in a single-phase ICP equilibrium may be expressed in terms of the entropy level only, to read
| (10) |
this implies that high levels of keV cm2 require long timescales Gyr to be eroded.
In the outskirts, instead, Eq. (9) yields the scaling laws and ; these show that flatter entropy slopes imply steeper declines of the pressure and of the temperature.
To obtain the full profiles, one inserts the entropy pattern of Eq. (8) into Eq. (9) and the related expressions for and given above. These relations constitute what Cavaliere et al. (2009) dubbed ‘Supermodel’ (SM) in a warm mood prompted by its ability to include as particular instances several previous models, and to describe both the CC and the NCC configurations of the ICP in terms of a few physical parameters. The latter enter the basic entropy run in Eq. (8) and read: the floor in the core, and the Mach number of the boundary shocks governing the ramp after Eq. (7). They are pinned down from fitting the data that concern the X-ray brightness and temperature as discussed next, or concern directly the pressure from observations of the SZ effect discussed in § 4.5. In all such cases the boundary values and are simply related to (just proportional for ) by the classic jump conditions at the outer shocks recalled in Fig. 3 and its caption.
3.2 Relationships to simple models
The above description of the hydrostatic equilibrium after Eq. (9) may be related to standard, simpler models where the entropy is just assumed to be a functional of the density alone. Specifically, the simplest model corresponds to an isothermal equation of state , which yields in terms of the gravitational potential drop normalized to , and of the ratio between the DM and the ICP scale heights. If were constant, i.e., the DM were itself ‘isothermal’, then the simple expression would apply (Cavaliere & Fusco-Femiano 1976). Such an ‘isothermal -model’ (widely taken up since Jones & Forman 1984) works well for the central and middle regions of NCC clusters like Coma, which indeed are roughly isothermal on a scale of several kpc (e.g., Churazov et al. 2012; see also our Fig. 5).
On the other hand, one may try a standard polytropic assumption in terms of a constant macroscopic adiabatic index with the bounds corresponding to the isothermal and to the convectively mixed conditions, but with little specific physics in between. When inserted in the equilibrium this relation provides the solution , see discussion by Cavaliere & Fusco-Femiano (1978); Lea et al. (1973) and Gull & Northover (1975) had argued for the specific values and , respectively. It is now clear that the model with works reasonably in the body of massive CC, relaxed clusters; on the other hand, to represent their inner behavior values would be required since must be on its rise toward its middle maximum while is still lingering about its own central maximal value.
But then a closer description of CC clusters is provided by the ‘mirror dispersion’ approach (proposed by Cavaliere & Fusco-Femiano 1981 and tested by Hansen & Piffaretti 2007); this envisages the temperature profile to mirror the peaked behavior of the DM velocity dispersion . The net outcome is , which in a polytropic-like interpretation corresponds to in the central range. A specific instance is illustrated in the top panel of Fig. 6.
These piecewise representations are actually incorporated and unified by the SM; in fact, the latter may be represented in terms of an effective, radially varying polytropic index ranging from values at the center to into the outskirts (see Fig. 3, bottom panel, in Cavaliere et al. 2009). Thus as a fitting tool the SM performs uniformly better throughout the full range from CC to NCC clusters than any of those simpler models, yet with its fewer, intrinsic parameters and . Moreover, as the SM is based on the physical entropy pattern of Eq. (8) linked to the DM halo development (see § 3.1), the derived observables shed light on these dynamical processes relevant to the ICP thermal state, and suggest the physically based cluster classification that will be proposed in § 4.
3.3 Data fitting, and beyond
With the full SM, one uses Eq. (9) including the basic entropy pattern Eq. (8) with the two free parameters , (plus the related boundary value closely proportional to ), and derives the radial profiles of density and temperature normalized at the boundary; a very fast algorithm managing this task is available at the URL http://people.sissa.it/ lapi/Supermodel/. Thus one can perform fits to the projected, emission-weighted temperature and/or brightness data (including instrumental bandpass), test them with the use of a standard biparametric procedure for minimization (e.g., MPFIT by Markwardt 2009), and derive the bestfit values of the two basic entropy parameters with their uncertainty ranges.
Such fits can be performed over the full radial range covered by the current X-ray data. In a number of clusters observed with the low-background instrumentation of Suzaku (e.g., A1795 and A1835), the X-ray data extend toward the virial radius , though with the systematics debated by Eckert et al. (2011, 2013) and Walker et al. (2012, 2013). In other instances observed with XMM-Newton the data are limited to around . Note that the shape parameters and may be obtained from fitting either the temperature or the brightness profile, and the results turn out to be consistent within the respective uncertainties. Ordinarily the brightness data are substantially more precise, and allow a more robust reconstruction of the entropy profile.
The outer scale is usually provided by independent observations such as red-sequence termination or gravitational lensing, and so is (e.g., Medezinski et al. 2007, Broadhurst et al. 2008). On the other hand, fits to the X-ray brightness can also determine the DM concentration that enters the SM formalism through , so as to provide a handle from the ICP observables to the dynamical age and history of the host DM halos. Such determinations of are mainly based on outer brightness data (see Fig. 7), so they are independent of the inner entropy level ; they are fast yet robust. The results turn out to be consistent with direct but laborious measurements based on gravitational lensing (cf. Broadhurst et al. 2005, Lemze et al. 2009, Lapi & Cavaliere 2009b), yet are less biased than the latter by the prolateness effects discussed, e.g., by Corless et al. (2009).
Thus the basic parameters entering the entropy pattern are calibrated from fitting with the SM the projected observables (brightness and emission-weighted temperature) directly computed from -D profiles of and , with no need for delicate data deprojections (widely discussed by Kriss et al. 1983, Yoshikawa & Suto 1999, Cavaliere et al. 2005, Croston et al. 2006, Urban et al. 2011). Note that throughout most of the cluster volume these results are robust against reasonable deviations from spherical symmetry, hydrostatic equilibrium, and strictly smooth accretion. In fact, in the inner regions any geometrical asymmetries like the merger-related ones, are smoothed out on a crossing timescale, shorter than the time taken by cooling to erase entropy excesses of some keV cm2. In the middle regions, approximately spherical symmetry of the ICP is indicated by various simulations (e.g., Lau et al. 2011). In the outer regions, the accretion is often dominated by minor mergers or truly diffuse matter funneled by filaments, as shown in detail by the simulations of Wang et al. (2011, see their Fig. 7) and discussed in § 4.3.
4 Physical Outcomes from SM Analyses
We have just seen how the parameters specifying the entropy distribution can be derived from fitting the X-ray data with the SM. The results from the analysis on clusters with high-quality X-ray data (that implies ) are collected in Table 1; specific examples of the fits with the SM are illustrated in Figs. 5, 6, and 7. These clusters are apparently parted into two main blocks on the basis of their values running from a few to a few keV cm2; within each block, the members are ordered on the basis of their values. These two blocks turn out to be also parted in terms of their DM concentration . Such an ordering points toward correlations between these basic physical parameters, to be discussed next.
4.1 Correlations
In the top panel of Fig. 8 we illustrate the central levels vs. the outer slopes taken from Table 1; we find values for NCCs (red dots), and appreciably lower ones for CCs (blue dots). It is seen that correlates on average with ; statistical tests detailed in Fig. 8 and its caption show that chance occurrence of such a correlation is limited to under probability, while that of ‘outliers’ (objects with keV cm2 and ) is around on average.
In the bottom panel of Fig. 8 we illustrate the values of the outer slope vs. the concentration , as taken from Table 1. Low values of correspond to high values of , marking a long lifetime from the formation to the observation redshift , see § 2; such an anti-correlation between and turns out to be even more statistically significant.
4.2 Classes, toward a Grand Design
The above results indicate that many rich clusters like those listed in Table 1 can be parted into two main classes, defined on the basis of high entropy (HE) or low entropy (LE) prevailing both in the inner region and throughout the ICP.
LE clusters feature low entropy throughout the ICP; this includes both a low central baseline keV cm2 and a moderate outer level keV cm2, consistent with a ramp flattening toward outwards of . The outcome is a low central value of and a peak of at followed by a decline outwards, particularly effective at low (e.g., A1795). We stress that such a class definition includes not only a central CC state as in the standard designation, but also an associated low level of outer entropy production. The association: low shallow is to be traced back to a long lifetime of the containing DM halos, marked by high values of the concentrations . Such a late stage in the outskirts development is associated to dwindling inflows that produce weaker boundary shocks with and related lower entropy production, as discussed by Lapi et al. (2010).
HE clusters feature high entropy throughout the ICP; that is to say, they feature not only a high central floor keV cm2, but also an high outer level keV cm2, corresponding to a steep entropy ramp with toward the outskirts. The high values of yield a monotonic temperature profile throughout, declining from the central high rise or plateau into the outskirts, before a final drop toward the boundary. This class definition includes not only a central NCC state as in the designation introduced by Molendi & Pizzolato (2001) and pursued by Leccardi et al. (2010), but also an associated high level of outer entropy production. The association arises because the young age of the containing DM halos, marked by low values of the concentrations , implies a lifetime (cf. § 2.1) too short for the high central entropy to be erased away and for general entropy flattening to be effective in the outskirts.
The low levels proper to LEs are related to, and in fact driven by cooling timescales shorter than the halo dynamical age indicated by , see Eq. (10). In fact, the transition between LEs and HEs occurs around keV cm2 corresponding to cooling times a few Gyrs; thereafter, fast cooling leads to an accelerated progress toward levels lower yet. Eventually, the levels of are likely to be stabilized, on a time average basis, by the two additional physical processes anticipated § 2.4, i.e., intermittent AGN activity and impacts of deep major mergers. These two modes are suggested by the broad, possibly double-peaked distribution for the number of clusters with a given , as observed by Cavagnolo et al. (2009) and Pratt et al. (2010), and discussed by Cavaliere et al. (2009).
The relationship between the classes is depicted in the evolutionary chart of Fig. 9, that represents the cluster Grand Design proposed by Cavaliere et al. (2011a). This envisages clusters mainly born in an unrelaxed HE state of high entropy, dominated by the fast violent collapse of the halo bulk with related strong inflows and shocks in the infalling gas. Subsequently, on a timescale of several Gyrs they develop an outer halo while they progress toward a relaxed LE state; the central entropy is lowered by radiative cooling, while the outer entropy ramp flattens down or even bends over due to the weakened shocks and tapering entropy production. In some cases the sequence may be halted after a few Gyrs and reversed by late deep mergers which rejuvenate the central ICP into a higher entropy state; a detailed discussion is given by Fusco-Femiano et al. (2009).
4.3 Predictions
Specific predictions from our Grand Design are as follows.
HE clusters are expected to feature a still incompletely developed halo spanning only a limited radial range from the core. This implies a steep brightness profile , with a step-wise shape of the temperature profile , from high central values to a drop toward the shock layer (see Lapi et al. 2005). We expect such conditions to be particularly sharp at high .
LE clusters at low are expected to feature in their entropy profiles particularly low values of , and outer ramps flattening down or even bending over. These will produce declining profiles outward of the middle peak following as argued by Lapi et al. (2010) and supported by the Suzaku observations of A1795 (cf. bottom panel of Fig. 6); a similar case may be constituted by A2142, cf. Akamatsu et al. (2011). In such structured cases, clearly the SM requires two more parameters in the entropy profiles as proposed by Cavaliere et al. (2011a) and borne up by Walker et al. (2012), namely: the position where bending sets in, and the outer entropy slope (related to low virial value ). The outcomes are illustrated in Fig. 6, bottom panel. These expectations have been recently borne out by a detailed analysis of the outer entropy profiles in a sample of LE clusters, as illustrated in Fig. 10 (from Walker et al. 2012; see also Hoshino et al. 2010, Sato et al. 2012, Ichikawa et al. 2013).
From our Grand Desing we expect the evolution from HEs to LEs to imply a lower fraction of LEs at higher , in accord with the evidence from Santos et al. (2010) to Sayers et al. (2013). Note that high- LEs are more conspicuous in a X-ray analysis following up an SZ survey, yet their observed fraction is still modest (see Santos et al. 2012, Semler et al. 2012).
Beyond object-to-object variance, specific circumstances (limited in our Table 1 to some ) may blur the simple bimodal classification as proposed in § 4.2, and alter the straightforward evolutionary path proposed here. First, the very definition of CC clusters is recently getting articulated into strong, intermediate, and weak CCs (see Hudson et al. 2010, Sun 2012). Second, we recall from § 4.2 that HEs especially at will feature halos and ICP in brisk and often clumpy growth; cold clumps may easily pierce the virial shocks (similar events have been discussed by Dekel & Birnboim 2008 in a galactic context), and thermalize only near the center after some sloshing across (e.g., ZuHone et al. 2010), resulting in a enhanced inward increase of . Third, in clusters at low the actual accretion rates will be particularly sensitive to the richness of the cluster environment including its filamentary structures. So azimuthal sectors facing filaments may retain HE-like features; on the other hand, those facing voids develop sharper LE-like features. In particular, within the former we expect a marked entropy flattening for due to accretion drying out; meanwhile, in the latter sectors we expect the entropy to be still sustained out to the layer of strong shocks standing at the boundary. Note, in addition, that ongoing mergers easily occur in HEs, along with possible bow shock fronts. This is our reading of the complex features in the data presented by Simionescu et al. (2013) for A1656, and by Kawaharada et al. (2010) and Ichikawa et al. (2013) for several LE-like clusters.
As to groups compared with clusters, our framework leads us to envisage a structure more HE-like in the center, and more LE-like in the outskirts. This is because, as anticipated in § 2.3, less supersonic inflows are driven across the boundary by the smaller masses, and produce less entropy with flatter slopes. Meanwhile, the shallower central wells host entropy levels still close to some keV cm2 produced by the first DM infall and then increased by AGN outbursts; these levels are high enough to appreciably lower the central densities and considerably decrease the emission so preventing fast cooling. The recent data collated by Sun (2012) bear out this picture.
4.4 Checking the Grand Design on X-ray data
What is the current evidence of the evolutionary trend envisaged by our Grand Design? Toward an answer, it is useful to compare in Fig. 11 the pressure profiles derived from our SM with X-ray observations and with numerical simulations.
The yellow shaded area illustrates the region covered by the low redshift () clusters of the REXCESS X-ray sample analyzed by Arnaud et al. (2010); the dotted blue and red lines refer to the average pressure profiles for the subsamples of CC (relaxed) and NCC (typically disturbed) clusters. The cyan shaded area illustrates the region covered by hydrodynamical simulations of relaxed clusters (Borgani et al. 2004, Nagai et al. 2007, Piffaretti & Valdarnini 2008, Battaglia et al. 2011). Following the standard convention, in the plot the radial scale is normalized to , while the pressure is normalized to the value eV cm-3, in terms of the -dependence defined at the end of § 2.1 (see also Ettori et al. 2004).
The dashed line represents the so-called ‘universal’ pressure profile in terms of the variable and of the free parameters [, , , , ]. This empirical formula had been originally proposed by Nagai et al. (2007) to interpret the outcomes of hydrodynamical simulations of relaxed clusters (see also Battaglia et al. 2011); subsequently, it has been exploited by Arnaud et al. (2010) as a fitting tool to the pressure profiles from deprojected X-ray data. With the particular parameter set [8.4, 1.177, 0.3081, 1.0510, 5.4905], it has been used to render the average pressure profile from the real data within , and the simulated ones beyond that radius.
However, the wide variance in these X-ray data for shows that such an average profile yields only an incomplete description. In fact, the partial averages over the CC and NCC subsamples deviate upward and downward by amounts substantially exceeding their internal variance; thus a bimodal description constitutes both a closer and a more effective representation.
This is provided by the SM templates for the pressure profiles given by our Eq. (9) for typical HEs (entropy parameters keV cm2, keV cm2 and ) and LEs ( keV cm2, keV cm2, and ) clusters; they are illustrated with the same normalization in Fig. 11 by the red and blue solid lines. In the core these feature the NCC and CC behaviors, while for where still scarce X-ray data are available the LE template agrees well with the results from hydrosimulations of relaxed clusters. In the way of a prediction, we expect for HEs appreciably higher pressure profiles relative to LEs, from out to the still developing boundary at .
We stress that the weak dependence of on noted in § 3.1 has two sides: on the one hand, it is bound to yield the large difference in entropy levels between typical HE and LE clusters; on the other hand, it brings about a closely universal shape within each class. Additional reasons why these two classes of physical pressure profiles can attain universality are as follows. First, the SM profiles provided by Eq. (9) concern primarily and depend only on the spherically averaged entropy; as such, they meet the requirements set by Khedekar et al. (2013) for a ‘bulk profile’ filtering out possible kinds of fluctuations (cf. Zhang et al. 2009). For example, isobaric fluctuations do not affect the large-scale , and adiabatic ones do not matter in the SM. As to fluctuations in entropy, they are physically related to cold gas advected by mergers, or to ICP heated up by merger- or AGN-driven shocks; these features may be regarded as cold or hot spots, and are focused by the data of Rossetti & Molendi (2010). Second, we note that a minimal threshold for these spots to imprint the profiles is set by the uncertainties and related to the parent data fits discussed in § 3.3; these will certainly narrow down along the data progress, but currently are at levels around .
In fact, the impacts of such cold/hot spots on the spherical equilibrium can be easily assessed from the scaling laws given in § 3.1. In the central regions where applies, we expect to hold; at the other end, in the outskirts where and apply, we expect to prevail. In evaluating the net outcomes, however, it should be kept in mind that at the center the entropy levels may differ by a factor up to , a value that marks out the cool cores of LE from the hot ones of HE clusters; note in Fig. 11 that their central pressures differ in fact by a factor around . Indeed, the high pressures in the cool cores of LEs may be described in terms of a giant cold spot maintained by radiative cooling in gross balance with the energy injections from minor mergers and large AGN outbursts. At the virial boundary, on the other hand, the entropies may differ by factors around and the pressures by factors around . These values may be so used to infer the impact of the upward entropy jumps caused by weak, merger-driven shocks with Mach numbers (e.g., Korngut et al. 2011, Ade et al. 2013, Akamatsu et al. 2012), which amount to factors as seen from Fig. 3. The imprints of such limited and localized hot spots are being pursued in narrow cluster sectors analyzed at high resolutions, as discussed below.
4.5 Testing on SZ data
Another observable to directly probe pressure profiles and local enhancements is constituted by the thermal Sunyaev-Zel’dovich effect (1972, 1980; SZ). This occurs as CMB photons are inverse Compton scattered by the hot ICP electrons, and change the radiation temperature K by an amount mK; at low wave frequencies a cold shadow is cast by the hot ICP electrons onto the CMB sky. The signal is small, but intrinsically independent (differently from surface brightness), and is measured robustly with highly sensitive space instrumentation and with angular resolutions now approaching from ground radiotelescopes.
In detail, the SZ strength is given by the Comptonization parameter
| (11) |
integrated along the line-of-sight . The spectral factor approaches the value at low frequencies; its positive signature for GHz, with values still significant our to a few THz, offers a powerful cross-check on the SZ nature of the signals. The Comptonization parameter constitutes a linear, intrinsically -independent probe of the thermal electron pressure; the latter reads in terms of the ICP pressure , and takes on values with the cosmic hydrogen abundance .
The SZ observations have already probed the radial pressure profiles in nearby individual clusters, and in more distant stacked samples (South Pole Telescope [SPT] collaboration, Plagge et al. 2010; WMAP collaboration, Komatsu et al. 2011; Planck collaboration, Aghanim et al. 2011a, 2011b). They are also addressing the cluster contribution to the CMB power spectrum at multipoles (see Lueker et al. 2010, Dunkley et al. 2011, Reichardt et al. 2011).
In fact, in Fig. 11 we carry on to higher our discussion in § 4.4, on using stacked SZ observations of redshifts clusters (see Lapi et al. 2012); the pressure profiles from the SPT stacked data (cf. Plagge et al. 2010) are represented with the green squares. Although the uncertainties are still considerable in the outskirts, a departure from the empirical ‘universal’ profile stands out, and the dependent trend toward an HE-like template clearly emerges, giving support to the picture envisaged by the Grand Design. The same trend emerges from the analysis of a stacked cluster sample observed with WMAP (Komatsu et al. 2011). A similar trend is also suggested by the sample of clusters detected with the Planck satellite for redshift , and followed up in X rays with XMM-Newton (Aghanim et al. 2011b). Note that at further evidence will be difficult to obtain from X rays alone, given their bias toward the high central brightness proper to LEs.
Further developments have been recently stimulated and provided by the increasing resolutions (currently around tens of arcsecs) attained in observing the SZ effect with ground-based instrumentations such as MUSTANG (Korngut et al. 2011), SZA (Reese et al. 2012), and CARMA (Plagge et al. 2012). In the present context, we stress the relevance of the pressure profiles for CC and NCC (disturbed) clusters obtained with Bolocam by Sayers et al. (2013) that, within the data precision, are in tune with our discussion in § 4.5.
Summing up, existing observations lend support to our bimodal pressure profiles and to the basic evolutionary picture from low- LEs to high- HEs envisaged by the Grand Design. The next testing grounds will involve observing the SZ profiles from more individual clusters of the HE and LE types over an extended range of redshifts. This still constitutes a laborious or challenging proposition with the current instrumentation even at , but still coming of age with new-generation instruments such as SPT MUSTANG, ACT, CARMA, Bolocam and the upcoming ALMA (see http://www.almaobservatory.org/). Meanwhile, a baseline at very low has been just provided by the highly resolved Planck data concerning the nearby Coma cluster, discussed in § 5.2.
5 Beyond Thermal and Dynamical Equilibria
Deviations from thermal pressure support are expected both in the outskirts of LE and at the center of HE clusters. Next we discuss these issues in turn.
5.1 Turbulent support in the LE outskirts
Recall from § 2 that at the boundary of evolving LE clusters one expects weakening shocks with Mach numbers and decreasing thermalization efficiency. Correspondingly, relatively more kinetic energy seeps through as given in the shock rest frame by , ranging from for , through for , and up to for , see Cavaliere et al. (2011b) and Fig. 3. These conditions become more and more conducive to trigger turbulence in the ICP fluid.
The turbulent contribution to equilibrium is conveniently described in terms of the ratio of the turbulent to the thermal pressure. The boundary normalization is consistently set at the shock jump just by , while an inward decay is expected on the basis of standard arguments. In fact, an inward decline of on a scale Mpc is provided by the classic cascade from large ‘eddies’ driven at the macroscopic coherence length , then fragmenting down to small eddies where dissipation becomes effective (see Kolmogorov 1941, Monin & Yaglom 1965, Inogamov & Sunyaev 2003); recently, the theory has been extended to subsonic but super-Alfvenic turbulence in conditions of subdominant magnetic relative to thermal pressure (cf. Petrosian & East 2008, Brunetti & Lazarian 2011).
Pleasingly, it turns out that the total pressure can be straightforwardly included in the hydrostatic equilibrium and solved by the SM; the result reads
| (12) |
This corresponds to and replaced everywhere in Eq. (9) by and by ; correspondingly, is replaced by an effective . All that is to be expected since turbulent eddies concur with the truly microscopic thermal degrees of freedom toward dispersing and ultimately dissipating the residual kinetic energy seeped through the shock. If turbulence is stirred, the thermal pressure required for overall support of the ICP against the DM gravitational field is correspondingly decreased.
Note that the intensity parameter of the thermal SZ effect defined in Eq. (11) is then lowered relative to the strict thermal equilibrium expression Eq. (9) by the explicit factor . Thus the SZ effect can provide a direct probing of a deficit in thermal pressure, implying a considerable turbulent component in cluster outskirts for retaining equilibrium (Cavaliere et al. 2011b).
5.2 Missing SZ effect in the core of the Coma Cluster?
A case study of the conditions prevailing near the center of an HE cluster is provided by Abell 1656, the very rich and closeby Coma Cluster. The case arises when the recent high-sensitivity and high-resolution view in X rays with XMM-Newton (Churazov et al. 2012) is compared to the SZ view provided by the Planck Collaboration, with the rich data rebinned to an effective resolution (Ade et al. 2013). Fig. 12 also illustrates the profile of the SZ effect expected on using the thermal pressure profile inferred from the X-ray fits to and with the SM (see Table 1 for the values of and ; also Fusco-Femiano et al. 2011). The result is expressed in terms of the equivalent Rayleigh-Jeans decrement of the CMB temperature K, for easy comparison with the Planck measurements as presented by Ade et al. (2013, their Fig. 4).
Fig. 12 highlights a deficit in the values of as measured by Planck, relative to those expected from the X-ray observations. The discrepancy appears to be sharp at the center and well beyond the current uncertainties budget as presented by Ade et al. (2013), waiting for confirmations from the second half of Planck data. Such a SZ vs. X-ray mismatch goes also beyond the uncertainties affecting the entropy parameters obtained from our X-ray fits.
The mismatch may be marginally alleviated if one relied on the smoother, less-resolved X-ray data from ROSAT instead of XMM-Newton; the latter is particularly sensitive to clumpiness effects, so biasing high the brightness along with the apparent baryon fraction as discussed by Simionescu et al. (2011) and Churazov et al. (2012). On the other hand, a similar SZ vs. X-ray mismatch has been obtained with quite different fitting tools by Ade et al. (2013). Thus the tension appears to be model-independent, and calls for a physical explanation.
The missing SZ is hard to account for in terms of an overall shape of Coma ICP compressed along the l.o.s., given that it appears to feature, if anything, some () elongation, see De Filippis et al. (2005). On scales of kpc the presence in the ICP of substantial azimuthal substructure adding to ongoing inner shocks (e.g., Ade et al. 2013; Simionescu et al. 2013) may contribute to bias the local X-ray densities with the attendant temperatures, hence the average X-ray pressure. A similar bias might be induced on scales of some kpc by clumpiness (Simionescu et al. 2011) and fluctuations (e.g., Khedekar et al. 2013); however, given the constraints set by Churazov et al. (2012) on the density fluctuations in the central Coma, we expect such effects to be limited to some .
Thus we are led to discuss whether the mismatch may be traced back to a truly diffuse non-thermal pressure contribution from turbulence or suprathermal electrons, adding to the thermal toward overall hydrostatic equilibrium as discussed in § 5.1; then relative to the total pressure , the thermal component sampled by the SZ effect will be lower on average. Note that the condition const may be read as const implying an enhanced kinetic temperature; this leads to broadening, shifting, and enhanced excitation of X-ray spectral features, which have been proposed as marks of non-thermal conditions (see Inogamov & Sunyaev 2003, Sayers et al. 2013). In this context, the SM formalism offers the extra gear of including such an additional non-thermal component in the equilibrium condition Eq. (12) taken from Cavaliere et al. (2011a,b). For Coma a detailed shape is not required, and to a good approximation the main outcome is to recalibrate the thermal pressure to read ; resolving the tension between the SZ vs. the X-ray data requires . The outcome is illustrated in Fig. 12 by the solid line; we remark that while the SZ profile from the SM has not been derived from a formal fit, yet it turns out to represent well the Planck data over their whole radial range.
In a nutshell, the thermal electron pressure is related to the total equilibrium pressure by
| (13) |
With , this boils down to , definitely lower than the level pointed out in § 4.5. Note that sensible variations in the average ICP metallicity measured in Coma by Sato et al. (2011) would bias the electron pressure inferred from the X-ray bremsstrahlung radiation by less than a few percents, as discussed by Churazov et al. (2012). The strange case of the missing SZ effect in Coma shows that also the inner volume of HE clusters is likely to include an appreciable non-thermal component, though of a possibly different nature from the outskirts’ of LEs.
5.3 The physical nature of non-thermal pressure in inner Coma
Next we discuss the nature of such an inner non-thermal pressure contribution to the overall equilibrium.
Ongoing turbulence, originated by recent mergers that drive turbulent wakes and instabilities in the weakly magnetized ICP constitutes an attractive contributor in view of its direct link to the primary merger energetics. Such a turbulence has been widely discussed by many authors as a source of velocity and density fluctuations (e.g., Nagai et al. 2007, Vazza et al. 2010, Iapichino et al. 2011); it is widely held to accelerate with moderate efficiency supra-thermal electrons in the plasma to mildly relativistic energies giving rise to steep energy distributions as discussed by Schlickeiser et al. (1987), Sarazin & Kempner (2000), Blasi et al. (2007), and Brunetti & Lazarian (2011). However, in Coma the density fluctuations caused by ongoing subsonic turbulence have been constrained by Churazov et al. (2012, see their § 5.2 and 5.3) to be less than on scales kpc. The corresponding indirect estimates of current turbulent velocities km s-1 would fall short of providing the additional pressure required to relieve the SZ vs. X-ray tension. The actual turbulence velocities will be directly probed with the upcoming ASTRO-H mission (http://www.astro-h.isas.jaxa.jp/).
Cosmic-ray protons are attractive diffuse contributors (e.g., Pfrommer et al. 2005), since their energy is longlived and can be stored within a cluster. However, in Coma their overall energy density has been bounded to be less than a few of the thermal pressure by radio and -ray observations (cf. Ackermann et al. 2010, Bonafede et al. 2011). On the other hand, cosmic rays may still play a role as injectors of secondary electrons, to be subsequently accelerated by turbulence and shocks in the ICP (as discussed by Brunetti et al. 2012).
Thus we discuss the option offered by relativistic and trans-relativistic or suprathermal electrons. Those with Lorentz factors in the diffuse magnetic field a few G measured in Coma emit the large-scale synchrotron radiation observed at MHz in the form of the classic Coma radiohalo, see Govoni et al. (2001) and Brunetti et al. (2012). Based on the halo shape discussed in the last reference, the pressures of the magnetic field and of the energetic electrons appear to be effectively coupled to the dominant thermal population, as pointed out by Brown & Rudnick (2011) and Bonafede et al. (2011). The integrated radio power of several erg s-1 implies a relativistic energy density of order erg cm-3 (cf. Giovannini et al. 1993, with parameters updated). Although the corresponding pressure value is substantially smaller than the required several erg cm-3, relativistic electrons can point to interesting candidates provided their energy distribution extends steeply toward a lower end .
Such an extension is consistent with the radio spectrum retaining a slope or somewhat steeper, as observed down to frequencies MHz (see Henning 1989); the corresponding electron distribution is to rise toward low energies as with slope . Existing data (reported by Henning 1989) also show that at lower frequencies the radio flux in Coma is still sustained, and may even feature a steeper component, as found in other clusters (e.g., van Weeren et al. 2012); LOFAR will soon clear the issue (see http:/www.lofar.org/).
The amount of non-thermal pressure implied by the above electron population may be estimated as , and refined with the full expressions for mildly relativistic electrons given by Enßlin & Kaiser (2000, their Appendix A). Based on the value erg s-1 of the radiohalo luminosity at MHz and the profile given by Brunetti et al. (2012), a non-thermal contribution would indeed obtain if a straight electron distribution extended down to a few.
On the other hand, a slope sustained against the fast Coulomb losses (e.g., Sarazin 1999, Petrosian & East 2008) requires such electrons not to be drawn from the thermal pool, but rather to have been injected over a few yr by the action of mergers, or from AGNs (like the current sources associated with NGC 4869 and NGC 4874), or by cosmic-ray interactions as discussed by Brunetti et al. (2012). These electrons are widely held to be accelerated via turbulence and low- shocks, recently driven by mergers already on the way of dissipating, so as to meet the constraints recalled above from Churazov et al. (2012). We stress that similar merging events over timescales of Gyrs are independently required for providing the top level keV cm2 of the central entropy measured in Coma.
On the other hand, a ‘silent pool’ of cooling electrons with can be replenished and piled up since their lifetimes against Coulomb and synchrotron losses top at about Gyr (cf. Sarazin 1999). With a cumulative density cm-3 resulting from several recent mergers, these electrons can yield a non-thermal contribution . Their synchrotron and relativistic bremsstrahlung radiations would easily escape detection (Sarazin 1999, Sarazin & Kempner 2000), while their collective contribution to pressure is probed just through the thermal SZ effect. Note that sustaining such a non-thermal pool requires from mergers a considerable energy dissipation in acceleration, though far less than the thermal dissipation.
If the energy distribution extends down to a few, direct evidence of trans-relativistic electrons may be provided; in fact, their density scaling as is up to cm-3, sufficient to gauge the low- electron population via the tail of the SZ effect at very high frequencies THz, and the accompanying displacement of the thermal null at GHz (see also Rephaeli 1995). Such features in the SZ spectrum are within the reach of sensitive instrumentation like ALMA (see http://www.almaobservatory.org/).
In conclusion, the intriguing physical conditions indicated by the inner ICP in the Coma cluster apparently include both a thermal and a non-thermal component, to be probed via three observational channels across the electromagnetic spectrum: the bremsstrahlung emission in X rays, the thermal and relativistic SZ effects in microwaves, and the diffuse synchrotron radiation in the radio band.
5.4 Outer breakdown of thermal and dynamical equilibria
Adding to any non-thermal contribution to ICP macroscopic equilibrium as described above, a specific microscopic breakdown may involve the electron temperature relative to the ions’ downstream the boundary shocks. As anticipated in § 1, this occurs because the protons share their momentum and energy over a few mean free paths kpc, while the initially cold electrons follow suite to local thermal equilibrium at a common over a considerably longer scale (see the pioneering assessment by Zel’dovich & Raizer 1967, and the estimates focused to the cluster context by Wong & Sarazin 2009). Such microscopic disequilibria can also cause SZ deficits, but at a few percent levels; these are lower than the effects of non-thermal overpressures affecting the outskirts of LE clusters discussed in § 5.1, while becoming more relevant behind the strong boundary shocks that prevail in HE clusters.
On the macroscopic side of the ICP equilibrium, a strongly ellipsoidal overall geometry looked at along the minor axes tends to yield lower values of than expected from lines-of-sight extending out to the major axis length (as pointed out by Korngut et al. 2011, Reese et al. 2012). Here the linearity of SZ effect plays against, whereas the X-ray brightness is anyway dominated by the central, likely more spherical density peak. The resulting discrepancies are estimated at levels by the above authors.
While spherical hydrostatic equilibrium (possibly supplemented by non-thermal components) provides the simplest benchmark to describe average features of the ICP state, it is likely to progressively break down toward the virial radius and beyond. Over limited angular sectors, this is what we have discussed in § 4.3 (see the observations referenced therein) as to the inflows of DM and outer intergalactic gas channeled into the developing cluster along large-scale filaments. These not only break to some degree the azimuthal symmetry, but also carry down outer gas conceivably preheated by lateral compressions and external shocks, yielding at the virial boundary effective Mach numbers lower than from direct spherical infall (see Vazza et al. 2009, Kravtsov & Borgani 2012).
On a Mpc scale, extreme mergers with mass ratios close to 1:1 may trigger conditions of severe ICP disequilibrium such as observed in A754 (Macario et al. 2011) and A2146 (Russell et al. 2010), or outright disruption like in MACS J0025.4-1222 (Bradač et al. 2008) and in the prototypical 1E0657-56 (the ‘Bullet Cluster’, Clowe et al. 2006). This is the domain where high-resolution simulations of templates for individual cluster collisions are of key relevance (as discussed by Kravtsov & Borgani 2012).
6 Summary and Outlook
In the above Report our thrust has been toward providing a coherent account of the complex physics of the intracluster plasma, as it emerges when hundreds or thousands of galaxies cluster within a few Mpcs. These conditions cause the ICP to react in different ways to the DM gravity pull by means of different rates of entropy production and of radiative losses. We have been motivated by the clear signals that passive ICP self-similarity the simplest unifying scheme is broken by the observables and their profiles inside and outside ; specifically, it cannot cover the cool-core together with the non-cool-core clusters, and even less the groups together with the cluster lot. In the quest for a more specific and effective pattern, we have focused onto the conversion of gravitational into thermal energy with the associated entropy production, and have pursued the following steps. First, relate the entropy produced in the ICP to the development stages of the dark matter halos; second, discuss on worked issues the leading role that the entropy so produced plays in modeling/fitting the plasma observables; third, provide a consistent view of the long-term cluster evolution, and highlight the relationships to group conditions.
As to our first step, we have described how the basic entropy pattern arises from the two stages recently recognized in the DM halo formation process. A central floor keV cm2 is set by the early violent collapse that includes the plunging of several major mergers. This is started by an initial cosmogonic perturbation gone non-linear, and ends up with condensing intergalactic baryons to core densities cm-3 while heating them to a few keVs. The subsequent, prolonged development stage includes accelerated radiative cooling that at the centers works to erase the initial value of . But major energy injections from residual deep mergers and from violent AGN outbursts will intermittently raise it again to values around keV cm2, enough to slow down or even reset the cooling.
Meanwhile, the entropy outer ramp with slope grows from the inside-out for several crossing times Gyr, as long as cold outer gas supersonically infalls at a brisk rate into the developing halo. The baryons are strongly shocked and halted in a layer around the current virial radius, where entropy is continuously produced over several Gyrs, and stratified into the ramp extending up to the boundary value a few keV cm2. Eventually, however, the inflows dwindle away as they draw on the tapering wings of the initial perturbation over the background density provided by the accelerating universe, and/or become transonic as they are channeled down and preheated within filaments of the large-scale cosmic web. Then the virial shocks weaken and the entropy production slows down, with the outer ramp flattening out if not bending over. Thus the radial entropy distribution carries a stratified record of the second stage of the cluster formation history spanning several Gyrs.
As to our second step, the above processes set the average radial entropy run that in turn modulates the ICP profiles of density , temperature and pressure within the DM potential wells. Over much of the cluster lifetime and spatial extent, this interplay is well described by spherical hydrostatic equilibrium under thermal pressure, which constitutes the primary, robust variable in our Supermodel (SM). Pressure not only is prompt to recover in a few sound crossing times its monotonic course after the impacts of minor to intermediate mergers, but also is directly keyed to the entropy run after our SM Eq. (9). Finally, pressure is open to direct measurements via the Sunyaev-Zel’dovich effect. The SM (with its finite total mass and no central singularities in any of the ICP observables) provides a handy fitting tool for the l.o.s.-integrated, -D profiles of pressure, as well as for the associated X-ray brightness and temperature, all keyed to the same -D entropy spine. The fitting procedure involves a few non-degenerate parameters, and dispenses with delicate deprojections.
Such analyses show that many rich clusters with masses in the range can be divided into two main classes: LEs and HEs, featuring low or high entropy, respectively. This description refers to both the core levels (corresponding to cool-core and non-cool-core states) and to the boundary values . As a consequence, HEs feature flat temperature and brightness profiles at the center, but still underdeveloped outskirts especially at high , with related low halo concentrations . LEs, instead, feature a middle peak in the temperature profile, with a cooler center and an associated brightness spike; toward the outskirts their temperature decline steepens down, particularly at low . Relatedly, they also feature high concentrations , indicative of long lifetimes. In terms of the pressure profiles , we expect two basic templates applying to HEs and to LEs; while each is reasonably definite within its class, the former is centrally quite shallower as indeed has been recently observed (see discussions in § 4.4 and 4.5; also Lapi et al. 2012). The need for two templates to describe the measured pressure profiles by itself highlights that ICP self-similarity is systematically broken in the cluster body, beyond object-to-object variance. Our SM analyses in § 4.3 offer a handle to understand how the observables change at and in different azimuthal sectors. This occurs particularly in low- LE clusters where the entropy production is drying out, and correspondingly the outer entropy slope tends to vanish (cf. § 3, just after Eq. 10).
Groups with their masses fit into this framework just by way of their shallower DM potential wells. At centers the groups are sensitive to moderate energy injections with associated entropy raise produced during the first halo collapse, or contributed by AGN outbursts; in the outskirts their shallower wells draw slower infall of intergalactic matter and imply less entropy production. The resulting ICP distributions are more like HEs in the center and more like LEs in the outskirts; so groups break self-similarity twice, as it were.
As to our third step, the above pieces of evidence mainly related to low-, X-ray observables suggest the following evolutionary picture, that we dubbed cluster Grand Design. This envisages a basic course from young unrelaxed HEs to old relaxed LEs, with the latter’s entropy reduced on comparable timescales both at the center due to radiative cooling, and in the outskirts due to progressively weakening accretion shocks. Such a basic course may be halted and temporarily reversed by the impacts of large deep mergers, that can remold an LE into an HE state. These events may cause complex substructures in the ICP including internal shocks, cold fronts, central sloshing, and even outright disruptions of equilibrium (for an excellent review see Markevitch & Vikhlinin 2007).
This evolutionary picture has been tested out to higher and higher by looking first at stacked Sunyaev-Zel’dovich data of intermediate redshift clusters; these show the HE population to increasingly dominate for , as we expected. Supporting evidence is provided by the X-ray observations of Planck-discovered clusters at , which show pressure and density profiles consistent with the HE template. At higher yet, a statistical testbed for the above evolutionary picture is being provided by the power spectrum of the unresolved SZ effect integrated over redshift and over the evolving cluster mass distribution including groups (e.g., Shaw et al. 2010, Efstathiou & Migliaccio 2011). In Lapi et al. (2012) we have shown how the tight constraints at multipoles set by current observations of the integrated thermal SZ effect with the SPT (Reichardt et al. 2011) are converging to indicate at the relevant redshifts a take over of HEs with their lower central pressures. Moreover, the data body suggests a widespread presence of non-thermal contributions to the inner ICP equilibrium in these high- HEs, similarly to the conditions prevailing in the nearby Coma cluster. Additional constraints to the integrated SZ effect from clusters will require high sensitivities at resolutions , with good control of systematics. To the purpose, it is also required a precise independent determination of the normalization for the primordial cosmogonic power spectrum at cluster scales (cf. Komatsu et al. 2011, Hinshaw et al. 2013), as may be expected from the final release of the entire Planck dataset (see Planck Collaboration 2013).
Other cosmological parameters may be sensitively probed through the evolution of the cluster mass function , as pressed on particularly by Vikhlinin et al. (2006, 2009). To derive the current gravitating masses , one may take advantage once again of hydrostatic equilibrium and X-ray observables on inverting Eq. (6) to yield
| (14) |
as proposed by Fabricant & Gorenstein (1983), see also Sarazin (1988) and references therein. However, a widespread concern revolves around systematics affecting such determinations at levels exceeding . The main such systematics is constituted by non-thermal contributions to the outer ICP equilibrium, as pointed out in several recent works and in particular by Reese et al. (2012, see their Table 10). In this context, here we carry a step further our discussion of § 5.1 from recalling that non-thermal contributions are particularly relevant to the outskirts of evolved LE clusters.
To proceed, once again we take advantage of the asymptotic scaling laws for the outer pressure profile given in § 3 (see also Fig. 3). So it is seen that holds, which highlights how unphysical non-monotonicity may easily arise with flat entropy slopes . This in fact is the case with a number of clusters observed by Suzaku out to the virial radius (see Sato et al. 2012 and references therein). Our point is that in such clusters weaker boundary shocks prevail and let relatively more bulk inflow energy to seep through (as illustrated by Fig. 3), ready to drive more turbulence. In such cases Eq. (12) shows how the associated non-thermal pressure can be straightforwardly included in the SM; not only this helps to recover a realistic equilibrium with monotonically increasing total mass (and baryonic fraction at the cosmic value, see Fusco-Femiano & Lapi 2013), but also leads to gauge the bias of the mass as reconstructed from X-ray observations when the non-thermal contribution is ignored.
In such circumstances, from Fig. 13 it is seen how , in the presence of an ignored, outer non-thermal component of order will deviate downward from the true mass by comparable amounts. For turbulence decay scales , the reconstructed mass will still retain an apparent non-monotonic behavior, not unlike the results from several observations, including Kawaharada et al. (2010) in three sectors of the much studied cluster A1689 (cf. their Fig. 8). On the one hand, these studies provide useful lower bounds to the thickness of the turbulent layer. On the other hand, accounting for the turbulence bias constitutes a key point to resolve the tension between weak lensing and X-ray masses (e.g., Nagai et al. 2007, Lau et al. 2009, Meneghetti et al. 2010), and to derive precise cosmological parameters from statistics of cluster masses via the fast X-ray observations (see Vikhlinin et al. 2009).
In this context, we stress that SZ observations not only can crosscheck the bias of (as originally proposed by Cavaliere et al. 2005, Ameglio et al. 2007), but also may provide a measure thereof in terms of the X-ray vs. SZ pressure indicator , as defined by Khedekar et al. (2013). In fact, after Eq. (14) which applies with a partial non-thermal support, the mass bias simply works out to
| (15) |
which may be used to check and correct the X-ray mass estimates.
Control over such a mass bias will be mandatory to take full advantage of upcoming, large X-ray surveys like e-ROSITA (see http://www.mpe.mpg.de/ eROSITA) in measuring the parameter that modulates the dark energy equation of state, and in gauging its evolution with redshift. On a longer perspective, added value will be provided by independent measurements of weak lensing from wide-area cluster surveys as expected from the Euclid mission (see http://www.euclid-ec.org/).
As anticipated in § 2, this Report reviews a novel approach and a number of worked issues to understand why and how self-similarity or simple regularity break down in the ICP at around , differently from the DM. In closing, we raise a unifying issue: up to what point do the collisional ICP distributions in rich clusters (discussed throughout the present Report) mimic the underlying collisionless DM profiles (recalled in § 2.1)? Paradoxically, the latter most closely resemble the ICP distributions in LE clusters where collisional radiative interactions erase the core left over by the early collapse. The resemblance goes to the point that LEs are closely described in terms of a temperature profile mirroring the DM velocity dispersion as given by , see discussion in § 3.2.
This challenging situation is best phrased in terms of a similarity between the distribution of the ICP thermodynamic entropy , and the featureless DM gravitational ‘pseudo-entropy’ widely used in the relevant literature (e.g., Taylor & Navarro 2001, Faltenbacher et al. 2007, Lapi & Cavaliere 2009 and references therein). In fact, the ICP entropy run applies throughout the LE cluster bodies, and turns out to closely resemble the DM pseudo-entropy run . This holds despite being produced by short-range collisional processes that lead to heating and cooling, while originates from long-range, gravitational interactions leading to wide orbital mixing (from Lynden-Bell 1967 through Bertschinger 1985 to Lapi & Cavaliere 2011).
In point of principle, both entropies express the ‘occupation’ of the appropriate phase-spaces; in point of fact, they provide the operational link between the density and the velocity dispersions or . As shown by Cavaliere et al. (2009), the link enters in closely similar ways the respective equilibria governed by the hydrostatic equation for the ICP, and by the analogous Jeans equation for the cold DM. It will be worth considering how the picture would change in the increasingly entertained warm DM scenario.
Work supported by MIUR through the PRIN 2011/2012. We thank the anonymous referee for constructive and helpful comments. We are grateful to R. Fusco-Femiano for fruitful collaborations and stimulating discussions concerning the material of this Report. We acknowledge helpful exchanges with G. Brunetti, E. Churazov, L. Danese, G. De Zotti, M. Kawaharada, M. Massardi, P. Mazzotta, M. Migliaccio, S. Molendi, D. Nagai, P. Natoli, Y. Rephaeli, and P. Salucci. A.L. thanks SISSA for warm hospitality.
References
- [1] Abell, G.O. 1958, ApJS, 3, 211
- [2] Ade, P.A.R., Aghanim, N., Arnaud, M., et al. 2013, A&A, 554, 140
- [3] Ackermann, M., Ajello, M., Allafort, A., et al. 2010, ApJ, 717, L71
- [4] Aghanim, N., Arnaud, M., Ashdown, M., et al. 2011a, A&A, 536, A9
- [5] Aghanim, N., Arnaud, M., Ashdown, M., et al. 2011b, A&A, 536, A10
- [6] Akamatsu, H., Takizawa, M., Nakazawa, K., et al. 2012, PASJ, 64, 67
- [7] Akamatsu, H., Hoshino, A., Ishisaki, Y., et al. 2011, PASJ, 63, 1019
- [8] Allen, S.W., Evrard, A.E., and Mantz, A.B. 2011, ARA&A, 49, 409
- [9] Allison, J.R., Taylor, A.C., Jones, M.E., Rawlings, S., and Kay, S.T. 2011, MNRAS, 410, 341
- [10] Ameglio, S., Borgani, S., Pierpaoli, E., Dolag, K. 2007, MNRAS, 382, 397
- [11] Arnaud, M., Pratt, G. W., Piffaretti, R., et al. 2010, A&A, 517, 92
- [12] Battaglia, N., Bond, J.R., Pfrommer, C., and Sievers, J.L. 2011, ApJ, 758, 74
- [13] Bautz, M.W., Miller, E.D., Sanders, J.S., et al. 2009, PASJ, 61, 1117
- [14] Bertschinger, E. 1985, ApJS, 58, 39
- [15] Binney, J., and Tabor, G. 1995, MNRAS, 276, 663
- [16] Blanchard, A., Valls-Gabaud, D., and Mamon, G.A. 1992, A&A, 264, 365
- [17] Blasi P., Gabici S., and Brunetti G., 2007, Int. Journ. Modern Phys. A, 22, 681
- [18] Bonafede, A., Govoni, F., Feretti, L., Murgia, M., Giovannini, G., and Brüggen, M., 2011, A&A, 530, A24
- [19] Borgani, S., Murante, G., Springel, V., et al. 2004, MNRAS, 348, 1078
- [20] Bower, R.G. 1997, MNRAS, 288, 355
- [21] Bradač, M., Allen, S.W., Treu, T., et al. 2008, ApJ, 687, 959
- [22] Broadhurst, T., Umetsu, K., Medezinski, E., et al. 2008, ApJ, 685, L9
- [23] Broadhurst, T., Takada, M., Umetsu, K., Kong, X., Arimoto, N., Chiba, M., and Futamase, T. 2005, ApJ, 619, L143
- [24] Brown, S., and Rudnick, L. 2011, MNRAS, 412, 2
- [25] Brunetti, G., Blasi, P., Reimer, O., Rudnick, L., Bonafede, A., and Brown, S. 2012, MNRAS, 426, 956
- [26] Brunetti, G., and Lazarian, A. 2011, MNRAS, 410, 127
- [27] Bryan, G.L. 2000, ApJ, 544, L1
- [28] Cavagnolo, K., Donahue, M., Voit, G. M., et al. 2009, ApJS, 182, 12
- [29] Cavaliere, A., Lapi, A., and Fusco-Femiano, R. 2011a, ApJ, 742, 19
- [30] Cavaliere, A., Lapi, A., and Fusco-Femiano, R. 2011b, A&A, 525, A110
- [31] Cavaliere, A., Lapi, A., and Fusco-Femiano, R. 2009, ApJ, 698, 580
- [32] Cavaliere, A., Lapi, A., and Rephaeli, Y. 2005, ApJ, 634, 784
- [33] Cavaliere, A., Lapi, A., and Menci, N. 2002, ApJ, 581, L1
- [34] Cavaliere, A., and Fusco-Femiano, R. 1981, A&A, 100, 194
- [35] Cavaliere, A., and Fusco-Femiano, R. 1978, A&A, 70, 677
- [36] Cavaliere, A., and Fusco-Femiano, R. 1976, A&A, 49, 137
- [37] Cavaliere, A.G., Gursky, H., and Tucker, W.H. 1971, Nature, 231, 437
- [38] Churazov, E., Vikhlinin, A., Zhuravleva, I., et al. 2012, MNRAS, 421, 1123
- [39] Ciotti, L., and Ostriker, J.P. 2007, ApJ, 665, 1038
- [40] Clowe, D., Bradač, M., Gonzalez, A.H., et al. 2006, ApJ, 648, L109
- [41] Coe, D., Umetsu, K., Zitrin, A., et al. 2012, ApJ, 757, 22
- [42] Corless, V.L., King, L.J., and Clowe, D. 2009, MNRAS, 393, 1235
- [43] Croston, J.H., Arnaud, M., Pointecouteau, E., and Pratt, G.W. 2006, A&A, 459, 1007
- [44] De Filippis, E., Sereno, M., Bautz, M.W., and Longo, G. 2005, ApJ, 625, 108
- [45] Dehnen, W., and McLaughlin, D.E. 2005, MNRAS, 363, 1057
- [46] Dekel, A., and Birnboim, Y. 2008, MNRAS, 383, 119
- [47] Dunkley, J., Hlozek, R., Sievers, J., et al. 2011, ApJ, 739, 52
- [48] Dwight, H.B. 1961, Mathematical Tables of Elementary and Some Higher Mathematical Functions (New York: Dover)
- [49] Eckert, D., Molendi, S., Vazza, F., Ettori, S., and Paltani, S. 2013, A&A, 551, A22
- [50] Eckert, D., Molendi, S., Gastandello, F., and Rossetti, M. 2011, A&A, 529, 133
- [51] Efstathiou, G., and Migliaccio, M. 2011, MNRAS, 423, 2492
- [52] Einasto, J. 1965, Trudy Inst. Astroz. Alma-Ata, 5, 87
- [53] Enßlin, T.A., and Kaiser, C.R. 2000, A&A, 360, 417
- [54] Ettori, S., Tozzi, P., Borgani, S., and Rosati, P. 2004, A&A, 417, 13
- [55] Fabian, A.C. 2012, ARA&A, 50, 455
- [56] Fabian, A.C., et al. 2011, MNRAS, 418, 2154
- [57] Fabian, A. C., Nulsen, P. E. J., & Canizares, C. R. 1984, Nature, 310, 733
- [58] Fabricant, D., and Gorenstein, P. 1983, ApJ, 267, 535
- [59] Fakhouri, O., Ma, C.-P., and Boylan-Kolchin, M. 2010, MNRAS, 406, 2267
- [60] Faltenbacher, A., Hoffman, Y., Gottlöber, S., Yepes, G. 2007, MNRAS, 376, 1327
- [61] Forman, W., Jones, C., Murray, S., and Giacconi, R. 1978, ApJ, 225, L1
- [62] Fusco-Femiano, R., & Lapi, A., 2013 ApJ, 771, 102
- [63] Fusco-Femiano, R., Lapi, A., and Cavaliere, A. 2013, ApJ, 763, L3
- [64] Fusco-Femiano, R., Orlandini, M., Bonamente, M., and Lapi, A. 2011, ApJ, 732, 85
- [65] Fusco-Femiano, R., Cavaliere, A., and Lapi, A. 2009, ApJ, 705, 1019
- [66] Genel, S., Bouché, N., Naab, T., Sternberg, A., and Genzel, R. 2010, ApJ, 719, 229
- [67] Giovannini, G., Feretti, L., Venturi, T., Kim, K.-T., and Kronberg, P.P. 1993, ApJ, 406, 399
- [68] Govoni, F., Enßlin, T. A., Feretti, L., and Giovannini, G. 2001, A&A, 369, 441
- [69] Gull, S.F., and Northover, K.J.E. 1975, MNRAS, 173, 585
- [70] Gursky, H., Solinger, A., Kellogg, E.M., Murray, S., Tananbaum, H., Giacconi, R., and Cavaliere, A. 1972, ApJ, 173, L99
- [71] Hansen, S.H., and Piffaretti, R. 2007, A&A, 476, L37
- [72] Henning, P.A. 1989, AJ, 97, 1561
- [73] Hinshaw, G., Larson, D., Komatsu, E., et al. 2013, ApJS, in press [preprint arXiv:1212.5226]
- [74] Hoshino, A., Henry, J. P., Sato, K., et al. 2010, PASJ, 62, 371
- [75] Hudson, D.S., Mittal, R., Reiprich, T.H., et al. 2010, A&A, 513, 37
- [76] Iapichino, L., Schmidt, W., Niemeyer, J.C., and Merklein, J. 2011, MNRAS, 414, 2297
- [77] Ichikawa, K., Matsushita, K., Okabe, N., et al. 2013, ApJ, 766, 90
- [78] Inogamov, N.A., and Sunyaev, R.A. 2003, Astron. Lett., 29, 791
- [79] Kaiser, N. 1986, MNRAS, 222, 323
- [80] Kawaharada, M., Okabe, N., Umetsu, K., et al. 2010, ApJ, 714, 423
- [81] Khedekar, S., Churazov, E., Kravtsov, A., Zhuravleva, I., Lau, E. T., Nagai, D., and Sunyaev, R. 2013, MNRAS, 431, 954
- [82] Kolb, E.W., and Turner, M.S. 1990, The Early Universe (Reedwood City, CA: Addison-Wesley Publishing Company)
- [83] Kolmogorov, A. 1941, Dokl. Akad. Nauk SSSR, 30, 301
- [84] Komatsu, E., Smith, K. M., Dunkley, J., et al. 2011, ApJS, 192, 18
- [85] Korngut, P.M., Dicker, S.R., Reese, E.D., et al. 2011, ApJ, 734, 10
- [86] Kravtsov, A.V., and Borgani, S. 2012, ARA&A, 50, 353
- [87] Kriss, G.A., Cioffi, D.F., and Canizares, C.R. 1983, ApJ, 272, 439
- [88] Jones, C., and Forman, W. 1984, ApJ, 276, 38
- [89] Lapi, A., Cavaliere, A., and Fusco-Femiano, R. 2012, ApJ, 745, L15
- [90] Lapi, A., and Cavaliere, A. 2011, ApJ, 743, 127
- [91] Lapi, A., Gonzalez-Nuevo, J., Fan, L., et al. 2011, ApJ, 742, 24
- [92] Lapi, A., and Fusco-Femiano, R., Cavaliere, A. 2010, A&A, 516, 34
- [93] Lapi, A., and Cavaliere, A. 2009a, ApJ, 692, 174
- [94] Lapi, A., and Cavaliere, A. 2009b, ApJ, 695, L125
- [95] Lapi, A., Cavaliere, A., and Menci, N. 2005, ApJ, 619, 60
- [96] Lapi, A., Cavaliere, A., and De Zotti, G. 2003, ApJ, 597, L93
- [97] Lau, E.T., Nagai, D., Kravtsov, A.V., and Zentner, A.R. 2011, ApJ, 734, 93
- [98] Lau, E.T., Kravtsov, A.V., Nagai, D., et al. 2009, ApJ, 705, 1129
- [99] Lea, S.M., Silk, J., Kellogg, E., and Murray, S. 1973, ApJ, 184, L105
- [100] Leccardi, A., Rossetti, M., and Molendi, S. 2010, A&A, 510, 82
- [101] Lemze, D., Broadhurst, T., Rephaeli, Y., Barkana, R., and Umetsu, K. 2009, ApJ, 701, 1336
- [102] Lueker, M., Reichardt, C.L., Schaffer, K.K., et al. 2010, ApJ, 719, 1045
- [103] Lynden-Bell, D. 1967, MNRAS, 136, 101
- [104] Macario, G., Markevitch, M., Giacintucci, S., et al. 2011, ApJ, 728, 82
- [105] Markwardt, C.B. 2009, in ASP Conf. Ser. 411, Astronomical Data Analysis Software and Systems XVIII, ed. D. A. Bohlender, D. Durand, and P. Dowler (San Francisco: ASP), 251
- [106] Markevitch, M., and Vikhlinin, A. 2007, Phys. Rep., 443, 1
- [107] McCarthy, I.G., Babul, A., Bower, R.G., and Balogh, M.L. 2008, MNRAS, 386, 1309
- [108] McCarthy, I.G., Bower, R.G., Balogh, M.L., et al. 2007, MNRAS, 376, 497
- [109] McNamara, B.R., and Nulsen, P.E.J. 2007, ARA&A, 45, 117
- [110] Medezinski, E., Broadhurst, T., Umetsu, K., et al. 2007, ApJ, 663, 717
- [111] Meneghetti, M., Rasia, E., Merten, J., et al. 2010, A&A, 514, 93
- [112] Miley, G. K., Perola, G. C., van der Kruit, P. C., and van der Laan, H. 1972, Nature, 237, 269
- [113] Mitchell, R.J., Culhane, J.L., Davison, P.J.N., and Ives, J. C., 1976, MNRAS, 175, 29
- [114] Molendi, S., and Pizzolato, F. 2001, ApJ, 560, 194
- [115] Monin, A.S., and Yaglom, A.M. 1965, Statistical Hydromechanics (Moscow: Nauka)
- [116] Nagai, D., Kravtsov, A. V., and Vikhlinin, A. 2007, ApJ, 668, 1
- [117] Navarro, J. F., Ludlow, A., Springel, V., et al. 2010, MNRAS, 402, 21
- [118] Navarro, J. F., Frenk, C. S., & White, S. D. M. 1997, ApJ, 490, 493
- [119] Newman, A.B., Treu, T., Ellis, R.S., and Sand, D.J. 2013a, ApJ, 765, 25
- [120] Newman, A.B., Treu, T., Ellis, R.S., Sand, D.J., Nipoti, C., Richard, J., Jullo, E. 2013b, ApJ, 765, 24
- [121] Norman, M. 2011, in Astrophysics of Galaxy Clusters, Int. School of Physics Enrico Fermi, Vol. 172, ed. A. Cavaliere & Y. Rephaeli (Amsterdam: IOS & Bologna: SIF), 51
- [122] Osmond, J.P.F., & Ponman, T.J. 2004, MNRAS, 350, 1511
- [123] Peebles, P.J.E. 1993, Principles of Physical Cosmology (Princeton: Princeton Univ. Press)
- [124] Petrosian, V., and East, W.E. 2008, ApJ, 682, 175
- [125] Pfrommer, C., Enßlin, T.A., and Sarazin, C.L. 2005, A&A, 430, 799
- [126] Piffaretti, R., and Valdarnini, R. 2008, A&A, 491, 71
- [127] Plagge, T. J., Marrone, D. P., Abdulla, Z., et al. 2012, ApJ, 770, 112
- [128] Plagge, T., Benson, B. A., Ade, P. A. R., et al. 2010, ApJ, 716, 1118
- [129] Planck Collaboration 2013, A&A, submitted [preprint arXiv:1303.5076]
- [130] Prada, F., Klypin, A.A., Cuesta, A.J., Betancort-Rijo, J.E., and Primack, J. 2012, MNRAS, 423, 3018
- [131] Pratt, G. W., Arnaud, M., Piffaretti, R., et al. 2010, A&A, 511, 85
- [132] Reichardt, C.L., Shaw, L., Zahn, O., et al. 2011, ApJ, 755,70
- [133] Reiprich, T.H., Hudson, D.S., Zhang, Y.-Y., et al. 2009, A&A, 501, 899
- [134] Rephaeli, Y. 1995, ARA&A, 33, 541
- [135] Reese, E. D., Mroczkowski, T., Menanteau, F., et al. 2012, ApJ, 751, 12
- [136] Rosati, P. Borgani, S., and Norman, C. 2002, ARA&A, 40, 539
- [137] Rossetti, M., and Molendi, S. 2010, A&A, 510, 83
- [138] Roychowdhury, S., Ruszkowski, M., Nath, B.B., and Begelman, M.C. 2004, ApJ, 615, 681
- [139] Ruszkowski, M., Brüggen, M., and Begelman, M.C. 2004, ApJ, 611, 158
- [140] Russell, H.R., Sanders, J.S., Fabian, A.C., et al. 2010, MNRAS, 406, 1721
- [141] Santos, J. S., Tozzi, P., Rosati, P., Nonino, M., and Giovannini, G. 2012, A&A, 539, 105
- [142] Santos, J. S., Tozzi, P., Rosati, P., and Böhringer, H. 2010, A&A, 521, 64
- [143] Sarazin, C.G., and Kempner, J.C. 2000, ApJ, 533, 73
- [144] Sarazin, C.G. 1999, ApJ, 520, 529
- [145] Sarazin, C.L. 1988, X-ray Emission from Clusters of Galaxies (Cambridge: Cambridge Univ. Press)
- [146] Sato, T., Sasaki, T., Matsushita, K., et al. 2012, PASJ, 64, 95
- [147] Sato, T., Matsushita, K., Ota, N., Sato, K., Nakazawa, K., and Sarazin, C.L. 2011, PASJ, 63, 991
- [148] Sayers, J., Czakon, N. G., Mantz, A., et al. 2013, ApJ, 768, 177
- [149] Scannapieco, E., and Oh, S.P. 2004, ApJ, 608, 62
- [150] Schlickeiser R., Sievers A., and Thiemann H. 1987, A&A 182, 21
- [151] Semler, D.R., Šuhada, R., Aird, K.A., et al. 2012, ApJ, 761, 183
- [152] Serlemitsos, P.J., Smith, B.W., Boldt, E.A., Holt, S.S., and Swank, J.H., 1977, ApJ, 211, L63
- [153] Sérsic, J.-L. 1963, Bol. Asociacion Argentina de Astron., 6, 41
- [154] Shaw, L.D., Nagai, D., Bhattacharya, S., and Lau, E.T. 2010, ApJ, 725, 1452
- [155] Sijacki, D., and Springel, V. 2006, MNRAS, 371, 1025
- [156] Simionescu, A., Werner, N., Urban, O., et al. 2013, ApJ, submitted [preprint arXiv:1302.4140]
- [157] Simionescu, A., Allen, S.W., Mantz, A., et al. 2011, Science, 331, 1576
- [158] Snowden, S.L., Mushotzky, R.F., Kuntz, K.D., and Davis, D.S. 2008, A&A, 478, 615
- [159] Sun, M. 2012, New Journal of Physics, 14, 045004
- [160] Sunyaev, R.A., and Zel’dovich, Ya.B. 1980, ARA&A, 18, 537
- [161] Sunyaev, R.A., and Zel’dovich, Ya.B. 1972, A&A, 20, 189
- [162] Taylor, J.E., and Navarro, J.F. 2001, ApJ, 563, 483
- [163] Tozzi, P., and Norman, C. 2001, ApJ, 546, 63
- [164] Tucker, W., Tananbaum, H., and Fabian, A. 2007, Sci. Am., 296, 42
- [165] Urban, O., Werner, N., Simionescu, A., Allen, S.W., and Böhringer, H. 2011, MNRAS, 414, 2101
- [166] Valageas, P., and Silk, J. 1999, A&A, 350, 725
- [167] van Weeren, R.J., Röttgering, H.J.A., Rafferty, D.A., et al. 2012, A&A, 543, A43
- [168] Vazza, F., Brunetti, G., Gheller, C., and Brunino, R. 2010, New Astron., 15, 695
- [169] Vazza, F., Brunetti, G., and Gheller, C. 2009, MNRAS, 395, 1333
- [170] Vikhlinin, A., Kravtsov, A.V., Burenin, R.A., et al. 2009, ApJ, 692, 1060
- [171] Vikhlinin, A., Kravtsov, A., Forman, W., et al. 2006, ApJ, 640, 691
- [172] Voit, G. M. 2005, Rev. Mod. Phys., 77, 207
- [173] Voit, G.M., and Donahue, M. 2005, ApJ, 634, 955
- [174] Voit, G.M., and Bryan, G.L. 2001, Nature, 414, 425
- [175] Walker, S. A., Fabian, A. C., Sanders, J. S., Simionescu, A., and Tawara, Y. 2013, MNRAS, 432, 554
- [176] Walker, S.A., Fabian, A.C., Sanders, J.S., and George, M.R. 2012, MNRAS, 427, L45
- [177] Wang, J., Navarro, J.F., Frenk, C.S., et al. 2011, MNRAS, 413, 1373
- [178] Weinberg, S. 2008, Cosmology (Oxford: Oxford Univ. Press)
- [179] White, S.D.M., Navarro, J.F., Evrard, A.E., and Frenk, C.S. 1993, Nature, 366, 429
- [180] White, S.D.M., and Rees, M.J. 1978, MNRAS, 183, 341
- [181] Wik, D.R., Sarazin, C.L., Finoguenov, A., et al. 2009, ApJ, 696, 1700
- [182] Wong, K.-W., and Sarazin, C.L. 2009, ApJ, 707, 1141
- [183] Wu, K.K.S., Fabian, A.C., and Nulsen, P.E.J. 2000, MNRAS, 318, 889
- [184] Yoshikawa, K., and Suto, Y. 1999, ApJ, 513, 549
- [185] Zel dovich, Ya. B., and Raizer, Yu. P. 1967, Physics of Shock Waves and High-Temperature Hydrodynamic Phenomena (New York: Academic)
- [186] Zhang, Y.-Y., Reiprich, T.H., Finoguenov, A., Hudson, D.S., and Sarazin, C.L. 2009, ApJ, 699, 1178
- [187] Zhao, D.H., Mo, H.J., Jing, Y.P., and Börner, G. 2003, MNRAS, 339, 12
- [188] ZuHone, J.A., Markevitch, M., and Johnson, R.E. 2010, ApJ, 717, 908
- [189] Zukin, P., and Bertschinger, E. 2010, Phys. Rev. D, 82, 104044
- [190] Zwicky, F. 1933, Helvetica Physica Acta, 6, 110
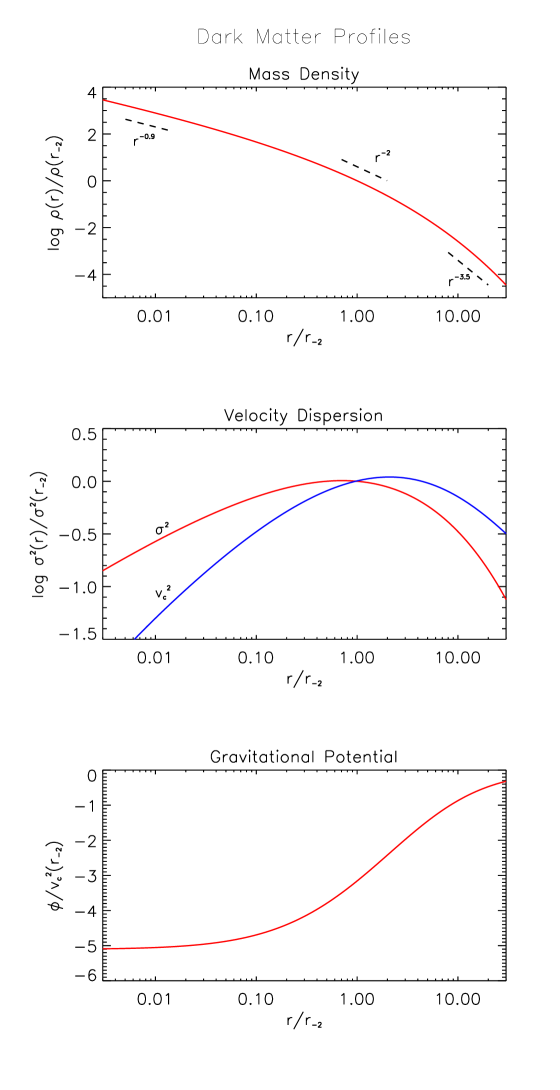
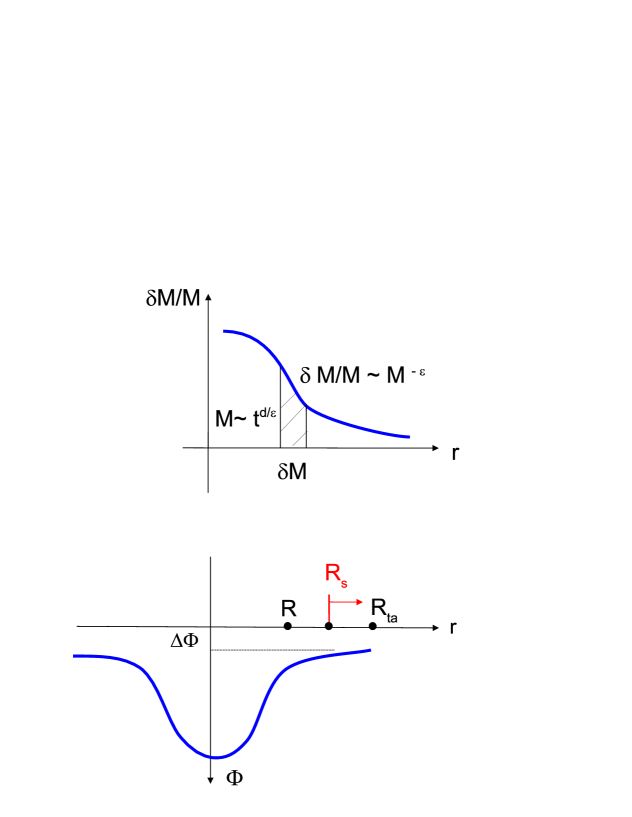
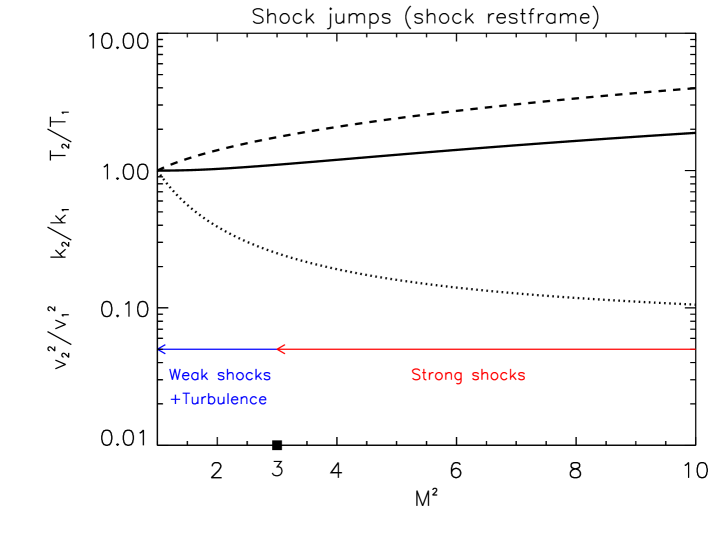
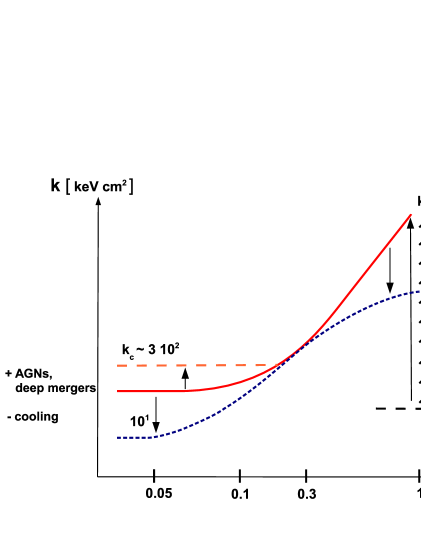
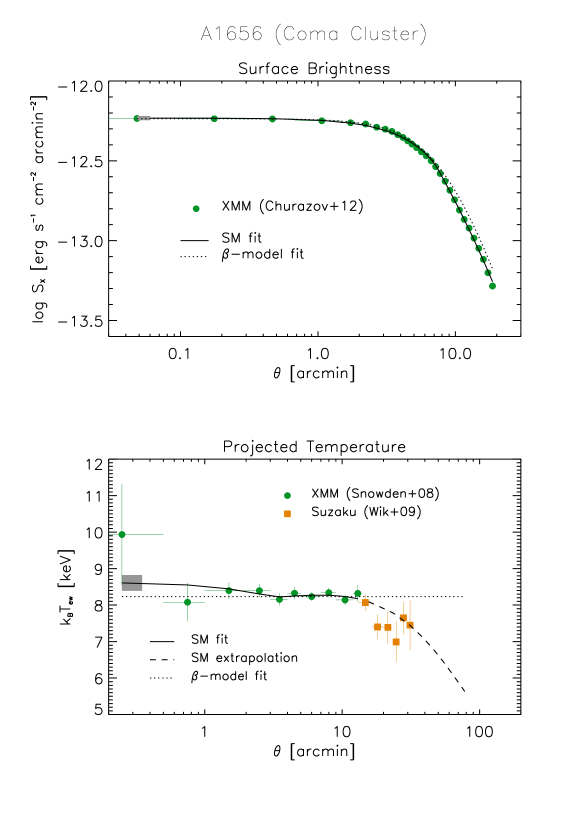
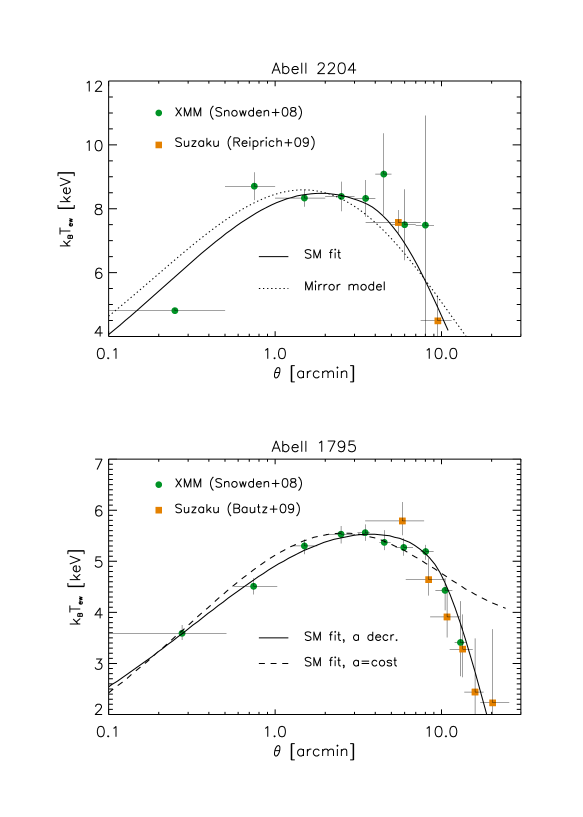
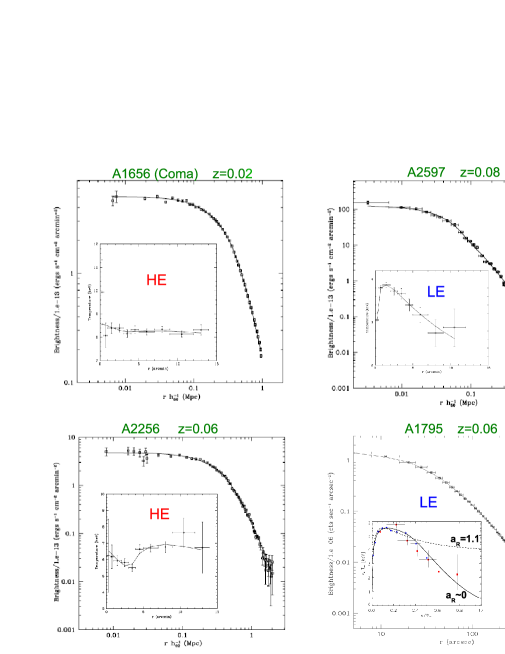
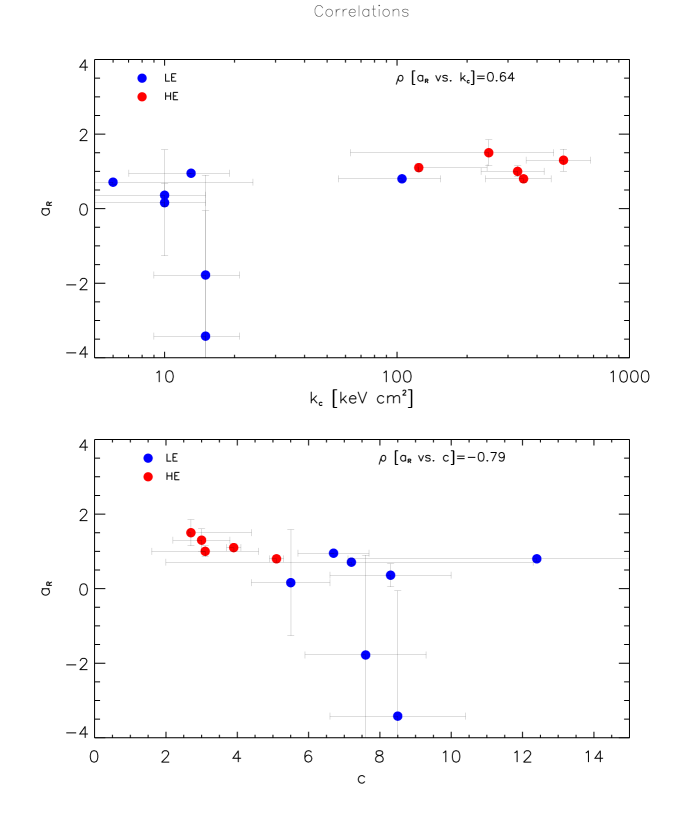
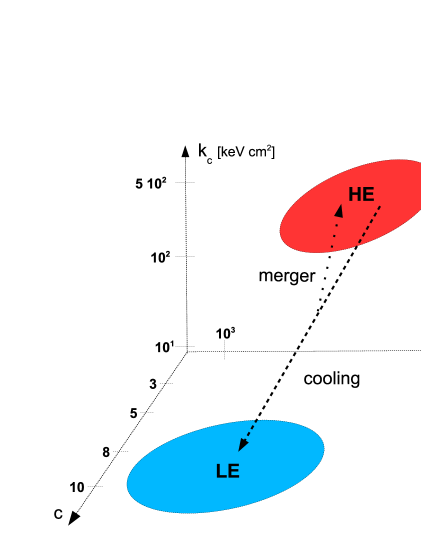
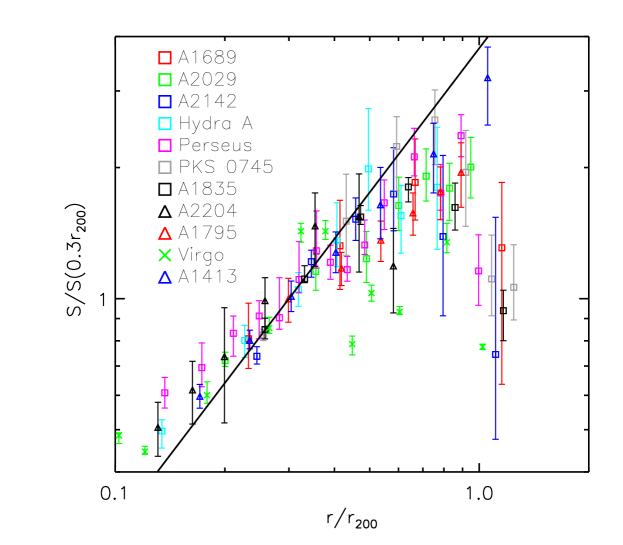
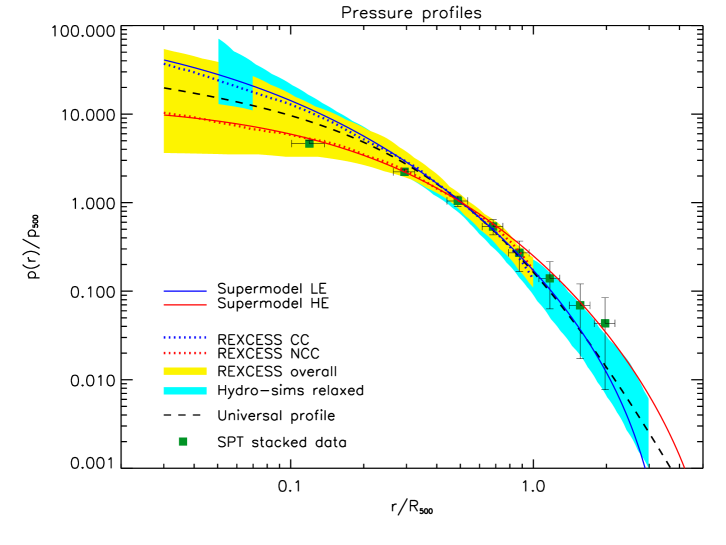
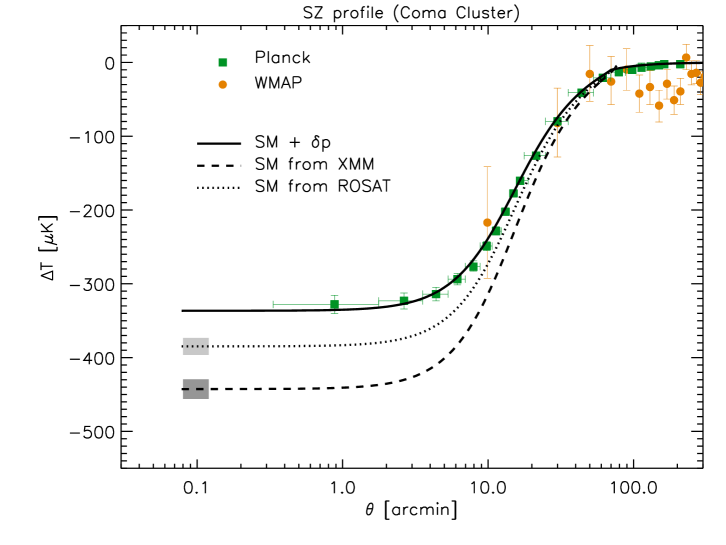
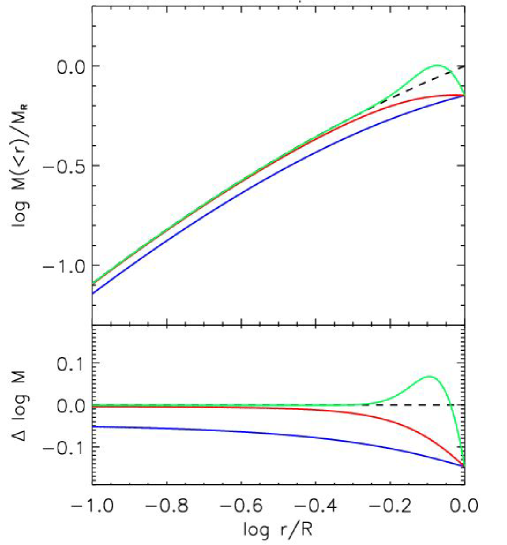
| Cluster | Class | ||||
|---|---|---|---|---|---|
| A1795 | 0.06 | LE | |||
| PKS0745 | 0.10 | LE | |||
| A2204 | 0.15 | LE | |||
| A1413 | 0.14 | LE | |||
| A2597 | 0.08 | LE | |||
| A2199 | 0.03 | LE | |||
| A1689 | 0.18 | LE | |||
| A2218 | 0.18 | HE | |||
| A399 | 0.07 | HE | |||
| A1656 | 0.02 | HE | |||
| A644 | 0.07 | HE | |||
| A2256 | 0.06 | HE |
For further details on the fits, including uncertainties of the parameter determinations and specific values (generally of order ), see the extended Table 1 in Cavaliere et al. (2011a).