Using Chip Multithreading to Speed Up
Scenario-Based
Design Space Exploration ††thanks: We would like to thank Bart Muijzer
and Ruud van der Pas from Oracle
Netherlands for their support during the usage of the SPARC T3-4.
Abstract
To cope with the complex embedded system design, early design space exploration (DSE) is used to make design decisions early in the design phase. For early DSE it is crucial that the running time of the exploration is as small as possible. In this paper, we describe both the porting of our scenario-based DSE to the SPARC T3-4 server and the analysis of its performance behavior.
- ASIC
- Application Specific Integrated Circuit
- ASIP
- Application Specific Instruction-set Processor
- CMP
- Chip Multiprocessor
- CMT
- Chip Multithreading
- DSE
- Design Space Exploration
- DMR
- Double Modular Redundancy
- FG-MT
- Fine-Grained Multithreading
- FCFS
- First-Come-First-Serve
- FIFO
- First-In-First-Out
- FIT
- Failures In Time
- FPGA
- Field Programmable Gate Array
- FS
- Feature Selection
- GA
- Genetic Algorithm
- HYB
- Hybrid Approach
- KPN
- Kahn Process Network
- MJPEG
- Motion-JPEG
- MOEA
- Multi-Objective Evolutionary Algorithm
- MOP
- Multi-Objective Optimization Problem
- MPI
- Message Passing Interface
- MPSoC
- Multi-Processor System-on-Chip
- MoC
- Model of Computation
- MTTF
- Mean Time To Failure
- NBTI
- Negative Bias Temperature Instability
- OWP
- Outside World Process
- RFCS
- Roll Forward Checkpointing Scheme
- RPC
- Remote Procedure Call
- RTL
- Register Transfer Level
- SAFE
- Sesame Automated Fault-tolerant Explorer
- SBS
- Sequential Backward Selection
- Sesame
- Simulation of Embedded Systems Architectures for Multi-level Exploration
- SFS
- Sequential Forward Selection
- SoC
- System-on-Chip
- SS
- Stable Storage
- SUE
- Single Upset Event
- SWIFI
- SoftWare Initiated Fault Injection
- TDMA
- Time Division Multiple Access
- TLB
- Translation Lookaside Buffer
- TMR
- Triple Modular Redundancy
- YML
- Y-chart Modeling Layer
- QoS
- Quality-of-Service
1 Introduction
A significant amount of research has been performed on system-level Design Space Exploration (DSE) for Multi-Processor System-on-Chipss [5, 10, 7] during the last two decades. The majority of this work is focused on the analysis of MPSoC architectures under a single, static application workload. The current trend, however, is that application workloads executing on embedded systems become more and more dynamic.
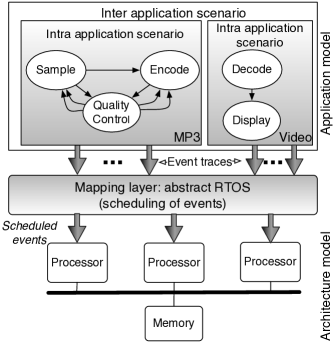
Recently, we have introduced the scenario-based DSE environment [11] that exploits workload scenarios [3] to model both the dynamism between and within the applications that are mapped onto a MPSoC. As a basis for scenario-based DSE, a scenario-aware version of our high level simulation framework Sesame [10, 12] is used. Within scenario-aware Sesame (as illustrated in Figure 1) a separation of concerns is used with separate models for the application, the architecture and the mapping. In the application model the functional behavior of the application is described using intra- and inter-application scenarios. Intra-application scenarios describe the dynamic behavior within an application, whereas the inter-application scenarios describe the dynamic behavior between multiple applications (i.e., which applications can run concurrently). The structure of the applications themselves are described using Kahn process networks [8]. Next, the architecture model describes the non-functional behavior (e.g., used power, elapsed cycles) of the MPSoC design. To connect the application model and the architecture model, the mapping layer maps both the processes and communication channels in the applications onto a component in the architecture.
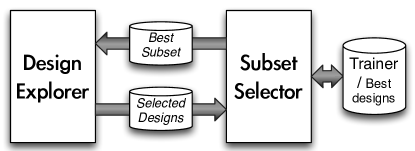
A complicating factor of embedded system design, however, is that there is an exponential number of potential mappings. That is why a search algorithm is required to efficiently explore the design space. Therefore, our scenario-based DSE framework aims at an efficient search for (sub-)optimal mappings of embedded systems with dynamic multi-application workloads. As shown in Figure 2, the framework consists of two components: the design explorer and the subset selector. In the design explorer, there is searched for the optimal MPSoC mapping. For this purpose, a genetic algorithm [9] is used that applies natural evolution on a population of mappings to identify high quality mappings. This quality is determined by simulating each of the mappings in the population. Although a Sesame simulation typically takes less than a second, there are many mappings that need to be evaluated. On top of that, each mapping needs to be evaluated for multiple application scenarios. To speed up the evaluation of a single mapping, a representative subset of application scenarios is used. This mapping is identified by the subset selector. Based on a set of training mappings (that is based on selected designs from the design explorer), the subset selector dynamically selects a representative scenario subset. Since, the representative subset of scenarios is dependent on the current designs in the design explorer, both the design explorer and the subset selector are running simultaneously.
To efficiently run the scenario-based DSE, we have ported it to the SPARC T3-4 server and studied its performance behavior. With hardware threads, the SPARC T3-4 server is perfectly suitable to be used for the embarrassingly parallel scenario-based DSE. During the search of the scenario-based DSE, a number of worker threads are used to perform Sesame simulations in parallel. Over time, each worker thread fires many processes to perform simulation jobs that can be execute on the hardware threads of the SPARC T3-4.
In the remaining sections of this paper, we start by discussing the SPARC T3-4 server in more detail. Next, Section 3 describes the unoptimized implementation of the scenario-based DSE. The following two sections (Section 4 and 5) will shows how Sesame and the scenario-based DSE are profiled to optimize the final design of the scenario-based DSE (Section 6). After that, experiments show both the performance and the bottlenecks of the scenario-based framework. Finally, a conclusion is given.
2 The SPARC T3-4
Most of the multi-core processors are implemented as a Chip Multiprocessor (CMP). On a single chip, multiple (identical) cores are placed to enable thread level parallelism. Although thread level parallelism improves the number of potential operations per second, it does not deal with the memory gap. The memory gap is the disparity between the processor speed and the memory speed and, due to this disparity, the memory latency is an important aspect of the processor performance. If the processor is not able to find alternative work while an application is blocked on a memory call, both the performance and energy consumption of a processor degrades.
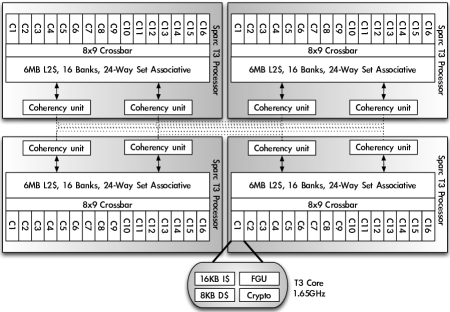
The SPARC T3 processor [1] tries to minimize the idle time of the processor by using Chip Multithreading (CMT). CMT is a combination of CMP and Fine-Grained Multithreading (FG-MT). With FG-MT, a processor core is capable of quickly switching between active threads. As a result, memory latency of a thread can be filled by executing another active thread. In this way, the processor core tries to do active work in each cycle. A SPARC T3 processor has up to sixteen cores, each supporting eight hardware threads per core. In our case, a SPARC T3-4 server is used. This server is shown schematically in Figure 3. As the name suggests, the SPARC T3-4 has four SPARC T3 processors running at 1.65GHz. This gives a total of 64 T3 cores and a total number of 512 hardware threads.
Within a T3 core there are two execution units, one per four hardware threads. Additionally, a single floating point / graphics unit (FGU) is present for all the eight hardware threads. Level 1 caches are present in each individual core. For instructions a 16KB instruction cache is available and data can be stored in a 8KB data cache. The level 2 cache are shared between all the cores on a single SPARC T3 processor using a crossbar switch. The cores in the SPARC T3 processor are kept consistent using coherency units. Finally, each T3 core has its own memory management unit for virtual memory management. For the instruction data, a instruction Translation Lookaside Buffer (TLB) of 64 entries is present and the data TLB has 128 entries.
For comparing the performance of the scenario-based DSE on the SPARC T3-4, we have also ran the original implementation of our scenario-based DSE on a Sun Fire X4440 [2] compute server with four quad-core AMD Opteron 8356 processors running at 2.3GHz. In contrast to the SPARC T3-4, this machine runs CentOS Linux.
3 Unoptimized implementation
At first, we have ported the scenario-based DSE to the SPARC T3-4 without any optimization. As the SPARC T3 processor supports 64 bits, we had the possibility to compile for both and bits. In order to see which option was best, we compared the performance scaling of both options.
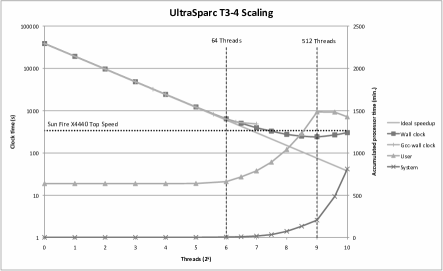
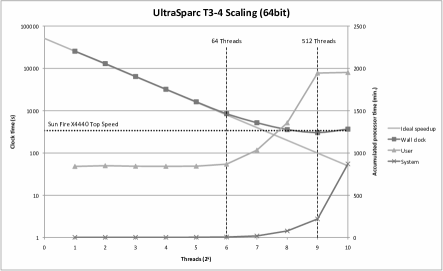
In Figure 4(a), the performance scaling is shown with the unmodified scenario-based DSE and default compilation flags111Optimization -O3 for gcc and -xO5 for the Sun cc compiler. Other flags are tried, but do not have any significant effect. During this experiment, the size of the workload remains fixed and the number of worker threads is varied. At first, we investigated the total wall clock time of the application. The logarithmic horizontal axis shows the number of threads that are used to simultaneously process the simulations, whereas the left vertical axis shows the wall clock time, also using a logarithmic scale. As a consequence, the ideal speedup manifests itself with a straight line.
With the 32 bit compilation, a comparison is made between the compiled code of gcc and compiled code of the Sun cc compiler. Up to 128 threads, the performance of the Sun cc compiler and the gcc compiler is similar and, therefore, we have decided to use the Sun cc compiler for all the experiments. For this compiler, the speedup of the code is completely linear until 64 threads. With more than 64 threads the speedup quickly decreases. At the optimal point of 512 threads, the Oracle SPARC T3-4 is 29 percent fast than our Sun Fire X4440 server.
In order to identify the cause of the decrease in speedup, the user and system time is also plotted in Figure 4. For this graph, the right vertical axis shows the accumulated processor time in minutes. Since the amount of work is constant, the expected behavior is that the accumulated user time remains the same. This is indeed the case when the number of threads is between and . After this point, however, the user time starts to increase. The same is true for the system time: due to the increased number of threads, the complexity of the coordinating tasks of the operating system starts to increase. This can be clearly seen when the system is overloaded with more than 512 threads.
For the user time, however, the increase is not as you would expect. The most plausible explanation is the increase is related to the number of physical cores. There are 64 physical cores on the Oracle SPARC T3-4. When the number of threads is lower or equal than the number of physical cores, the speedup is linear. With more than 64 threads the hardware threads should lead to a further improvement of the performance. Still, this improvement is not linear anymore. Although hardware threads have their own execution units, a small part of the functionality is shared with the other hardware threads on the physical core. In order to identify this shared functionality in our program and to minimize these dependencies between the tasks, we have applied profiling. This will be described in the following two sections.
Finally, the comparison between the 32 bits (Figure 4(a)) and the 64 bit implementation (Figure 4(b)) shows that the 32 bit option on the SPARC is superior to the 64 bit option. In our reference system, the x86 based Sun Fire X4440, 64 bits compilation is done, which is clearly faster than when 32 bit compilation is used. In the SPARC T3-4, however, 32 bit compilation is better. In Figure 4(b) the performance scaling of the 64 bit version of our application can be seen for the Oracle SPARC T3-4. The graph shows exactly the same trend as the 32 bit compilation (Figure 4(a)). However, the absolute performance is worse than the 32 bit compilation. The difference between our x86 based reference system and the SPARC T3-4 is that in the x64 architecture 64 bit compilation enables some additional architectural features. For the SPARCV9 architecture, however, these optimizations are already available in the 32 bit compilation. As a result, on the Oracle SPARC T3-4 scenario-based DSE only suffers from the increased memory footprint and does not benefit from additional architectural features.
4 Profiling of a Single Sesame Call
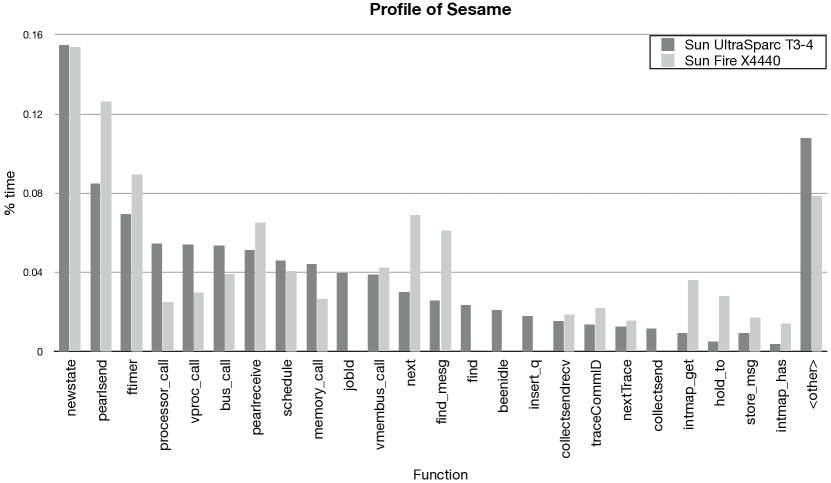
We start by profiling an individual Sesame simulation on the Oracle SPARC T3-4 and the Sun Fire X4440. As the Sun Fire X4440 is running CentOS linux, we use gprof [4] to obtain the profile. In Figure 5 the profile with the functions that use the largest amount of exclusive user time is shown. For the performance of a single Sesame call, there is a large difference between the Sun Fire X4400 and the Oracle SPARC T3-4. The single thread performance is approximately 7 times slower than the Sun Fire X4440. It is to be expected that the single thread performance is worse on the Oracle SPARC T3-4, than it is on the Sun Fire X4440. The individual core of the SPARC T3-4 is not only simpler, but the clock frequency is also lower. This difference does not seems to be related to differences in the function profile. As there are no significant differences in the function profile, the porting of the scenario-based DSE to the SPARC T3-4 does not introduce new bottlenecks in a single Sesame simulation. Therefore, we decided that there is no need to invest time in the optimization of a single simulation. Rather, there is focused on optimizing the scenario-based DSE that executes multiple simulations simultaneously.
5 Profiling of the Scenario-based DSE
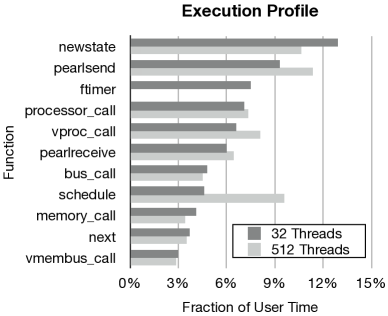
Next, the complete scenario-based DSE framework is profiled. For
this purpose, the Oracle Solaris Studio Performance Analyzer [6] is used. Figure
6(a) shows the function profile of a scenario-based DSE
where worker threads are running simultaneously. The profile shows the
same behavior as the profile of a single Sesame simulation.
However, during the Sesame simulation there are some clear hot spots. One of
these hot spots is ftimer. This function only returns (after a
short calculation) the current simulation time. To improve the
performance, we have enabled function inlining in the Sun cc compiler for functions
from external libraries (ftimer is a function in a dynamic
shared library that is normally imported at runtime). The
effect of inlining is clearly visible in the profile of Figure
6(a), where the ftimer function is inlined with
the thread experiment. As the function ftimer is not present
any more, its user time drops to zero. For some functions (e.g., pearlsend and schedule), however,
the relative user time increases significantly.
Due to the heavy use of inlined
functions, the relative amount of computation time increases and, as a
result, the fraction of the total exclusive user time that is spent in
these functions.
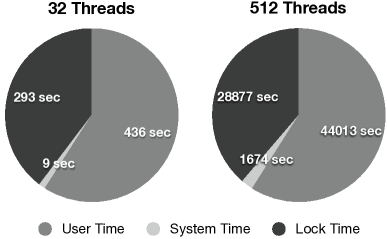
In Figure 4 we noticed that there was an increase in user and system time for situations where the number of threads was larger than . To analyze this growth, the breakdown of the total processing time accumulated over all threads is shown in Figure 6(b). Apart from the absolute values, the fractions of user, user lock and system time are more or less equal. Still, the overhead of the scenario-based DSE seems to be unreasonably large. Although none of the scenario-based DSE framework function show up in the profile (Figure 6(a)), the amount of user lock time is significant. Most likely, part of this lock time is due to the lock-based job queue of the scenario-based DSE. To resolve this issue, we have redesigned our scenario-based DSE to use a lockless job queue. This design will be described in the next section.
6 Final design
The original design of the workpool of the scenario-based DSE used a queue based on mutexes and condition variables to enforce that only one thread at the time retrieves a job from the job queue. Such a lock-based design works satisfactory if the number of worker threads are low. However, when there is scaled up to 512 threads the contention becomes relatively large. This is substantiated by the amount of lock time in the time breakdown in Figure 6(b).
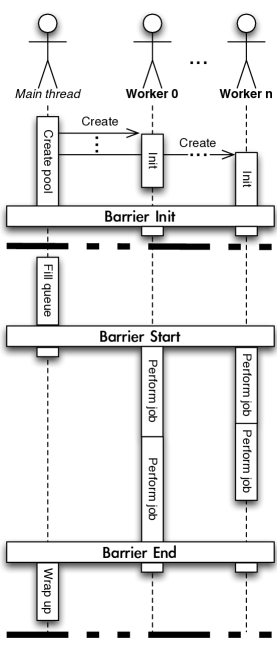
Figure 7 shows the lockless design of the workpool. The lockless implementation is largely based on volatile variables and atomic operations. Additionally, synchronization is achieved using a barrier. During execution, two stages can be distinguished: initialization and the main execution. Initialization is triggered by the main thread. The main thread will create all the worker threads one by one and wait until the worker threads are initialized. Next, the worker threads will initialize their data structure. After the worker threads are all ready for execution, the threads are synchronized using a barrier (Barrier Init).
Within the main execution, the job queue is filled and processed by
the worker threads. During the filling of the queue, all the worker
threads are blocked on a barrier (Barrier Start). The filling
of the queue is done by the main thread. This involves the allocation
of a vector with job descriptions and, next to this, the atomic variables
are initialized. There are two atomic variables: 1) the cur pointer that
refers to the first unprocessed job and 2) the end pointer that
refers to the last job. After initializing the queue, the main thread will also
synchronize on the start barrier.
When all threads are started the jobs will be processed. Each of the
jobs will be handled by a single worker threads that will start a
Sesame simulation in an external process using the
system() command222Unfortunately, it is not possible to
easily integrate Sesame in the evaluator due to the large number of global
variables in the program. In the meanwhile, the main thread is
blocked on the final barrier (Barrier End) until the complete
job queue is handled. To fetch a job, a worker thread atomically
increments the cur pointer and obtains the current value. In
case the value is smaller or equal to the end pointer, the
specific job will be fetched from the queue. Otherwise, the worker
thread will also synchronize on the final barrier.
Once all the threads have reached the end barrier the main thread will wrap up. This involves the destruction of the queue and make it ready for the next batch of evaluations. In the meanwhile, the worker threads are already waiting on the start barrier. This design allows us to process multiple batches without recreating the workpool for each generation in the scenario-based DSE.
7 Experiments
Until now, we have described the port of the scenario-based DSE to the SPARC T3-4. The focus of this porting procedure was to run the evaluation of a batch of simulations as fast as possible. In this section we will present the final results using three types of experiments. During the experiments, the final design of the scenario-based DSE is used with a fixed workload that consists of individual simulation jobs. The first two experiments will analyze the influence of the type of heap allocation and the type of scheduling. Next, we will give a short remark on the wall clock time accuracy of the Oracle Solaris Studio Performance Analyzer. This is followed by an experiment that explains the increase of user time with an increasing number of worker threads. Finally, we can show with a final experiment the scalability of the scenario-based DSE.
7.1 Heap Allocation
During the profiling with the Oracle Solaris Studio Performance
Analyzer, one hot spot with respect to system time was the function
take_deferred_signal(). When digging deeper in the function
stack, we found out that this function becomes hot due to mutex locks
in malloc and free. The default malloc library on Oracle
Solaris uses a single heap for all the different threads.
During system calls like malloc and free, the access to
the shared heap is guarded by mutex locks. In a system where there are many hardware threads,
such as the SPARC T3-4, this quickly can become a bottleneck of an application.
Fortunately, Oracle Solaris provides more heap allocation strategies. Next
to the default strategy, a multithreaded malloc (libmtmalloc)
and a type of slab allocator (libumem). We compared the
performance of our scenario-based DSE framework on these three types of heap
allocation. The experiment is performed for a variable number of
worker threads, where each experiment is repeated six times.
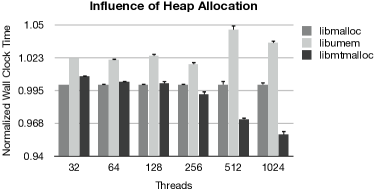
The result of the experiment is shown in Figure 8.
In the results the wall clock time of every experiment is normalized to the
average wall clock time of the default heap allocation scheme and the
error bars show the standard error of the mean. At first, it is clear
that our application is not suited for slab allocation. In the case
of slab allocation, the heap allocator tries to reduce the memory
fragmentation by preallocating memory slots of a certain type. When
these types are allocated frequently, this quickly provides allocated
memory with hardly any fragmentation. This approach may be well suited
to kernel objects (In fact, libumem is a user space
implementation of the original slab allocator inside the kernel), but
in our scenario-based DSE framework libumem is significantly slower for all
cases. It also does not solve our bottleneck problem as it has the
same mutex locks as the default heap allocator.
The multithreaded heap allocator libmtmalloc, however, has
split the heap into individual segments for each separate thread.
This requires more heap space, but locally the dynamically allocated data
can be created concurrently for each of the different threads without
using locks. Our
results show that for situations where a relative modest number of
threads are used, libmtmalloc is slower. In this case we only
suffer from a larger heap space. Increasing the number of workers,
libmtmalloc is becoming faster than the default heap allocator.
The more worker threads there are, the more lock contention is present
in the default heap allocator. This lock contention is not present in
the multithreaded heap allocator, what is especially visible when we
overload the system with worker threads.
7.2 Scheduling
Another aspect that can influence the performance is the scheduling policy of
the process. Solaris 10 allows us to set the scheduling class of a
process with the command priocntl. For a normal user, there are
two possible classes: 1) time sharing and 2) fixed priority. Time sharing
periodically recalculates the priority of a process to give each
process an equal part of the processing time, whereas in the case of
the fixed priority it remains equal for the total lifetime of the
process.
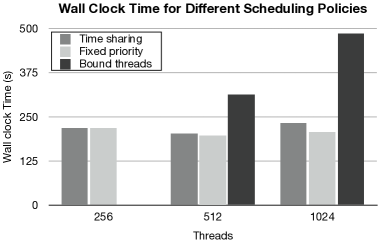
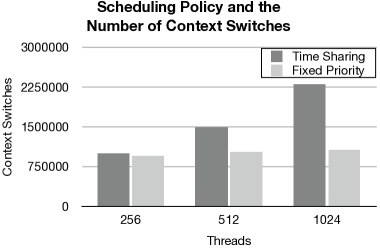
As in our scenario-based DSE framework separate processes are used for each individual simulation, the scheduling can affect the performance. As shown in Figure 9(a), the desired behavior of the performance is that it improves until all the 512 hardware threads of the SPARC T3-4 are utilized. After this point, the performance should degrade very slowly. This is the case with the fixed priority policy. For time sharing, however, the performance of the scenario based DSE framework degrades faster and using 1024 threads it is even slower than using 256 worker threads.
Most likely, the reason for the degraded performance of the time
sharing policy is the number of context switches. In order to quantify
the influence of context switches, we have used the standard C library
function getrusage. The results in Figure
9(b), show indeed a correlation between the
number of context switches and the degraded performance. For the fixed
priority policy the number of context switches remains constant with
an increased number of worker threads. The number of context switches
for the time sharing policy, on the other hand, increase
simultaneously with the number of worker threads.
We realized that it should be beneficial that each worker process
keeps the affinity with the T3 core where it is running. In this way,
a more efficient cache usage can be achieved. To achieve the (virtual)
processor affinity, all the worker threads are bind to one of the
hardware threads with the system call processor_bind. Since the
manual did not provide us with a clear mapping of the processor
identifier and the hardware thread, we only performed this experiment
for 512 and 1024 worker threads. In this case, it is relatively easy to spread to
workers over the architecture. Looking to the performance in Figure
9(a), our simple worker mapping scheme does not give
satisfactory results. Undoubtedly, better worker mapping schemes can
be identified, but we do not expect to obtain significant improvements.
7.3 User Time Scaling
A much larger potential improvement can be gained if we resolve the increase in user time. Going back to the scalability graph in Figure 4, we identified that once the number of worker threads is larger than 64, the total user time of the application starts to increase. However, as the workload remains constant, the user time should remain constant irrespective of the number of worker threads. If we can reduce the increase in user time, the total speedup of the application (compared to sequential execution) can be improved significantly.
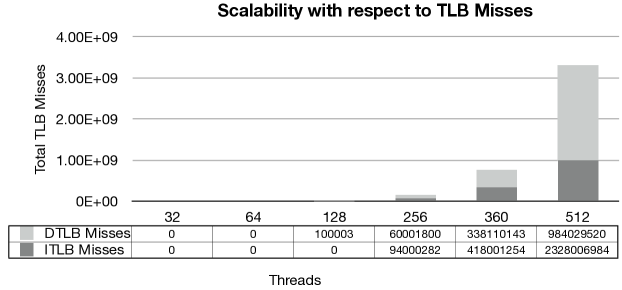
In order to identify the cause of the increase, a significant amount of research with the Oracle Solaris Studio Performance Analyzer was required. The hardware counters finally gave us the solution. In Figure 10, the number of TLB misses can be seen for the instruction memory and the data memory. Obviously, the number of TLB misses show a high correlation between the increase in user time. Until 64 worker threads, the user time was constant: the TLB experiment shows us that in this case there are no TLB misses. After this point, the user time is increasing and this is reflected by a skyrocketing number of TLB misses. When a TLB miss occurs in user mode, it is also resolved in user mode. So, the time to resolve the TLB misses is also added to the user time. With more than 3.3 billion TLB misses, it is to be expected that a large increase in user time is observed.
The architecture of the SPARC T3-4 also explains why the threshold is at 64 worker threads. Each worker thread uses separate processes to perform the simulations. As a result, each worker thread needs his own private entries in the instruction and data TLB. Until 64 worker threads, each worker thread can run at a separate T3 core and have his own TLB. However, when the number of worker threads is larger than the number of T3 cores, the TLBs are shared. In the case that all 512 hardware threads are utilized, each hardware thread can have only 8 entries in the instruction TLB and 16 entries in the data TLB ( of the entries in the shared TLB of the T3 core).
It is hard to resolve the TLB misses. At first, Sesame includes a large number of shared libraries. Secondly, a large amount of data is used during the simulation. This involves input data like the workload of the embedded system, the description of the application and the architecture of the embedded system. Additionally, a large amount of output data is produced that is temporarily stored in memory.
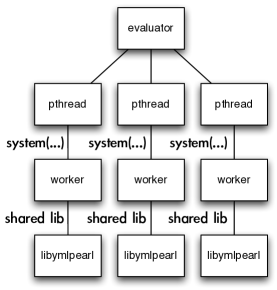
The relation between threads and processes, as depicted in Figure
11, explains the TLB problem. For the scenario-based DSE the first two levels of the
tree are running in a single process (the evaluator and worker threads).
Sesame workers, however, are separate processes. The Oracle Solaris Studio
Performance Analyzer learns us that all the TLB misses occur in a
large shared library named libymlpearl.
A potential improvement is to incorporate Sesame in the evaluator as a
shared library. In this way the simulation is a function call instead
of an externally running process. The big advantage in this case is
that libymlpearl only needs to be loaded once. Shared data
between the simulation is in this situation shared between all the
workers. However, from origin Sesame uses many global variables.
Thus, it would require a large (but absolutely not impossible)
implementation effort to turn Sesame into a loadable dynamic library.
At the moment, the only possible improvement is to increase the page size of the heap to 4MB instead of the default 8KB. This gives already a performance improvement of more than four percent with respect to the execution time with the 8KB page.
7.4 Scalability
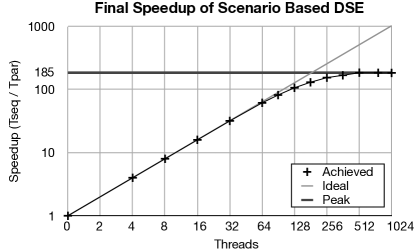
With all these improvements, it is time to show the final scalability of the application. For this experiment, we increased the size of the workload to 10.000 jobs to be certain that the lack of sufficient workload does not limit our speedup. The results are given in Figure 12.
Linear speedup is achieved when the number of worker threads is less or equal to the number of T3 cores. In this case, the chip multiprocessing is exploited and most resources are private to the worker threads. Examples of these resources are the level 1 caches, the execution units and the TLBs.
For 128 threads the parallelized evaluator is 107 times as fast as the sequential version. In this case, the average number of worker threads per T3 core is two. Each worker thread has thus its own execution unit (as there are two in each T3 core), but other resources like caches and TLBs needs to be shared. As a consequence, the speedup is still close to linear.
Above the 128 threads the execution units are also shared between the worker threads. For these configurations, the performance mostly suffers from the limited TLB size. Hence, the maximal obtained speedup is almost 185 times as fast as the sequential execution. Given the fact that there are 128 functional units on the SPARC T3-4, the chip multithreading is able to improve the performance of our scenario-based DSE framework.
8 Conclusions
In this paper the porting of our scenario-based DSE framework to the SPARC T3-4 is described. In order to analyze the performance of our scenario-based DSE on the SPARC T3-4, we used the Oracle Solaris Studio Performance Analyzer to profile the application. This resulted in a modified design of the scenario based DSE where the locks in the shared job queue were replaced by atomic operations. The only locks left in the application are barrier synchronizations that are needed to ensure that the worker threads do not access the queue when it is filled.
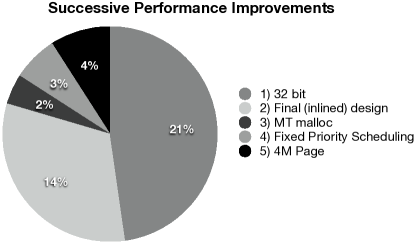
A summary of the improvements during the profiling of our scenario-based DSE framework on the SPARC T3-4 server is given in Figure 13. The largest improvement were made during the first two steps. By using bits instead of bit compilation, already percent performance improvement was achieved. Secondly, the lockless queue implementation combined with function inlining brought another percent of improvement. The heap allocation scheme and the scheduling policy, on the other hand, give moderate improvements (2 or 3%) on the final design of the scenario-based DSE framework. Largest remaining bottleneck are the TLB misses. A 4M pagesize already give a performance improvement of more than 4%, but additional gains could be achieved in future work.
Finally, the SPARC T3-4 server gives a speedup of more than 185 times as fast as the sequential code. Given the fact that there are only 128 execution units, we can conclude that the chip multithreading approach is already paying off. Still, the SPARC T3-4 behaves poorly for a workload with a large number of (similar) processes. When all the hardware threads are filled, only 8 instruction TLB entries are available and 16 data TLB entries. This can quickly give a performance degradation by introducing TLB misses.
References
- [1] Sparc t3-4 server. http://www.oracle.com/us/products/servers-storage/servers/sparc-enterprise/t-series/sparc-t3-4-ds-173100.pdf.
- [2] Sun fire x4440 server. http://www.oracle.com/us/products/servers-storage/servers/x86/034679.pdf.
- [3] S. V. Gheorghita et al. System-scenario-based design of dynamic embedded systems. ACM Transactions on Design Automation of Electronic Systems, 14(1):1–45, 2009.
- [4] S. L. Graham, P. B. Kessler, and M. K. McKusick. gprof: a call graph execution profiler. SIGPLAN Notices, 39(4):49–57, April 2004.
- [5] M. Gries. Methods for evaluating and covering the design space during early design development. Integration, the VLSI Journal, 38(2):131–183, 2004.
- [6] D. Grove. Multicore Application Programming: for Windows, Linux, and Oracle Solaris (Developer’s Library). Addison-Wesley Professional, 1st edition, November 2010.
- [7] Z.J. Jia, A.D. Pimentel, M. Thompson, T. Bautista, and A. Nunez. Nasa: A generic infrastructure for system-level mp-soc design space exploration. In 8th IEEE Workshop on Embedded Systems for Real-Time Multimedia (ESTIMedia), pages 41–50, October 2010.
- [8] G. Kahn. The semantics of simple language for parallel programming. In IFIP Congress, pages 471–475, 1974.
- [9] M. Mitchell. An Introduction to Genetic Algorithms. MIT Press, Cambridge, MA, USA, 1998.
- [10] A. D. Pimentel, C. Erbas, and S. Polstra. A systematic approach to exploring embedded system architectures at multiple abstraction levels. IEEE Transactions on Computers, 55(2):99–112, 2006.
- [11] P. van Stralen and A. D. Pimentel. A High-level Microprocessor Power Modeling Technique Based on Event Signatures. Journal of Signal Processing Systems, 60(2):239–250, August 2010.
- [12] P. van Stralen and A. D. Pimentel. Scenario-based design space exploration of MPSoCs. In Proceedings of IEEE International Conference on Computer Design (ICCD ’10), October 2010.