Multiple Fast Molecular Outflows in the PPN CRL 618
Abstract
CRL 618 is a well-studied pre-planetary nebula. It has multiple highly collimated optical lobes, fast molecular outflows along the optical lobes, and an extended molecular envelope that consists of a dense torus in the equator and a tenuous round halo. Here we present our observations of this source in CO J=3-2 and HCN J=4-3 obtained with the Submillimeter Array at up to resolutions. We spatially resolve the fast molecular-outflow region previously detected in CO near the central star and find it to be composed of multiple outflows that have similar dynamical ages, and are oriented along the different optical lobes. We also detect fast molecular outflows further away from the central star near the tips of the extended optical lobes and a pair of equatorial outflows inside the dense torus. We find that two episodes of bullet ejections in different directions are needed, one producing the fast molecular outflows near the central star, and one producing the fast molecular outflows near the tips of the extended optical lobes. One possibility to launch these bullets is the magneto-rotational explosion of the stellar envelope.
1 Introduction
Pre-planetary nebulae (PPNs) are objects in the transition phase between the asymptotic giant branch (AGB) phase and the planetary nebula (PN) phase in the evolution of low- to intermediate-mass stars. They are expected to become planetary nebulae (PNs) in less than 1000 years as the central stars become hot white dwarfs that can photoionize them. Most PPNs and young PNs were found to have highly aspherical shapes, with a significant fraction having highly collimated bipolar or multipolar lobes (Corradi & Schwarz, 1995; Schwarz et. al., 1997; Sahai & Trauger, 1998; Sahai, 2001; Sahai et al., 2007). As a result, instead of spherical fast winds as in the generalized interacting stellar winds (GISW) model (see e.g., review by Balick & Frank, 2002), collimated fast winds (CFWs) have been proposed to operate during the post-AGB phase (and even earlier during the late AGB phase), and be the primary agents for the shaping of PPNs and young PNs (Sahai & Trauger, 1998; Sahai, 2001). Various CFW models have been used to account for the morphology and kinematics of a few well-studied PPNs and PNs. These include a collimated radial wind with a small opening angle (Lee & Sahai, 2003; Akashi & Soker, 2008; Lee et al., 2009), a cylindrical jet (Cliffe et al., 1995; Steffen & López, 1998; Lee & Sahai, 2004; Guerrero et al., 2008), and a bullet-like ejection (Dennis et al., 2008). In this paper, we examine these models with our high-resolution observations of the well-studied PPN CRL 618, with the goal of understanding the mass-loss processes during the end phases of the evolution of low and intermediate-mass stars.
CRL 618 is a nearby ( 900 pc) well-studied PPN that has multiple highly collimated optical lobes expanding rapidly away from the central star (Trammell & Goodrich, 2002; Sánchez Contreras et al., 2002). Infrared observations in H2 (Cox et al., 2003) and (sub)mm-wave observations in CO (J=2-1, Sanchez et al. 2004, hereafter SCetal04; J=6-5 and J=2-1, Nakashima et al. 2007) revealed fast molecular outflows along the axes of the optical lobes, suggesting the presence of underlying CFWs in this PPN. The fast molecular outflows are also prominent in high-J (J=16-15 and 10-9) CO transitions as shown in Herschel observations (Bujarrabal et al., 2010). MM-wave observations in CO also showed low-velocity molecular cavity walls around the optical lobes (SCetal, 04). An extended molecular envelope has been detected around the PPN, composing of AGB material ejected during the AGB phase. It can be divided into two structurally distinct components: (1) a dense torus extending to out from the central star in the equatorial plane (Sánchez Contreras & Sahai, 2004) and (2) a tenuous round halo surrounding the torus (SCetal, 04). A dense core is also seen near the central star with an outer radius of (SCetal, 04; Lee et al., 2013), tracing the innermost part of the torus. Recent STIS spectroscopic observations showed that the optical forbidden line emission in the lobes is consistent with shocks produced by the underlying CFWs (Riera et al., 2011).
Our hydrodynamical simulations showed that CFWs can readily produce the morphology and the leading bow shocks of the optical lobes (Lee & Sahai, 2003). In those simulations, the CFWs were assumed to be collimated radial winds with a small opening angle. However, in order to reproduce the observed high-velocity optical emission inside the outflow lobes, the CFWs might need to be more collimated, i.e., like cylindrical jets. Alternatively, the CFWs could also be bullet-like ejections as favored by Dennis et al. (2008) in order to explain the multipolar morphology of this PPN.
With the Submillimeter Array (SMA), we have observed this PPN in 350 GHz band at unprecedented resolutions of up to , providing high-quality maps not only for many carbon-chain molecules such as HC3N and HCN and their isotopologues, but also for CO, HCO+, and CS. HC3N and their isotopologues trace mainly the dense core around the central star and their results have been presented in Lee et al. (2013). Here we present our maps of the CO J=3-2 and HCN J=4-3 lines, which have been found to be the best probes of the fast molecular outflows in CRL 618. Other lines such as HCO+ J=4-3 and CS J=16-15 trace roughly the same part of the outflows as the CO and HCN lines, and thus will not be reported here. With about 2 times higher resolution than that in SCetal (04), we spatially resolve the fast molecular outflows previously mapped in CO near the central star, with unprecedented precision. We also detect fast molecular outflows further away from the central star at the ends of the extended optical lobes and a pair of equatorial molecular outflows inside the dense torus. We derive the physical properties of the fast molecular outflows, and then discuss the underlying CFWs and the implied mass-loss process. The equatorial outflows are first seen in this PPN and may have the same origin as the fast molecular outflows.
2 Observations
The observations toward CRL 618 were carried out on 2011 January 23 and February 4 with the SMA in the very extended and extended configurations, respectively. The details of the observations have been reported in Lee et al. (2013) and thus will not be repeated here. Here we only report important information for the CO J=3-2 and HCN J=4-3 maps to be presented in this paper. With natural weighting, we obtained a synthesized beam (resolution) of size at a position angle, PA 83∘. With robust weighting, we obtained a synthesized beam of size at PA 82∘. The channel maps are binned to have velocity resolutions of 1.41 km s-1 and 16.91 km s-1 per channel. The rms noise levels are 45 mJy beam-1 (or 2.54 K) in CO and 60 mJy beam-1 (or 3.13 K) in HCN for the channel maps with a resolution of 1.41 km s-1 per channel. The velocities of the channel maps are LSR. In CRL 618, the systemic velocity is km s-1 LSR, as assumed in Lee et al. (2013). We also define an offset velocity to facilitate our presentation. The flux uncertainty is estimated to be 20%. The coordinates of the central star at the center of the maps are =, =.
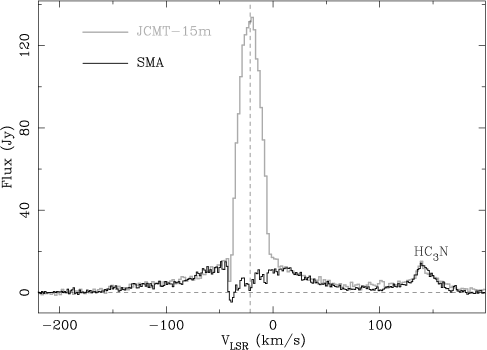
Figure 1 shows our CO J=3-2 spectrum integrated over the whole nebula of CRL 618 obtained with the SMA, overlaid on top of that extracted from the JCMT 15m telescope data archive. The JCMT spectrum was an average of 5 spectra taken on 2009 November 29 and 2010 January 10. The flux intensity of our SMA spectrum has been multiplied by a factor of 1.5, in order to match that of the JCMT spectrum at high velocity in the line wings. This indicates that at high velocity the flux in our SMA data is two-thirds of that in the JCMT data. Our SMA observations, with the shortest baseline having a projected length of 45 m, are insensitive to structure with a scale size of . The flux loss for the high-velocity emission, that has a size of (see next section), is insignificant. That the line profile of the SMA spectrum is almost the same as the JCMT spectrum in the line wings further supports this argument. As a result, the flux difference between the SMA data and JCMT data is likely mainly due to the flux uncertainties in both our SMA data ( 20%) and the JCMT data ( 15%), and some possible flux lost in our SMA data.
The peak at 140 km s-1 traces HC3N emission arising near the central star (Lee et al., 2013), spatially different from the CO emission at that velocity and thus removed from our CO maps. At low velocity with 20 km s-1, the CO emission is mainly from the extended envelope (SCetal, 04) and thus its flux is mostly filtered out by the SMA.
3 Observational Results
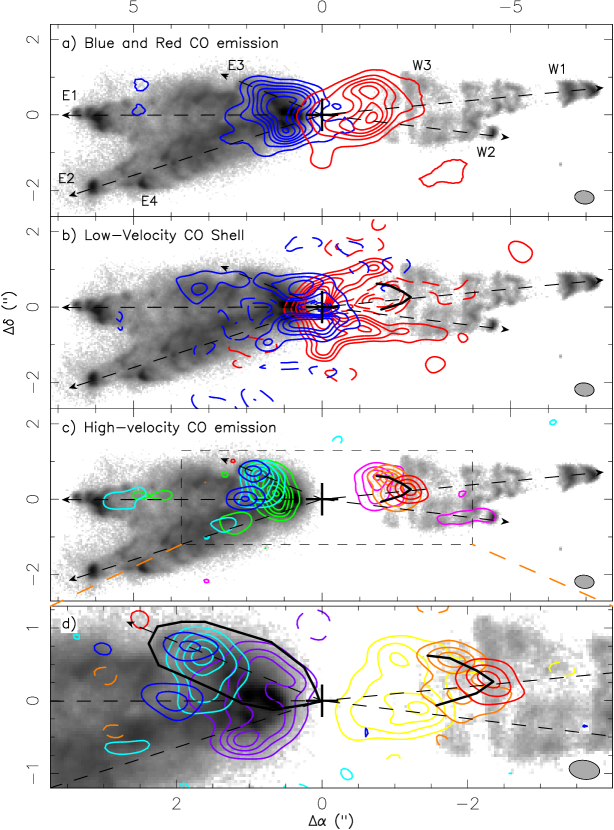
In the following, our CO and HCN maps from the SMA observations (see, e.g., Figure 2) are overplotted on the optical H image of CRL 618 in order to provide the reader with a global view of the nebular structure and relative distribution of the molecular envelope and the shock-excited optical lobes. The H image was taken by the Hubble Space Telescope (HST) in August 2009 (Camera=WFC3/UVIS1, Filter=F656N, exposure time=560s, pixel size=), which was only 1.5 years earlier than our SMA observations. Therefore, the expansion of the optical lobes at the tips in the H image is only (a mean proper motion of in 7 years was obtained by Balick et al., 2013) and thus can be ignored in our study. The H image shows precise geometry, structure, and orientation of the optical lobes in the east (E1), southeast (E2), northeast (E3), northwest (W1), southwest (W2), and other possible lobes E4 and W3 as well. It also shows a clear dust lane in the equatorial plane, tracing the dense torus there that has a radius of and a half thickness of (Sánchez Contreras & Sahai, 2004). The optical lobes in the east are brighter and visible closer to the central star than those in the west because the dusty torus is tilted with its nearside toward the west.
3.1 Molecular outflows
Molecular outflows, which have been detected in CO in other transition lines at J=2-1 and J=6-5 at lower angular resolution (SCetal, 04; Nakashima et al., 2007), are also detected here in the J=3-2 line at higher angular resolution. As seen in Figure 2a, CO emission is mainly detected within from the central star, tracing the outflows mainly inside the dense torus region, with blueshifted emission to the east and redshifted emission to the west. The emission extending along the outflow axes of the E1, E2, E3, and W1 lobes reveals the presence of fast molecular outflows associated with these lobes. Redshifted emission is also seen extending to the south in the equatorial plane and will be discussed later with that seen in HCN.
3.1.1 Molecular-Outflow Cavity Walls
At low velocity (with 20 km s-1), the CO map shows limb-brightened outflow shells that trace the outflow cavity walls around the optical lobes, extending roughly equally to the east and west from the central star to the dense torus (traced by the dust lane) and then to the tenuous round halo where the optical lobes are seen (Fig. 2b). Negative contours are seen in CO at low velocity partly because extended emission is filtered out in our interferometric observations and partly because of absorption by the expanding envelope. Some emission near the center could arise from the dense core detected in the innermost part of the torus (Lee et al., 2013). The walls are bright near the star inside the dense torus, but becomes faint further out inside the tenuous round halo. This indicates that the wall brightness depends on the density of the envelope, in agreement with that the walls are composed mainly of the envelope material swept up by underlying CFWs, as suggested in SCetal (04). The walls appear less extended than those seen in CO J=2-1 (see Fig. 8 in SCetal, 04), likely because the more extended part of the walls is more tenuous and cooler, and thus better traced in lower transition line.
3.1.2 Fast Molecular Outflows
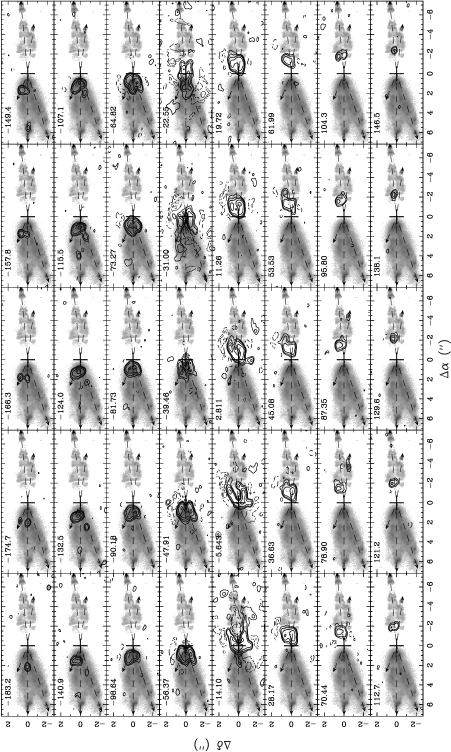
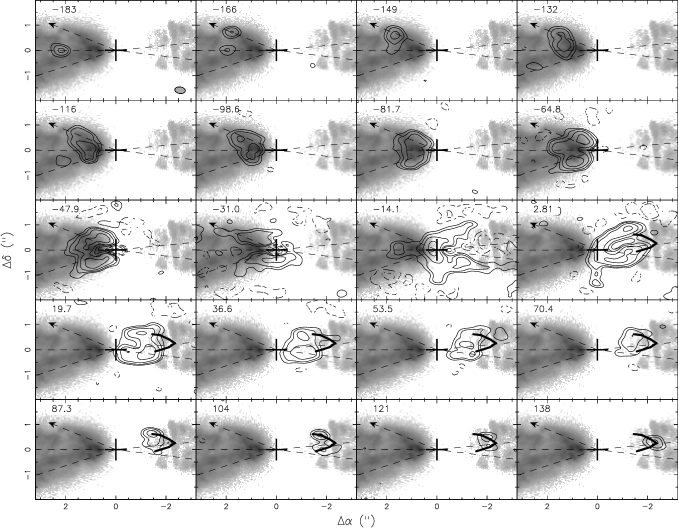
A pair of fast molecular outflows have been detected previously in CO near the central star, one in the east and one in the west (SCetal, 04; Nakashima et al., 2007). Their structure and kinematics can be seen in our CO channel maps presented in Figures 3 and 4 (for zoom-in to the central region). The fast molecular outflow in the west is now spatially resolved also in the N-S direction. The emission with 120 km s-1 forms a bow-like structure projected inside the W1 lobe, with a tip at to the west pointing away from the central star (see Fig. 4 and also Fig. 2d). The velocity decreases from the bow tip to the bow wings toward the central star. On the other hand, the emission with 100 km s-1 (see the channel maps from 70.4 to 2.81 km s-1 in Fig. 4, and also yellow contours in Fig. 2d) forms two limb-brightened shells upstream of the bow-like structure. The shells are roughly aligned with the two limb-brightened edges of the W1 optical lobe further away from the central star. They have an extent of to the west, similar to the dense torus, and thus are likely composed mainly of the material in the dense torus. As a result, the shells likely trace cavity walls of the W1 lobe near the central star, produced by the bow-like structure. Note that the southern shell lies on the W2 lobe and thus part of it could trace cavity walls of the W2 lobe as well.
The fast molecular outflow in the east is now resolved into three fast molecular outflows, one inside the E1 lobe, one inside the E2 lobe, and one on the E3 lobe (see also Fig. 2c). The one inside the E1 lobe and the one on the E3 lobe overlap with each other near the central star. The three outflows are compact with their tips at a distance of to from the central star. Their velocity also decreases toward the central star (see also Figs. 2c and 2d). The fast molecular outflow on the E3 lobe is slightly resolved, appearing as a collimated lobe that closes back to the central star (Fig. 2d), surrounding the E3 optical lobe. Cavity walls are also seen in the east within from the central star surrounding the E1/E2/E3 lobes (see the channel maps from 116 to 47.9 km s-1 in Fig. 4).
In addition, fast molecular outflows are also detected further away from the central star at the end of the E1 and W2 lobes (see Figs. 3 and 2c). They are faint in CO J=3-2 emission and thus not detected before in other interferometric studies. They are collimated and elongated, lying inside the optical lobes.
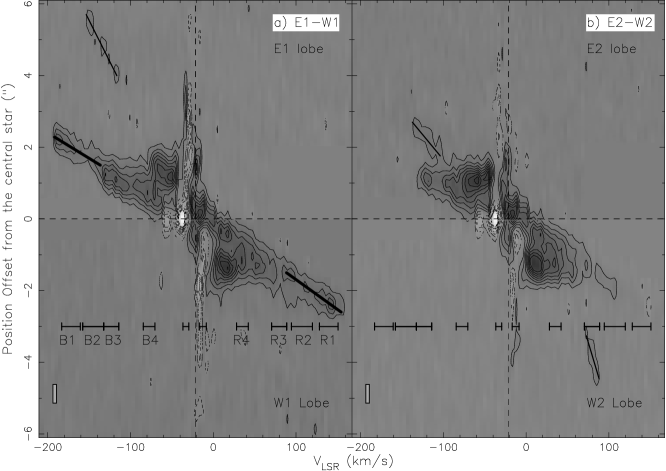
We now investigate in detail, the spatio-kinematic structure of the fast molecular outflows using position-velocity (PV) diagrams. We first examine cuts in our CO J=3-2 maps, taken along the axes of optical lobes shown in Figure 2. In Figure 5a, which shows cuts along the axes of the E1 and W1 optical lobes, we find two prominent linear PV structures (delineated by two thick solid lines) extending from position offsets of to . These are associated with the fast molecular outflows in the E1/E3 and W1 lobes near the central star. A third linear PV structure (solid line) seen at position offsets in the range to , is associated with the fast molecular outflow near the end of the E1 lobe. In Figure 5b, which shows cuts along the axes of the E2 and W2 optical lobes, we see two linear PV structures (solid lines) with position offsets in the ranges to , and - to -, that are associated with the fast molecular outflows in these lobes. Therefore, all of the fast molecular outflows are associated with a linear PV structure, indicating that their velocity decreases roughly linearly from their tips towards the central star. The PV structures with position offsets from the central star likely trace the cavity walls near the central star.
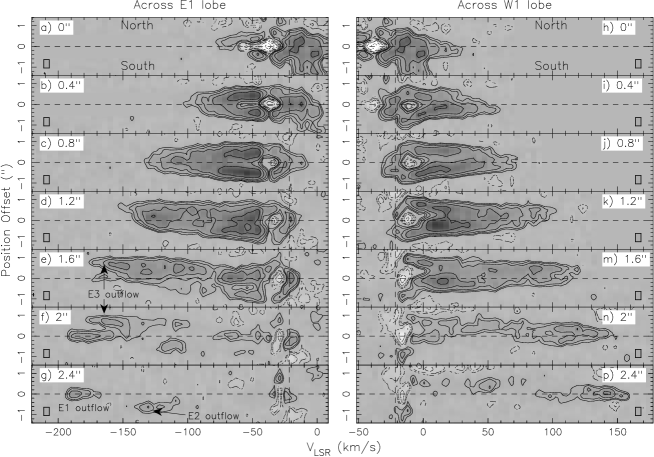
Next, we examine cuts taken laterally across the lobes at different radial distances from the central star (Fig. 6). The right panels in this figure show the PV diagrams for the fast molecular outflow in the W1 lobe. In the cut near the tip of the lobe (panel ), the emission peak occurs at the high-velocity end of the PV structure. But in the cuts within of the central star (panels to ) , the emission peak shifts towards the low-velocity end of the PV structure. This is because the emission at a radial distance of mainly traces material in the cavity walls; panels to reveal an asymmetric hollow PV structure with its cross-section first increasing from the systemic velocity to 10 km s-1, and then decreasing towards the high redshifted velocity.
The cuts across the fast molecular outflow in the E1 lobe (Fig. 6, left) show a similar PV structure, except that it occurs at blueshifted velocities. As in the case of the W1 lobe, the emission in the E1 at a radial distance from the central star, comes mainly from the cavity walls. We note that the fast molecular outflow along the E2 (E3) lobe is also seen in panel (panels and ).
3.2 Comparison with previous interferometric results
In previous CO interferometric observations (e.g, SCetal, 04; Nakashima et al., 2007), the fast molecular outflows were seen as two blobs near the central star, one in the west and one in the east, and thus considered as a filled high-velocity bipolar outflow. In our observations with unprecedented resolutions, the fast molecular outflows are better resolved in the N-S direction, allowing us to compare the CO outflow structure with the HST H image in more detail. The one in the west now appears as a bow-like structure projected inside the W1 lobe. The one in the east is resolved into three outflows, one inside the E1 lobe, one inside the E2 lobe, and one on the E3 lobe. In addition, judging from the detailed structure and kinematics of the fast molecular outflows, we argue that the fast molecular outflows near the star with a distance smaller than (or equivalently with 120 km s-1) are more likely to trace the cavity walls composed mainly of the material in the dense torus. Moreover, at large distance from the central star, we detect two more fast molecular outflows, one near the end of the E1 lobe and one near the end of the W2 lobe.
In summary, our study provides a very important qualitative improvement over previous one by showing that individual fast molecular outflows are associated with individual optical lobes. Thus, our study shows that both the optical and mm-wave observations are tracing the same physical structures. In contrast, the previous studies proposed a model that consists of a single bipolar fast molecular outflow inside a single bipolar elliptical cavity.
3.3 A Pair of Equatorial Clumps
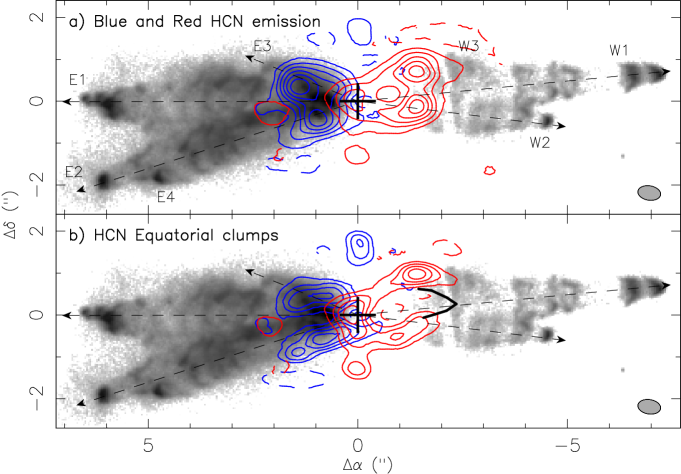
Molecular outflows are also detected in HCN J=4-3, as shown in Fig. 7a, similar to that seen in CO. At low velocity, similar molecular cavity walls are also seen around the optical lobes. In addition, a pair of clumps are also seen in the equatorial plane, with the blueshifted emission in the north and the redshifted emission in the south (Fig. 7b). They are spatially unresolved perpendicular to the equatorial plane. They are bright with a peak brightness temperature of 50 K. They are also detected in CO (Fig. 2b), but the northern clump is almost missing, likely because of substantial absorption by the cold extended expanding envelope seen in CO (SCetal, 04). The emission in the southern clump is not absorbed by the extended envelope because the latter does not have foreground material at the radial velocity of the former.
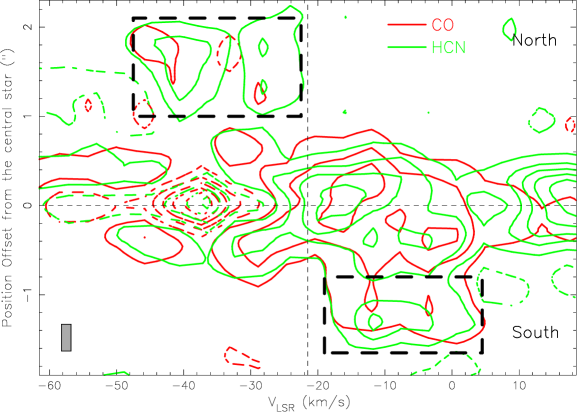
The kinematics of these clumps can be studied using PV diagrams from cuts taken along the equatorial plane at P.A.=0∘ in HCN and CO (Fig. 8). The PV diagrams for HCN and CO are similar. The PV structures in the dashed boxes in the figure are associated with the two clumps. The same foreground absorption that attenuates the CO emission from the northern clump (due to the cold envelope), produces an emission gap at 33 km s-1 in the HCN map. The emission from the two clumps extends from near the systemic velocity to km s-1 away. The redshifted emission in the south clump extends from a radial distance of – and the blueshifted emission in the north clump extends –. No clear velocity gradient is seen within each clump along the equatorial plane.
4 Discussion
4.1 Fast molecular outflows: Total mass
Fast molecular outflows are seen around and inside the optical lobes. Their mass can be estimated from their CO emission. Assuming that the CO emission arises from LTE gas, then the mass is given by
| (1) |
where is the CO flux density in Jy km s-1, is the distance, is the CO-to-H2 relative abundance of as adopted in SCetal (04), is the optical depth correction factor defined as
| (2) |
and to account for the flux scale uncertainty and possible flux lost in our SMA data as mentioned earlier in Section 2. The emission coefficient of CO J=3-2 line is
| (3) |
where is the partition function. Assuming that the gas has a temperature of K (Bujarrabal et al., 2010), then erg s-1 sr-1 mol-1.
The optical depth of the CO emission can be estimated from the single-dish flux ratio of CO J=3-2 (as shown in Figure 1) to CO J=2-1 (as shown in Figure 1 in SCetal (04)) in the line wings with km s-1. The flux ratio there is found to be 3. At K, this requires the optical depth of CO J=3-2 to be 2.5. Thus, we have . As a result, the mass can be simply given by
| (4) |
Here we estimate the mass for the fast molecular outflows that have an expansion velocity greater than 20 km s-1. The fluxes of the fast molecular outflows in the east (E1, E2 and E3 lobes) and west (W1 and W2 lobes) are 435.6 and 391.7 Jy km s-1, respectively. Thus, the total flux is 827.3 Jy km s-1, giving a total mass of 6.5 , slightly lower than the value (0.09 ) derived by SCetal (04) integrating the CO profile over the whole width of the emission wings, i.e., over a velocity range larger than that used by us.
4.1.1 CFWs
The fast molecular outflows can be used to probe the underlying CFWs that produce the optical lobes. In current simulations, the CFW can be a collimated radial wind with a small opening angle (Lee & Sahai, 2003; Lee et al., 2009), a cylindrical jet with a velocity parallel to the jet axis (Lee et al., 2001), or a bullet (a massive clump) (Dennis et al., 2008). In each of these three cases, we expect a bow shock to be formed at the head of the CFW, producing a collimated lobe composed of the bow shock at the tip and cavity walls at the base, with the velocity decreasing from the tip to the base.
Such expectation is supported by the fast molecular outflow in the E3 lobe, that has a collimated shape closing back to the central star, with the velocity decreasing from the tip towards the central star. The bow shock in this lobe can be traced by the highest velocity material seen at the tip of the lobe (Figure 2d). The fast molecular outflow seen in projection on the W1 lobe is likely physically inside the latter. In this case, its bow-like structure can be an internal bow shock produced either by a temporal variation in the wind/jet velocity (Lee et al., 2001; Lee & Sahai, 2003; Lee et al., 2009) or by an internal bullet (Lee & Sahai, 2004; Yirak et al., 2009). The wings of this internal bow shock can interact with (and perhaps brighten) the outflow cavity walls upstream. The PV plots from cuts in our CO J=3-2 images taken across the cavity walls show an asymmetric hollow structure (see Sec. 3.1.2), as expected if the cavity walls are produced by a CFW. The tip of the fast molecular outflow near the central star in the E1 lobe may be the signature of an internal bow shock as well. Other fast molecular outflows that appear as collimated clumps or elongated structures inside the optical lobes may also trace internal bow shocks, but are spatially unresolved in our observations.
4.1.2 Dynamical Age
Table 1 lists the dynamical ages of the fast molecular outflows that can trace the (internal) bow shocks, estimated using the tip radial velocity () and tip distance () measured from the PV diagrams, corrected for the inclination, with the following formula
| (5) |
where is the inclination angle to the plane of the sky.
We set constraints on the inclination angles for individual lobes using previously published results. By modelling the spatio-kinematic structure seen in the bipolar high-velocity outflow HCO+ J=1-0 emission111this study had relatively low angular resolution and could not separate out the contributions from individual lobes on the eastern or western sides of the center, Sánchez Contreras & Sahai (2004) derive an average inclination of 32∘. From long-slit optical spectroscopy of the lobes, Sánchez Contreras et al. (2002) estimate that the extended optical lobes, E1 and E2, have inclination angles of 24∘6∘. The extended optical lobes, W1 and W2, appear to be the counterparts of the E2 and E1 lobes on the west side of the nebula, hence we assume they have similar inclination angles. As a result, we assume an inclination angle of 30∘10∘ for the fast molecular outflows inside the extended optical lobes E1, E2, W1, and W2. Compared to the E1, E2, W1, W2 lobes, the E3 lobe appears to be much shorter. This could either be a result of projection - i.e., E3 could be comparable in length to the other lobes and highly inclined, or it could be intrinsically short (e.g., if it resulted from the same physical event that created the inner outflows in E1, E2, and W1). Thus, the inclination angle for this lobe (and thus its fast molecular outflow) is the most uncertain, and we assume it to be 30∘20∘
The age estimates in Table 1 fall into two groups, one with a mean of 4525 years, and another with a mean of 10540 yrs. We therefore infer that there have been two episodes of CFWs in CRL618, a recent one that occurred about 45 yrs ago producing the fast molecular outflows near the central star, and an older one that occurred 105 yrs ago producing the fast molecular outflows near the tips of the extended optical lobes.
Even though there are uncertainties associated with our age estimates, we think that the above inference is robust. First, for the E1 lobe, the difference between the ages of the inner and outer outflows (34 versus 109 years) cannot be reconciled due to inclination uncertainties because each of these ages are affected in the same way by the common inclination factor. Second, our age estimates for the molecular outflows at the tips of the extended optical lobes are in good agreement with that derived by Balick et al. (2013) for the tips from their proper motion study. They derived a mean expansion (i.e, dynamical) age of 10015 yrs, which does not require a knowledge of the inclination.
4.1.3 Mass and Mass-loss rate of CFWs
Table 1 also lists the masses of the fast molecular outflows that can trace the (internal) bow shocks, derived using Eq. 4. For the fast molecular outflows near the central star, only their tips at a radial distance of more than (or correspondingly with 120 km s-1, see Sec. 3.1.2) trace and thus are used to derive the masses of the (internal) bow shocks. As discussed in Sec. 3.1.2, the emission of the fast molecular outflows within of the central star likely traces the cavity walls, and thus are not included in this mass estimate. For other fast molecular outflows that appear as collimated clumps or elongated structures inside the optical lobes, all their emission can trace and be used to derive the masses of the (internal) bow shocks. The masses of the molecular material in the (internal) bow shocks are on the order of . The total mass of the internal bow shocks is , which is about a tenth of the total outflow mass.
We can now estimate the mass-loss rate in the CFWs, assuming that the CFWs are mainly molecular as proposed by Lee et al. (2009), and are seen as the (internal) bow shocks. As discussed earlier, there are two episodes of CFWs. For the recent one, the (internal) bow shocks near the central star are used. Their mean mass is 1.6 . Their duration is 15 yrs, estimated from their length ( ) and their tip radial velocity, corrected for the inclination. Thus, the mass-loss rate is 1.1 M⊙ yr-1. Note that this mass-loss rate is one order of magnitude lower than the one ( M⊙ yr-1) derived in SCetal (04), which used the total mass of the fast molecular outflows. For the older one, the (internal) bow shocks near the end of the optical lobes are used. Their mean mass is 0.6 . Their duration is 30 yrs, estimated from their length ( ) and tip radial velocity, corrected for the inclination. Thus, the mass-loss rate is 2 M⊙ yr-1. Note that our derived mass-loss rates are highly uncertain, because the mass may include some envelope material, the excitation temperature is uncertain, and molecular fraction is uncertain. Nonetheless, the mass-loss rate of the older fast molecular outflows turns out to be similar to that recently used by Balick et al. (2013) in their jet and bullet models to produce their CRL 618 observations of the extended optical lobes.
4.1.4 Possible Origin
In our first simulation study, we found that a collimated radial wind can produce a highly collimated lobe similar to the W1 lobe, however, it has difficulty producing the bright emission structures seen along the body of the lobe (Lee & Sahai, 2003). In our second such study, we also found that a collimated radial wind has difficulty producing the fast molecular outflow inside the lobe near the central star (Lee et al., 2009). As suggested in those studies, a cylindrical jet may be needed to produce the W1 lobe.
Now in our new observations, fast molecular outflows are detected at the ends of the extended optical lobes, providing an additional constraint to the shaping mechanism of this PPN. They are found to have a similar dynamical age of 105 yrs. At about the same time as our study, Balick et al. (2013) also find that the extended optical lobes all have a similar dynamical age of 100 yr, similar to that of the fast molecular outflows. Thus, in order for the jet model to work, a set of jets in different orientations are needed to be launched around the same time (i.e, 100 yrs ago). However, there is no known physical mechanism that can launch such jets. We therefore think that the bullet model that has multiple bullets ejected simultaneously in different directions around the polar (i.e., rotational) axis is needed, as favored by Dennis et al. (2008) and Balick et al. (2013). One possibility to launch these bullets is the magneto-rotational (MR) explosion of the stellar envelope along the rotational axis (Matt et al., 2006), at the end of the AGB phase.
The fast molecular outflows near the central star in different directions are also found to have a similar dynamical age of 45 yrs. Thus, another episode of bullet ejection seems to be needed. However, it is unclear if there could be a second episode of MR explosion. Alternatively, this recent bullet episode could be related to the onset of the H II region or PN phase that was found to take place around the same time at 40 yrs ago (Tafoya et al., 2013).
4.2 A Pair of Equatorial Outflows
A pair of molecular clumps are seen in HCN and CO in the equatorial plane at a radius of (1350 AU) from the central star, with the redshifted emission to the south and blueshifted emission to the north. They lie inside the extended, expanding dense torus detected in the J=1-0 lines of HCN and HCO+ (Sánchez Contreras & Sahai, 2004). Their deprojected velocity can not be determined because their inclination angle is unknown. Their structure is spatially unresolved perpendicular to the equatorial plane.
The two clumps have maximum offset velocities of 25 km s-1, which is too big to arise from rotation around the central star at a radius of 1350 AU. Therefore, they must trace a pair of collimated molecular outflows (i.e., a collimated bipolar outflow) inside the expanding dense torus. Although it is possible that these clumps are simply compact condensations in the halo not filtered out by the interferometry, their diametrically opposed symmetric location around the nebular center argues otherwise. Furthermore, 2.12 µm H2 line (S(1), v=1-0) emission images of CRL 618 by Cox et al. (2003) show a clump at the same location as the northern HCN clump, indicating the presence of shock-excited gas at that location. This supports our outflow hypothesis for these clumps, in which these are composed of shocked, compressed material at the locations where the fast outflows have been substantially decelerated by the slowly expanding, ambient circumstellar envelope. The lack of an H2 emission counterpart to the southern (red-shifted) HCN clump is most likely due to higher foreground extinction by circumstellar dust, compared to the northern one (which is blue-shifted and closer to us). Similar clumpy outflows have also been seen in the Egg Nebula (in the 2.12 µm H2 line and CO J=2-1 line) in its dense, dusty equatorial torus (Sahai et al., 1998; Cox et al., 2000; Balick et al., 2012).
These two clumps have a mass of 1.1 , assuming that their HCN emission is optically thin with an excitation temperature of 100 K, and a HCN-to-H2 relative abundance of as derived in Sánchez Contreras & Sahai (2004). The MR explosion that we discussed earlier for the fast molecular outflows produces an explosion simultaneously in the equator as well (Matt et al., 2006). However, that explosion may produce a torus-like outflow instead of a bipolar outflow as seen here in the equator.
5 Conclusions
We have presented our SMA results of the molecular outflows of CRL 618 in CO J=3-2 and HCN J=4-3 in the 350 GHz band at up to resolution. With about 2 times higher resolution than that before, we have better resolved the molecular outflow cavity walls and the fast molecular outflows in this PPN, showing that individual fast molecular outflows are associated with individual optical lobes. We have detected a pair of equatorial molecular outflows inside the dense torus, for the first time in this PPN. At high velocity, the fast molecular outflows could trace the (internal) bow shocks and thus the collimated fast winds ejected from the central star. The multipolar morphology and the similar dynamical ages of the fast molecular outflows together suggest the underlying collimated fast winds to be massive bullets ejected from the central star. There seems to be two episodes of bullet ejections, a recent one at 45 yrs and an older one at 105 yrs ago, producing the fast molecular outflows near the central star and near the tips of the extended optical lobes, respectively. One possibility to launch these bullets is the magneto-rotational explosion of the stellar envelope.
References
- Akashi & Soker (2008) Akashi, M., & Soker, N. 2008, MNRAS, 391, 1063
- Balick & Frank (2002) Balick, B. & Frank, A. 2002, ARA&A, 40, 439
- Balick et al. (2012) Balick, B., Gomez, T., Vinković, D., et al. 2012b, ApJ, 745, 188
- Balick et al. (2013) Balick, B., Huarte-Espinosa, M., Frank, A., et al. 2013, arXiv:1305.5304
- Bujarrabal et al. (2010) Bujarrabal, V., Alcolea, J., Soria-Ruiz, R., et al. 2010, A&A, 521, L3
- Cliffe et al. (1995) Cliffe, J. A., Frank, A., Livio, M., & Jones, T. W. 1995, ApJ, 447, L49
- Corradi & Schwarz (1995) Corradi, R. L. M. & Schwarz, H. E. 1995, A&A, 293, 871
- Cox et al. (2000) Cox, P., Lucas, R., Huggins, P. J., et al. 2000, A&A, 353, L25
- Cox et al. (2003) Cox, P. et al., 2003, AJ, 586, L87
- Dennis et al. (2008) Dennis, T. J. et al., 2008, AJ, 679, 1327
- Guerrero et al. (2008) Guerrero, M. A., et al. 2008, ApJ, 683, 272
- Lee et al. (2001) Lee, C.-F., Stone, J. M., Ostriker, E. C., & Mundy, L. G. 2001, ApJ, 557, 429
- Lee et al. (2009) Lee, C.-F., Hsu, M.-C., & Sahai, R. 2009, ApJ, 696, 1630
- Lee & Sahai (2003) Lee, C.-F., & Sahai, R. 2003, ApJ, 586, 319
- Lee & Sahai (2004) Lee, C.-F., & Sahai, R., 2004, ApJ, 606, 483
- Lee et al. (2013) Lee, C.-F., Yang, C.-H., Sahai, R., & Sánchez Contreras, C. 2013, ApJ, 770, 153
- Matt et al. (2006) Matt, S., Frank, A., & Blackman, E. G. 2006, ApJ, 647, L45
- Nakashima et al. (2007) Nakashima, J. et al., 2007, AJ, 134, 2035
- Riera et al. (2011) Riera, A., Raga, A. C., Velázquez, P. F., Haro-Corzo, S. A. R., & Kajdic, P. 2011, A&A, 533, A118
- Sahai et al. (1998) Sahai, R., Hines, D. C., Kastner, J. H., et al. 1998, ApJ, 492, L163
- Sahai et al. (2007) Sahai, R., Morris, M., Sánchez Contreras, C., & Claussen, M. 2007, AJ, 134, 2200
- Sahai (2001) Sahai, R. 2001, in Post-AGB Objects as a Phase of Stellar Evolution, ed. R. Szczerba & S.K. Gorny (Dordrecht:Kluwer),53
- Sahai & Trauger (1998) Sahai, R.,& Trauger, J.T. 1998, AJ, 116, 1357
- Sánchez Contreras & Sahai (2004) Sánchez Contreras, C., & Sahai, R. 2004, ApJ, 602, 960
- SCetal (04) Sánchez Contreras, C., Bujarrabal, V., Castro-Carrizo, A., Alcolea, J., & Sargent, A. 2004, ApJ, 617, 1142 (SCetal (04))
- Sánchez Contreras et al. (2002) Sánchez Contreras, C., Sahai, R., & Gil de Paz, A. 2002, ApJ, 578, 269
- Schwarz et. al. (1997) Schwarz, H. E., Aspin, C., Corradi, R. L. M., & Reipurth, B. 1997, A&A, 319, 267
- Steffen & López (1998) Steffen, W., & Lopez, J. A. 1998, ApJ, 508, 696
- Tafoya et al. (2013) Tafoya, D., Loinard, L., Fonfría, J. P., et al. 2013, arXiv:1306.2630
- Trammell & Goodrich (2002) Trammell, S. R., & Goodrich, R. W. 2002, ApJ, 579, 688
- Yirak et al. (2009) Yirak, K., Frank, A., Cunningham, A. J., & Mitran, S. 2009, ApJ, 695, 999
| Lobe | Tip Distance | Tip Radial Velocity | Dynamical Age | Range | Flux Density | Mass |
|---|---|---|---|---|---|---|
| (arcsec) | (km s-1) | (yr) | (km s-1) | (Jy km s-1) | ( ) | |
| E1 | 165 | 34 | 22 | 1.74 | ||
| E1 outer | 125 | 109 | 153.6 to 104.3 | 9.2 | 0.72 | |
| E2 | 110 | 56 | 148.0 to 101.5 | 9.3 | 0.73 | |
| E3 | 140 | 39 | 18 | 1.41 | ||
| W1 | 165 | 36 | 31 | 2.44 | ||
| W2 | 110 | 101 | 69.0 to 90.2 | 5.7 | 0.45 |