CLASH: young galaxy candidate quintuply lensed by the frontier field cluster RXC J2248.7-4431
Abstract
We present a quintuply lensed candidate discovered in the field of the galaxy cluster RXC J2248.7-4431 () targeted within the Cluster Lensing and Supernova survey with Hubble (CLASH) and selected in the deep HST Frontier Fields survey. Thanks to the CLASH 16-band HST imaging, we identify the quintuply lensed candidate as an optical dropout in the inner region of the cluster, the brightest image having in the f105w filter. We perform a detailed photometric analysis to verify its high- and lensed nature. We get as photometric redshift , and given the extended nature and NIR colours of the lensed images, we rule out low-z early type and galactic star contaminants. We perform a strong lensing analysis of the cluster, using 13 families of multiple lensed images identified in the HST images. Our final best model predicts the high- quintuply lensed system with a position accuracy of 0.8. The magnifications of the five images are between 2.2 and 8.3, which leads to a delensed UV luminosity of at . We also estimate the UV slope from the observed NIR colours, finding a steep . We use singular and composite stellar population SEDs to fit the photometry of the high- candidate, and we conclude that it is a young (age Myr) galaxy with mass of , subsolar metallicity () and low dust content .
keywords:
galaxy cluster, gravitational lensing, high-redshift, dropout selection.1 Introduction
The Cluster Lensing And Supernovae survey with Hubble (CLASH, Postman et al. 2012a), is a 524-orbit multicycle treasury Hubble Space Telescope (HST) program, which is targeting 25 clusters of galaxies with the main goal to measure accurate cluster mass profiles by combining space-based strong lensing analyses and ground-based weak lensing analyses (see Umetsu et al. 2012, Coe et al. 2012, Medezinski et al. 2013).

In addition, taking advantage that galaxy clusters act as gravitational lenses, CLASH also aims to identify and investigate magnified galaxies which contribute to reionize the intergalactic medium in the early Universe at redshift .
Up to date several lensed
galaxies at are identified in galaxy clusters fields, e.g., a galaxy at lensed into 3 images in A383 (Richard et al., 2011) (spectroscopically confirmed), a lensed galaxy at in A370 (Hu et al., 2002) (spectroscopically confirmed), seven lensed galaxies at in A1703 (Bradley et al., 2012) (one of which spectroscopically confirmed), a quadruply lensed galaxy at in the field of MACS0329 (Zitrin et al., 2012), a triply lensed galaxy at z in A2218 (Kneib et al., 2004), a highly magnified galaxy at (Zheng et al., 2012) in MACS1149 and a triply lensed galaxy at in MACS0647 (Coe et al., 2012). The last two sources are the highest redshift lensed candidates detected to date, and were discovered within the CLASH survey. A large sample of single and multiply lensed high- candidate galaxies identified in the CLASH survey is described and analysed in Bradley et al. (2013).
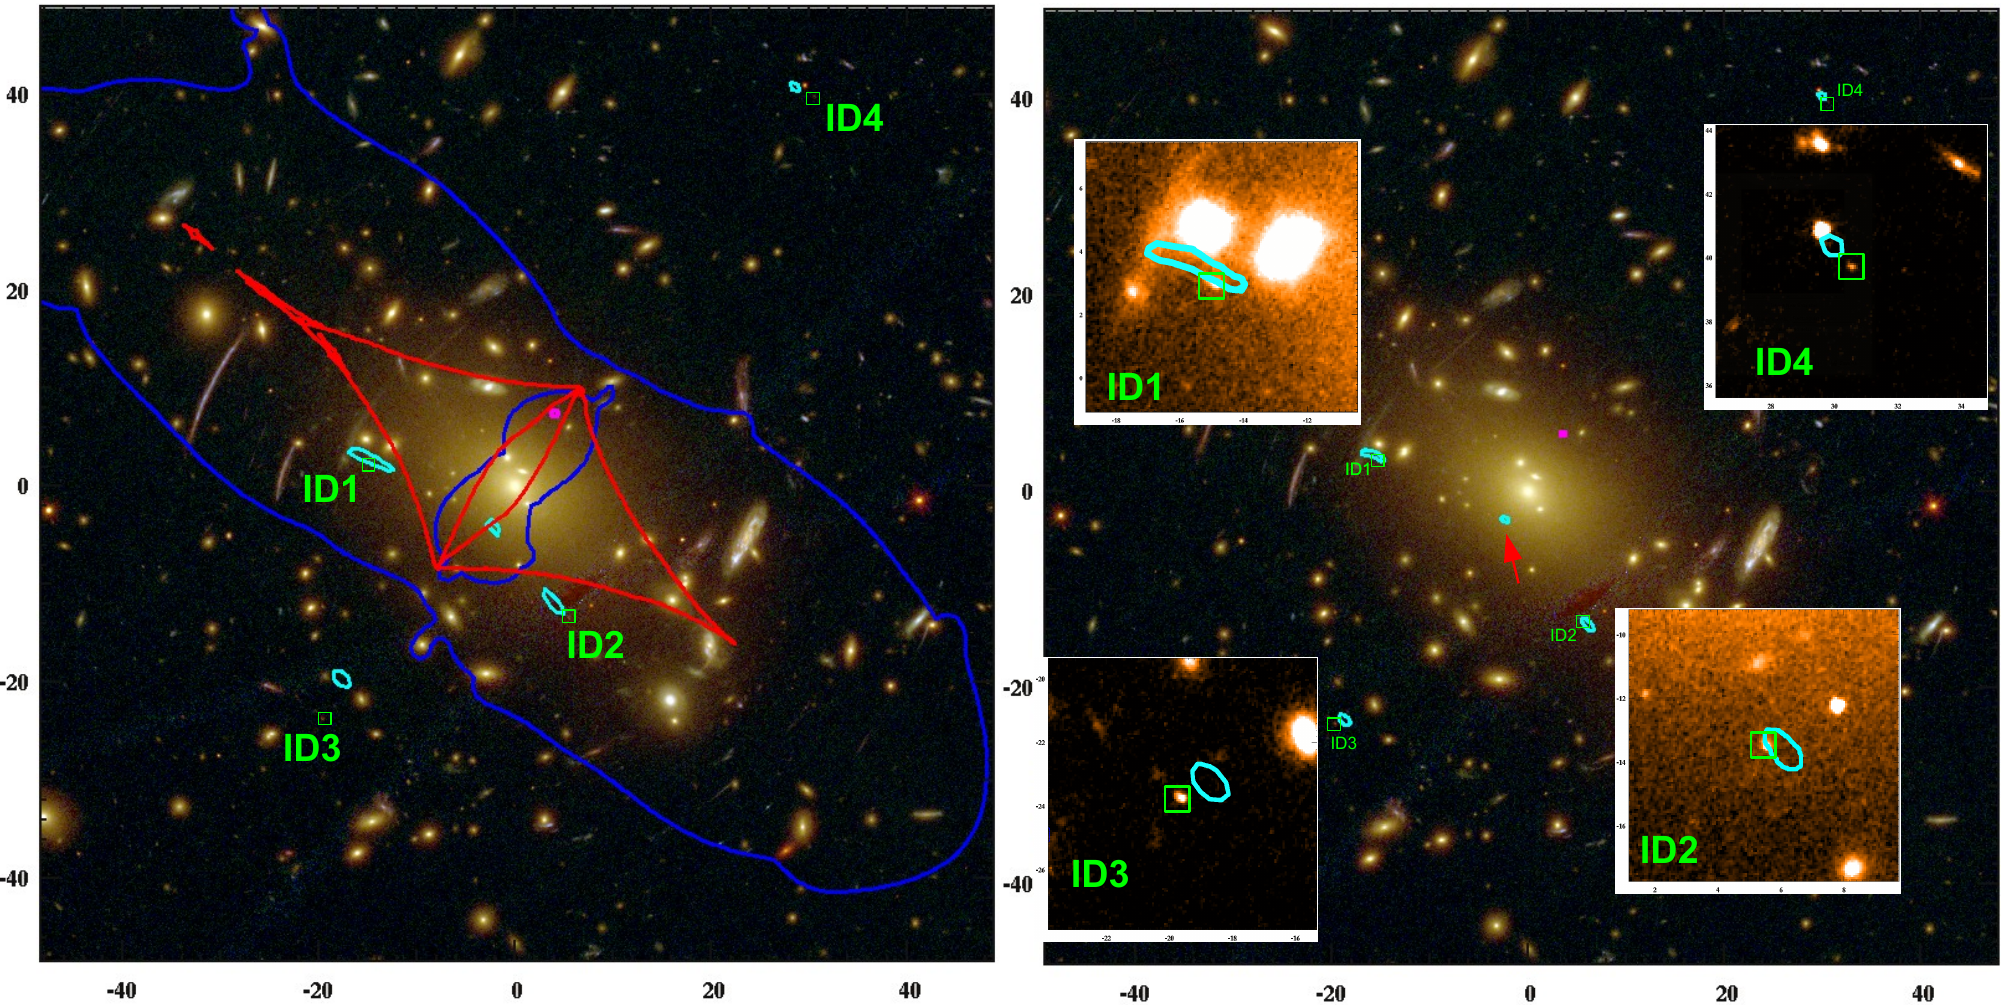
In this paper we present a candidate quintuply lensed galaxy at discovered in the field of the galaxy cluster RXC J2248.7-4431 (here after RXC J2248) that we identify thanks to the wide CLASH photometric dataset (see Fig. 1).
RXC J2248 is a very massive galaxy cluster () at (Guzzo et al., 2009).
It is part of the ROSAT-ESO Flux-Limited X-ray (REFLEX) survey galaxy cluster sample,
and it is the second brightest cluster in this survey, with a luminosity of erg s-1 in the rest frame 0.1-2.4 KeV interval (Guzzo et al., 2009).
Gómez et al. (2012)
confirmed 51 cluster members with spectroscopic observations taken with the Gemini Multi-Objects Spectrograph (GMOS), from which they estimate the mean effective velocity dispersion and redshift of the cluster to be km/s and .
The galaxy density, obtained using spectroscopically confirmed and candidate (selected from the colour magnitude diagram) cluster members, combined with the X-ray isophotes, reveals several substructures and an elongation in NE-SW direction.
The X-ray analysis shows that the X-ray peak emission is shifted by with respect to the galaxy density peak.
The combination of optical, spectroscopic and X-ray analysis thus reveals traces of recent merging activities.
Gruen et al. (2013) performed a multi-wavelength weak lensing analysis of this cluster using deep UBVRIZ imaging data from the ESO-2.2m Wide Field Imager, with a total integration time of about 50 hours. They accurately measured the 2D mass distribution and mass profile for scales larger than 500 kpc, out to 4 Mpc. Their mass map shows that the main dark matter halo is centred on the brightest cluster galaxy (BCG), and that dark matter substructures in and around the cluster coincide with galaxy density substructures, dominated by red galaxies.
Fitting the dark halo with an NFW profile, they obtain the values and , in agreement with previous X-ray and SZ estimates. Due to its strong lensing strength, RXC J2248 is selected in the sample of 6 galaxy clusters of the deep Frontier Fields (FF) HST survey111http://www.stsci.edu/hst/campaigns/frontier-fields/, which aims to map the cluster dark matter to the highest precision and derive magnification maps to investigate the high redshift Universe.
Our paper is organised as follows. In Section 2 we present the photometric data and redshifts. In Section 3 we provide an overview of the dropout selection procedure we use and present the candidates selected in the field of RXC J2248, including the multiply lensed galaxy. In Section 4 we discuss the photometric evidence supporting the lensed high- nature of our candidate. In Section 5 we provide the strong lensing analysis of the cluster, and we show that the lensing model predicts our candidate to be at high redshift. In Section 6 we present the fifth (central) image of the system, identified thanks to the lensing model and detected after subtracting the BCG light from the images. In Section 7 we analyse the physical properties of the candidate and compare it with other similar systems analysed in the CLASH survey. In Section 8 we
present our summary and conclusions.
In this paper we adopt the concordance CDM cosmology with , and .
| Filter | Total time (s) | Instrument | 5 Depth |
|---|---|---|---|
| f225w | 7148 | WFC3/UVIS | 25.43 |
| f275w | 7274 | WFC3/UVIS | 25.44 |
| f336w | 4718 | WFC3/UVIS | 25.74 |
| f390w | 4740 | WFC3/UVIS | 26.47 |
| f435w | 4102 | ACS/WFC | 26.35 |
| f475w | 2064 | ACS/WFC | 26.77 |
| f606w | 3976 | ACS/WFC | 27.07 |
| f625w | 4128 | ACS/WFC | 26.60 |
| f775w | 4058 | ACS/WFC | 26.30 |
| f814w | 8136 | ACS/WFC | 26.94 |
| f850lp | 6164 | ACS/WFC | 25.84 |
| f105w | 2815 | WFC3/IR | 26.86 |
| f110w | 2515 | WFC3/IR | 26.87 |
| f125w | 1509 | WFC3/IR | 26.88 |
| f140w | 2312 | WFC3/IR | 26.93 |
| f160w | 3520 | WFC3/IR | 26.96 |
2 Photometric Dataset
RXC J2248.7-4431 was observed between September 2012 and October 2012 in 16 filters covering the UV, optical and NIR range with the HST Advanced Camera for Surveys (ACS) and the HST Wide Field Camera 3 (WFC3) UVIS and IR cameras. See Tab. 1 for the complete list of the filters.
The HST dataset is composed of mosaic drizzled science images and respective weight images produced with the Mosaicdrizzle pipeline (see Koekemoer et al., 2011). They have pixel scale of 65maspixel and cover a field of view (FOV) of in the ACS images and in the WFC3IR images. Using SExtractor 2.5.0 (Bertin & Arnouts, 1996), we obtain a multiband photometric catalogue of galaxy fluxes extracted within (9 pixels) diameter aperture. We run SExtractor in dual image mode, using as detection image the weighted sum of all the WFC3IR images (see Sec. 3 for more details about the choice of the detection image). We independently estimate the true aperture photometric uncertainties in each filter and compare them with the formal SExtractor uncertainties. We measure the real photometric errors for each detected source using the aperture photometry and sky background222using the formula , where N is the noise, S is the signal, is the number of pixels in the aperture and B is the background per pixel. and we find that the SExtractor errors are underestimated by a mean factor of 4 in our dataset. In the rest of the paper we use photometric uncertainties corrected by this factor. Moreover we compute the flux detection limit in each band by measuring the fluxes within random apertures of diameter within the image FOV. We then fit a gaussian to the flux measurement histogram, estimate the width and obtain the 5 limiting magnitudes. The results are given in Tab. 1.

2.1 Cluster members: photometric and spectroscopic redshifts
We use the spectral energy distribution (SED) fitting code LePhare333http://www.cfht.hawaii.edu/ arnouts/lephare.html (Arnouts et al., 1999; Ilbert et al., 2006) to compute the photometric redshifts of galaxies to use for the selection of cluster members. The package computes photometric redshifts through a standard fitting method to fit the observed fluxes with template spectra, where the is defined as (Ilbert et al., 2006)
| (1) |
where the index refers to the filters of the dataset, is the number of filters, is the observed flux, is its error, is the estimated flux for the redshift and the spectral type , and finally is a normalisation factor.
The photometric redshift is computed by searching for the solution for which the is minimal.
Galaxy, QSO and star SED templates can be used in the templates set; moreover, extinction laws, emission lines and constraints on the range of redshift, age, absolute magnitude and other physical parameters can be included in the fitting procedure (see Arnouts et al., 1999; Ilbert et al., 2006).
The output files give the photometric redshift values for the best fits each for the star, QSO and galaxy templates: in particular for the galaxy solutions, LePhare computes the redshift probability distribution function (PDF()) and gives also the secondary solution from the PDF(), if available.
We adopt as galaxy template set the COSMOS libraries (Ilbert et al., 2009), which include 31 templates describing SEDs of ellipticals, spirals and starburst galaxies.
To take into account the extinction due to the interstellar medium (ISM) we apply the Calzetti extinction law (Calzetti et al., 2000) to the starburst templates, and the SMC Prevot law (Prevot et al., 1984) to the Sc and Sd templates.
We also include emission lines, and add prior information on the redshift distribution:
for that the code uses an prior by type computed from the VVDS survey (see Ilbert et al., 2006; Benítez, 2000).
As QSOs template set we use the SWIRE library (Polletta et al., 2006; Hatziminaoglou et al., 2005; Gregg et al., 2002) including type 1, type 2, Seyfert 1.8 and Seyfert 2 AGN templates. Finally as stellar templates we adopt the Pickles stellar library (Pickles, 1998), which include all the normal spectral types, plus metal-poor F-K dwarves and G-K giants.
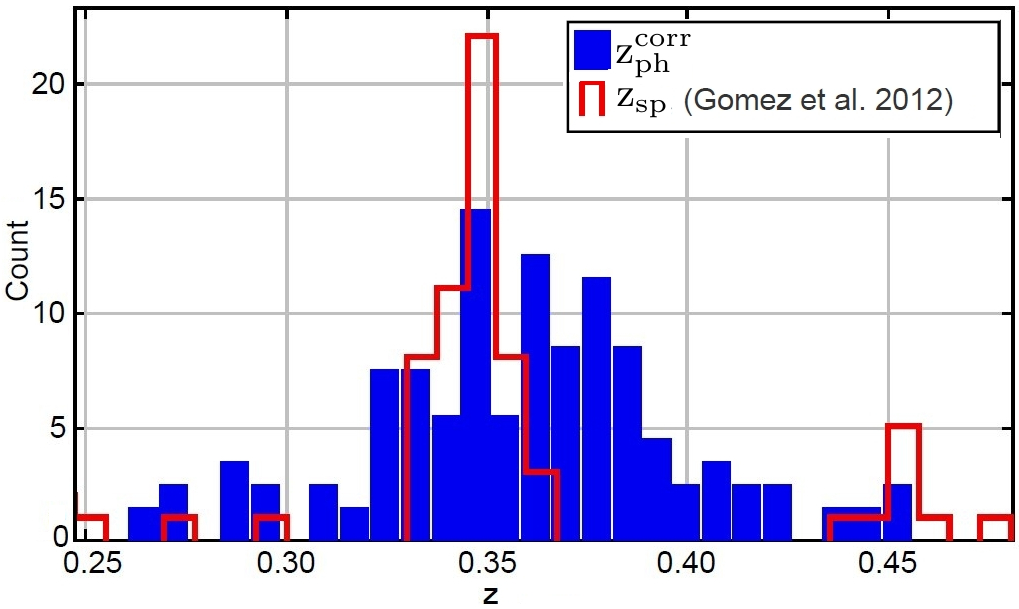
Greisel et al. (2013) carried out a systematic analysis of luminous red galaxies from the Sloan Digital Sky Survey (SDSS) with , which shows that local SED templates do not match within appropriate level the observed colours for galaxies at different redshifts, due to the evolution of the SEDs with redshift. Thus we expect that, using LePhare libraries to estimate the cluster members photo-z, we predict different colours from what we actually observe in some filters. Indeed when we estimate the photometric redshift for the sources extracted in our images, the cluster appears to be at from the histogram. One way to account for the template mismatch of red SEDs at the is to apply some offsets correction to our photometry.
To estimate these offsets we use the sample of spectroscopically confirmed cluster members.
In LePhare they are estimated
through a colour adaptive method which finds the template that best fits the observed photometry given the fixed of the galaxies, and minimises the offset between the observed and predicted magnitudes in each filter. We use 16 cluster members from the spectroscopic sample (Gómez et al., 2012), which are in our WFC3IR FOV, to compute the magnitudes offsets in our filters, and apply these offsets to the observed photometry
to compute the photometric redshift for the cluster member galaxies.
The offsets we get are not significant ( mag) in the filters from f606w to f160w, while they are higher (between 0.1 and 0.36 mag ) in the blue filters (from f475w to f225w) showing that the adopted templates do not describe the early type restframe SEDs well for wavelengths smaller than 3500Å.
In Fig. 2 we plot the histogram of the offset corrected for the bright () galaxies extracted in our images, which shows a peak at the cluster redshift when using the estimated magnitude offsets.
We select 80 bright cluster member candidates with in the range and best fitted with early type templates, all of them lying on the red sequence in the colourmagnitude diagram (see Fig. 3).
We use this cluster members sample as the galaxy component in performing the strong lensing mass model of the cluster (see Section 5).
3 High- dropouts: photometric selection
Star forming galaxies at high redshift are known as Lyman Break Galaxies (LBGs, see Steidel et al., 1996b; Dunlop, 2013), because of the strong break in the SED at the Lyman wavelength (Å restframe) due to the intergalactic medium (IGM) absorption: the UV flux emitted at is absorbed by the neutral hydrogen (HI) of the inter galactic medium (IGM) along the path travelled by the light, causing a peculiar break in the observed SED of these sources at the redshifted .
This effect is known as “Gunn-Peterson trough”: the optical depth of Lyman- photons is directly proportional to the HI density in the IGM. At high redshift (), a tiny amount of HI (for example a fraction ) leads to a complete absorption of UV photons with (see Fan, Carilli & Keating, 2006).
Thus candidate galaxies at redshift can be identified in photometric datasets using the so called ’dropout technique’ (Steidel et al., 1996a; Steidel, 1996), which aims to identify the Lyman- break in galaxy SEDs through colour analyses.
In particular, for galaxies at the Lyman break is redshifted to the near infra-red spectral range, and these sources are expected to be not detected in the UV and optical filters (see Fig. 4).
The optical dropout nature cannot be used alone to identify high- galaxies, since other galaxies mimic the same photometric behaviour: these are early-type galaxies at lower () redshift, for which the dropout is due to the restframe 4000Å break, caused by the stellar photospheric opacity shortward of 4000 Å. In this case the flux blueward this break can be fainter than the detection limit, leading to none detection in the optical filters (see Kriek et al. 2006).
To discriminate between high- star-forming and low- early-type galaxies we need to measure the colours at wavelength redder than the observed break: indeed comparing the SEDs of star-forming galaxies at redshift and early-type galaxies at , the colours at wavelengths larger than the dropout filter are expected to be blue for the former and red for the latter, see Fig. 4.

As described in Sec. 2, we build the multiband photometric catalogue of fluxes in diameter apertures.
We use the weighted sum of all the WFC3IR images as the detection frame since our aim is to identify sources at which are expected to be detected in the NIR filters.
Moreover, since high- candidates are expected to have small size (e.g., the galaxy half light radius at is expected to be , see Bouwens et al. 2004), we use a of 9 pixels as the minimum number of pixels above the threshold, we use the value of 1 as absolute detection treshold and we apply the gaussian Sextractor filter gaussx.conv in the detection.
Our catalogue of sources extracted in the WFC3IRtotal image counts 7767 objects: of course, given the small and the low detection threshold adopted for the extraction, several of these sources are spurious detections due to background fluctuations, but most of them will be automatically removed from our sample through our dropout selection procedure.
To select optical dropout candidates at , we compute photometric redshifts with LePhare (see Sec. 2.1) using the multiband catalogue of aperture fluxes, and using the detection limit as upper limit when sources are not detected in a filter.
Then we select all the sources with first or secondary galaxy solution higher then 5.
We use the starbust (SB) colour-redshift tracks to define the colour criteria that sources need to satisfy as high- candidates. In the UV continuum range ( Å), SB SEDs follow the law (see Calzetti et al. 1994), with an expected mean at (see appendix in Bouwens et al. 2012).
Thus we generate SB SEDs with UV continuum slope , and compute the colour expected for these templates in the CLASH filters as a function of the redshift in the range . In Fig. 5 we plot the SB redshift tracks with in the optical and NIR colours diagram, together with the tracks of an early type galaxy (in red) and a SB galaxy (in green) from the COSMOS library (Ilbert et al., 2009).
Referring to SB tracks
we find that the colours for star forming galaxies at are expected to be (see Fig. 5):
| (2) |
We check the optical and NIR colours of our high- candidates (all the galaxies with primary or secondary solution) and reduce the sample to objects matching these colour criteria. Moreover, we require that all the dropouts have detection fainter than the detection limit in the filters bluer than the f606w, and detection higher than in one or more of the redder filters. To remove stellar contaminants (galactic M, L and T dwarf stars) and reduce the sample to secure extragalactic sources, we reduce our high- dropouts candidates to the extended sources.
Finally, we perform a visual check to remove spurious detections, like objects at the images edges, or stellar sparks.

Our final sample yields 5 high- candidate dropouts. All of them are extended sources with detection in the NIR filters (see Tab. 2 for the aperture photometry in the CLASH HST filters).
We supplement our photometric dataset with mosaic mid-IR imaging data from Spitzer
obtained with the Infrared Array Camera (IRAC) in channel1 (3.6 m) and channel2 (4.5 m), from the survey ”Use of massive clusters as cosmological lenses”(PI: G. Rieke, program ID 83). We analyse these images and find that three of our high- candidates (ID2, ID3 and rD) are detected in both IRAC channels, even if they are very faint.
The photometric contamination by the bright close by cluster members is very high in these mid-IR images, in particular if compared to the optical and NIR HST images.
This contamination, also aggravated by the Spitzer/IRAC PSF being larger than that of the HST,
does not allow for estimation of robust uncertainties on the extracted photometry for our candidates. Thus, for these candidates we extract the mid-IR photometry within aperture of , and we use the resulting values as upper limits in our following SED fits.
In Fig. 6, we present the postage stamp images from the f435w to the IRAC/45m filter, and in Tab.2 we provide the aperture photometry in the filters from f625 to IRAC/45m. The four objects ID1-4 have the lowest wavelength detection in the band: ID1-3 are first detected in the f814w filter with magnitude and ID4 is detected with magnitude in the f814w filter and in the f850lp filter.
The high- candidate rD is a dropout in the band: it is not detected in the filter bluer than f625w, in which is detected at the limit, and it has detection in the f775w and redder filters. For this candidate we get z, in agreement with the detection in f775w and with the fainter detection in the f625w filter.
In Tab. 3 we summarise the photometric redshift results from LePhare: all the candidates have only photometric redshift solution at high redshift, , for galaxy templates.
ID1-4 have all similar photometric redshifts of with a well defined peak in the PDF(z), see Sec. 4, and their positions on the cluster FOV suggest that they can be a system of multiple images of the same source lensed by the cluster.
In the following sections we will focus on the system ID1-4 to verify its high- multiple lensed nature through photometric and lensing analyses.
| ID | f625 | f775 | f814 | f850 | f105 | f110 | f125 | f140 | f160 | 36m | 45m |
|---|---|---|---|---|---|---|---|---|---|---|---|
| ID1 | |||||||||||
| ID2 | |||||||||||
| ID3 | |||||||||||
| ID4 | a | ||||||||||
| rD | b |
-
a
In the filter f814w, ID4 is fainter than the detection limit, but is brighter than the limit.
-
b
In the filter f625w, rD is fainter than the detection limit, but is brighter than the limit.

| ID | RA(J2000) | DEC(J2000) | z | zQSO | Det Band | |||
|---|---|---|---|---|---|---|---|---|
| ID1 | 342.18906 | -44.53003 | 5.70 | 0.9 | 6.00 | 6.5 | 10.1 | f814w |
| ID2 | 342.18106 | -44.53461 | 5.88 | 2.5 | 5.88 | 14.3 | 14.2 | f814w |
| ID3 | 342.19089 | -44.53746 | 6.04 | 1.7 | 6.00 | 20.1 | 19.4 | f814w |
| ID4 | 342.17130 | -44.51981 | 5.97 | 2.0 | 6.20 | 4.3 | 6.4 | f814w() |
| rD | 342.17145 | -44.54686 | 5.11 | 2.2 | 5.00 | 9.2 | 18.6 | f775w |
4 Quadruply lensed dropout: photometric evidence
The four high- lensed candidates ID1-4 are dropouts: they are not detected in the filters bluer than the f814w, in which ID1-3 are clearly first detected with detection , while ID4 is detected with detection higher than . Moreover they are detected in all the WFC3IR bands (see Fig. 6). The image ID1 is the brightest among the ID1 to ID4, but it is also the one with a highly contaminated photometry since it is close to two very bright early-type galaxies (the distance from the centre of the closer galaxy is ). ID4 is the faintest image and the furthest from the cluster centre (thus we expect it to be the least magnified), moreover it is close () to a star. ID2 and ID3 are the images with the best photometry, since both are in isolated regions: we will refer to these images when using the photometry to estimate physical properties of this system. ID2 and ID3 are also identified in both Spitzer/IRAC channels, but the S/N is too low to allow for extraction of robust photometry. Thus we extract photometry in aperture and use it as upper limit in our following photometric analysis. About the other two candidates, ID1 is completely embedded in the light of the two nearby galaxies, while ID4, the faintest of our system, is not detected in any of the two channels.
4.1 Photometric redshift
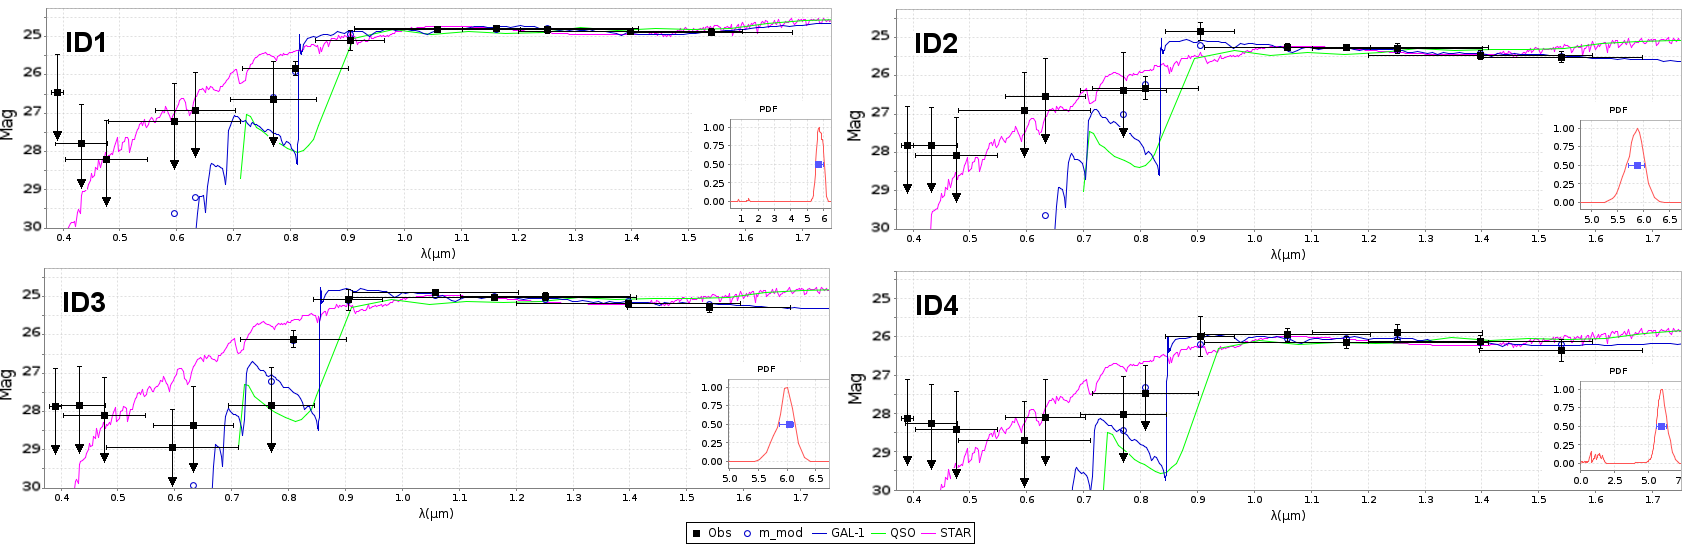
As described in Sec. 2.1, we compute the photometric redshifts with LePhare using the COSMOS galaxy templates library and photometry within 9 pixels aperture:
for the ID1-4 dropouts, we obtain only high- solution at with reduced DOF between 0.9 and 2.5, see Tab. 3.
The four high- candidates are best fitted with starbust (SB) galaxy templates, the SB10 (for ID1) and SB11 (for ID2,ID3 and ID4) templates from the COSMOS library. ID1 and ID4 best fits are obtained applying the extinction law with colour excess E(B-V) of 0.2 for ID1 and 0.1 for ID4. This apparent reddening can be related to the light contamination by the two close early type galaxies for ID1, and to the nearby red galactic star for ID4. The other two objects of our system, ID2 and ID3, require no extinction in the best fit.
For the QSO templates, we use the SWIRE QSO library including the two Seyfert templates, see Sec. 2.1.
The best QSO fits are still for a source:
in particular when we include the two Seyfert galaxy SED in the QSO templates, we get a best fit for with DOF lower than the galaxy best fit, while if we only include the pure AGN templates, we still get best , but with DOF higher than the galaxy (see Tab. 1).
As stellar templates we use the Pickles library Pickles (1998): the stellar SED fits give the worst results, as shown in Tab. 3.
This, in addition to the extended nature of the candidates, support the exclusion of red dwarf galactic star contaminants.
See Tab. 3 for a complete summary of the estimations for the ID1-4 candidates.
As we described, we get only high- solutions for our candidates when we run the SED fit on the range . Thus to investigate what the values for a low redshift scenario would be, we force the to be lower than 4 when we run LePhare. With this constraint we get within 0.8 and 1.4 for the four dropouts, but with DOF due to the bad fit in the NIR filters.
Actually if we totally exclude the WFC3IR photometry, using only fluxes up to the f850lp filter, we get good fits for with reduced DOF within 0.2 and 2.6: in this case the predicted NIR fluxes are brighter than the observed ones.
In Fig. 7 we present the best SED fit results from LePhare. The high- photometric solutions we get for these sources are in agreement with the photometric redshift provided in the CLASH public catalogue444http://archive.stsci.edu/prepds/clash/ for RXC J2248, except for the ID2 candidate, for which a is obtained. We check the photometry provided in the public catalog for this candidate, and we find that there are fake detections in some of the ACS filters
(f606w, f625w and f775w), due to photometric contamination in these central cluster regions, which leads to the low-z
solution for the for this candidate. This photometry is also extracted in an aperture of 89 pixels, slightly larger then the aperture we use (64 pixels). In addiction, this candidate is also very close to the ACS chip gap in the Mosaicdrizzle images (see Fig. 6). In our detailed photometric analysis of the ID1-4 candidates, we find that in those filters (and in the bluer ones) ID2 has detection lower than the local
detection limit: this, combined with the photometry we
extract in the NIR filters, places the ID2 candidate at
in our photometric analysis.
4.2 Colour-colour diagrams
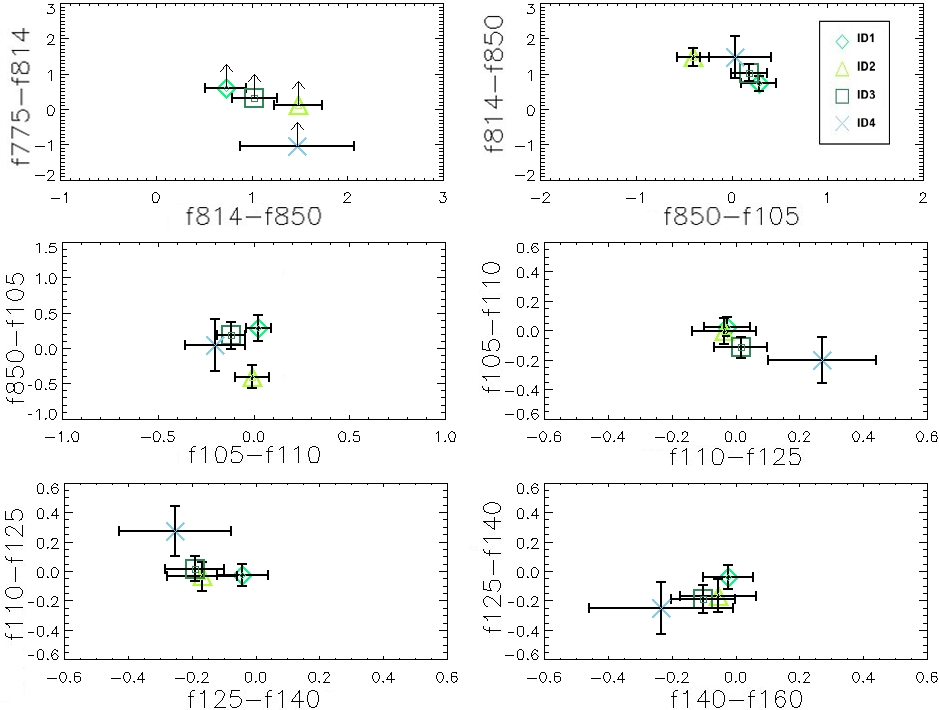
To assure the robustness of dropout high- candidates and to rule out low- contamination, namely by early-type galaxies at , we analyse the NIR colours of our high- candidates in the colour-colour diagram. In the following colour analysis of the z dropout, we refer to the photometry in the dropout filter, f775w, and in the NIR filters, f105w, f125w, f160w. We do not consider any impact of the Ly emission line contribution, since the z photometric redshift predicted for ID1-4 places the Ly- emission in the f814w and f850lp filters. In Fig. 5 we show the optical and NIR colours diagram for the sources extracted in the FOV of RXC J2248, the high- dropouts that we select in this field and the colourredshift tracks of star-forming galaxies (with ) with which we compare the colours of our dropouts. In addiction, we also plot the colourredshift track for the SB template from the COSMOS library which best fit our candidates (SB11). Our four candidates ID1-4 all lie in the region defined with the colour criteria of Eq. 2: their observed NIR colours are consistent with the colours predicted for high- star forming galaxies with UV slope between -2 and -3. We measure the UV-slope from the observed NIR photometry (see Bouwens et al. 2012,Bouwens et al. 2013):
| (3) |
and we find that our candidates have a mean , which is slightly bluer than the mean UV slope measured for .
Bouwens et al. (2013) shows that measurements of are very sensitive to accurate photometry, and that bluer estimations can be due to errors in PSF estimations. To investigate such effect, we PSF match our nir images to the f160 image using the psfmatch routine in IRAF555http://iraf.noao.edu/. We get , thus the PSF matching has no effect on our estimation.
Since lensing is achromatic, multiple images of a source are expected to have the same colours, unless the source itself has intrinsic spatial colour variation, or the extinction along the line of sight is different for the different multiple images. Thus, we compare all the NIR colours of the 4 dropouts with each other, to support their lensed nature on the basis of photometry. As shown in Fig. 8, the colours of the 4 dropouts are all consistent within 4 times the SExtractor formal errors, with the only exception of the f105-f110 colour for ID4, which is slightly greater than the other dropouts.
5 Quadruply lensed dropout: lensing evidence
Given the positions of the ID1-4 candidates in the field of the cluster (see Fig. 1), we investigate the possible multiply lensed nature of the system. Therefore we now derive a strong lensing model of RXC J2248 to verify quantitatively whether they are lensed images of the same background source.
We model the inner mass profile of the cluster with the strong lensing modelling software GLEE developed by S. H. Suyu
and A. Halkola (Suyu & Halkola, 2010; Suyu et al., 2012). Given information as
positions and redshifts of multiple images and using parametric
models to describe the mass profiles of the lenses, the code yields
the best fitting model which reproduces the observed images (through a
simulated annealing minimisation in the source and/or image planes),
as well as a Monte Carlo Markov Chain (MCMC) sampling to find the most
probable parameters and uncertainties for the model.
5.1 Mass components
We describe the smooth dark halo (DH) mass component of the cluster with a Pseudo Isothermal Elliptical Mass Distribution (PIEMD) profile (Kassiola & Kovner, 1993), with projected surface density given by
| (4) |
where is the velocity dispersion of the DH and is the core radius. The galaxy component is modelled with truncated singular isothermal elliptical profiles (BBS) (Brainerd, Blandford & Smail, 1996), parametrized by the central velocity dispersion and the truncation radius .
The projected surface mass density for this profile is:
| (5) |
We select 80 cluster members to include in our strong lensing model, counting 16 spectroscopically confirmed cluster members from Gómez et al. (2012) and 64 cluster members selected through photometric redshift and magnitude-colour cuts (see Sec. 2.1).
As in Halkola, Seitz & Pannella (2006) and Eichner et al. (2013), to reduce the number of free parameters, we adopt luminosity scaling relations for the velocity dispersion (based on the Faber-Jackson relation) and the truncation radius (as measured in Eichner et al. (2013)) of the galaxies:
where the amplitudes and are the velocity
dispersion and halo size for a reference galaxy halo with luminosity
, while the exponents of the luminosity relations are and . Assuming that scales
with , (Halkola, Seitz & Pannella, 2006; Hoekstra, Yee & Gladders, 2004), the free parameters used to tune the galaxy mass contribution are reduced to the reference galaxy velocity dispersion and truncation radius . In this work we use as reference galaxy the second brightest galaxy of cluster.
The amplitudes of the luminosity relations are measured for both cluster galaxies in the cluster core (Eichner et al., 2013) and field galaxies (Brimioulle et al., 2013). However, peculiar galaxies, as the cluster BCGs, have large scatter from these luminosity relations (see Postman et al. 2012b, Kormendy & Bender 2013) and likely a different size relation; therefore we need to optimise them independently to robustly account for their contribution to the total mass profile.
We use the observed fluxes in the f814w band as a tracer for
the luminosity of the cluster members. For the ellipticities and orientations we use the values estimated with SExtractor in the same band (assuming that the dark matter halo ellipticities of the cluster galaxies are equal to their surface brightness ellipticities).
5.2 Multiple images
Since we lack spectroscopic confirmation of multiple image systems, we use the wide CLASH photometric dataset to select multiple images based on similarity of surface brightness,
morphology and photometric redshift: we identify 13 candidate multiple lensed systems, for a total of 37 multiple images, without counting the high redshift lensed candidate system (see Fig. 1). The sources redshifts are free parameters in our models: for each system, we use the mean photometric redshift of the multiple images as starting value for , and we optimise it within an interval of dz using a gaussian prior (for the system 12, since we get different for the multiple images, we use a larger interval of dz).
Host (2012) and D’Aloisio & Natarajan (2011) show that, on cluster scales, multiple image positions can be reproduced with accuracy not better than 1-2 arcseconds due to density fluctuations along the line of sight. Starting with realistic uncertainties on the multiple images positions is important in the modelling procedure, because underestimating such errors will lead to underestimated uncertainties on the mass model free parameters. Thus we adopt a positional uncertainty of on the multiple images positions, even though from the HST images we can estimate such positions with an accuracy of .
In Tab. 4 we list all the multiple lensed systems with the respective positions and .
| Id | Ra | Dec | ||
| 1a | 342.19585 | -44.52889 | 1.22 [1.12-1.25] | 1.22 [1.17-1.27] |
| 1b | 342.19450 | -44.52702 | 1.09 [1.07-1.11] | 1.22 [1.17-1.27] |
| 1c | 342.18646 | -44.52119 | 1.28 [1.27-1.29] | 1.22 [1.17-1.27] |
| 2a | 342.19560 | -44.52843 | 1.11 [1.12-1.12] | 1.23 [1.18-1.28] |
| 2b | 342.19479 | -44.52732 | – | 1.23 [1.18-1.28] |
| 2c | 342.18630 | -44.52107 | 1.23 [1.22-1.25] | 1.23 [1.18-1.28] |
| 3a | 342.19257 | -44.53073 | 1.29 [1.27-1.31] | 1.27 [1.22-1.31] |
| 3b | 342.19247 | -44.53046 | 1.24 [1.22-1.25] | 1.27 [1.22-1.31] |
| 3c | 342.17974 | -44.52157 | 1.13 [1.11-1.13] | 1.27 [1.22-1.31] |
| 4a | 342.19315 | -44.53653 | 1.29 [1.27-1.30] | 1.43 [1.36-1.50] |
| 4b | 342.18781 | -44.52732 | 1.49 [1.43-1.54] | 1.43 [1.36-1.50] |
| 4c | 342.17919 | -44.52353 | 1.40 [1.39-1.41] | 1.43 [1.36-1.50] |
| 5a | 342.19294 | -44.53659 | 1.37 [1.35-1.38] | 1.43 [1.36-1.51] |
| 5b | 342.18774 | -44.52747 | 1.38 [1.36-1.39] | 1.43 [1.36-1.51] |
| 5c | 342.17889 | -44.52361 | 1.45 [1.24-1.48] | 1.43 [1.36-1.51] |
| 6a | 342.18843 | -44.54002 | 1.38 [1.36-1.40] | 1.44 [1.38-1.51] |
| 6b | 342.17580 | -44.53253 | 1.69 [1.68-1.68] | 1.44 [1.38-1.51] |
| 6c | 342.17417 | -44.52837 | 1.53 [1.51-1.56] | 1.44 [1.38-1.51] |
| 7a | 342.18005 | -44.53842 | 0.92 [0.90-0.94] | 1.04 [0.99-1.08] |
| 7b | 342.17553 | -44.53589 | – | 1.04 [0.99-1.08] |
| 7c | 342.17193 | -44.53024 | 1.05 [0.04-1.07] | 1.04 [0.99-1.08] |
| 8a | 342.18187 | -44.54049 | 2.18 [2.16-2.20] | 1.96 [1.87-2.05] |
| 8b | 342.17427 | -44.53710 | 2.12 [2.10-2.14] | 1.96 [1.87-2.05] |
| 8c | 342.16940 | -44.52722 | 2.12 [2.08-2.15] | 1.96 [1.87-2.05] |
| 9a | 342.18032 | -44.54083 | 2.92 [2.82-2.99] | 2.91 [2.71-3.14] |
| 9b | 342.17476 | -44.53858 | 3.02 [2.91-3.08] | 2.91 [2.71-3.14] |
| 9c | 342.16780 | -44.52628 | 2.70 [2.55-2.79] | 2.91 [2.71-3.14] |
| 10a | 342.18078 | -44.54089 | 2.94 [2.96-3.05] | 2.95 [2.75 3.20] |
| 10b | 342.17462 | -44.53842 | 3.12 [2.99-3.26] | 2.95 [2.75 3.20] |
| 10c | 342.16792 | -44.52621 | – | 2.95 [2.75 3.20] |
| 11a | 342.17504 | -44.54102 | 3.12 [3.04-3.19] | 2.95 [2.86-3.04] |
| 11b | 342.17315 | -44.53999 | 2.91 [2.83-2.99] | 2.95 [2.86-3.04] |
| 11c | 342.16557 | -44.52954 | 3.04 [2.64-3.18] | 2.95 [2.86-3.04] |
| 12a | 342.19555 | -44.53213 | 1.91 [1.75-2.54] | 2.27 [1.99-2.66] |
| 12b | 342.19392 | -44.52870 | 1.75 [1.46-1.90] | 2.27 [1.99-2.66] |
| 12c | 342.18278 | -44.52152 | 3.06 [2.96-3.15] | 2.27 [1.99-2.66] |
| 13a | 342.19369 | -44.53012 | 1.59 [1.13-2.24] | 1.371 [1.25-1.65] |
| 13b | 342.19333 | -44.52941 | 1.57 [1.12-3.21] | 1.371 [1.25-1.65] |
5.3 Results
First we optimise the mass model using the 13 multiple image systems in Tab. 4 as constraints, getting the best fitting model which reproduces the positions of the observed multiple lensed images
with (having 21 degrees of freedom) in the image plane. Then we run the MCMC to sample the most likely parameters for the model.
We use this mass model of RXC J2248 to analyse the multiple imaging for a source at
and we find that the model predicts a 4 multiple images configuration very close to the one that we observe
(see Fig. 9).
We also test the prediction assuming that the source of this system is at low-. From LePhare, when we force the photometric redshift of the ID1-4 images to be at low-, we get the to be within 0.8 and 1.4 when (see Section 4). For redshift of the source within this range, the model predicts lensed images which have no correspondence with sources observed in the field of the cluster, thus supporting that the lensed system is at high redshift.
In addition, we verify that independent mass modelling with the full light-traces-mass method of Zitrin et al. 2009 supports the identification of multiple images outlined here, as well as the solution for the quadruply lensed source.
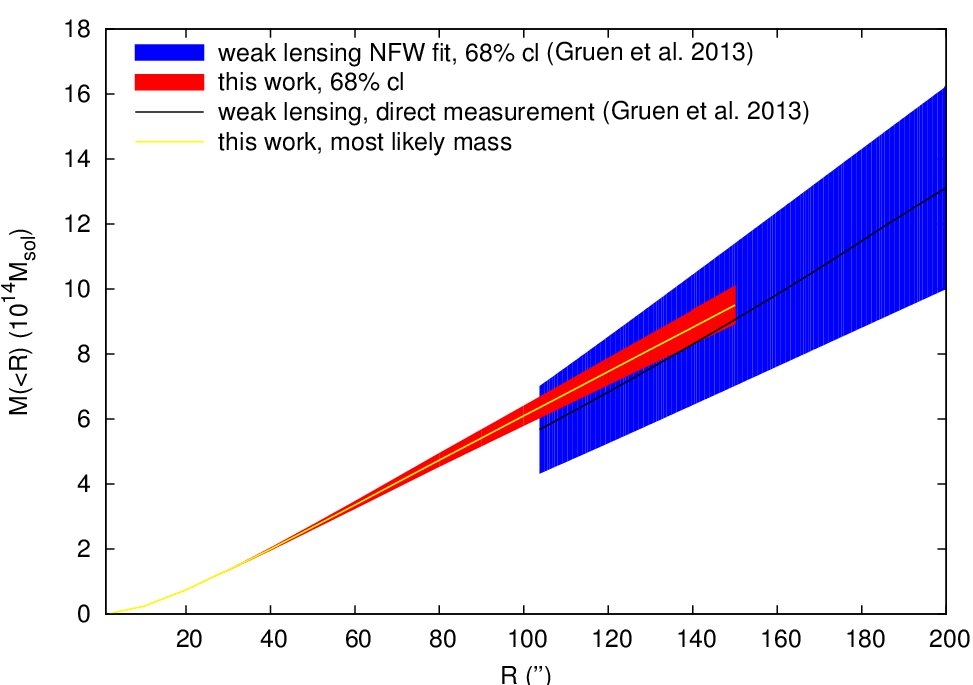
Once we tested that our model predicts the observed high- multiple lensed system, we perform a new strong lensing model of the cluster, using this time also the high- quadruply lensed system ID1-4 in the modelling. For the redshift of this system we use a starting value of and allow it to vary within the range throughout the modelling process. After the minimisation and the MCMC runs, we get a final model of the cluster with with 27 degrees of freedom. For the cluster–scale halo, we get an offset of , with respect to the BCG, axis ratio of and position angle P.A.=. The cluster mass distribution has a core radius of , and it has an Einstein radius = for a source at , which gives a central velocity dispersion of for a singular isothermal sphere. The BCG is well centred on the DH, its axis ratio is , the major axis has an offset of with respect to the DH orientation, and has a velocity dispersion of . The total mass of the cluster is within the Einstein radius for a source at . To compare our mass prediction with the weak lensing results from Gruen et al. (2013), we calculate the most likely mass and its uncertainties by taking 200 random MCMC sample points. We derive the surface mass density and measure the projected mass up to for each model and measure their projected mass within different apertures. The prediction from both lensing analyses are in good agreement in the radial region where they overlap, (see Fig. 10).
Our best model of the cluster predicts the 4 multiple lensed high- system with an accuracy of on the observed positions and a source redshift of . In Tab. 4 we list the predicted by our final best model also for all the other systems of multiple images.
The magnifications induced by the cluster for the ID1-4 system
are , , and . The magnification of the brighter image, ID1, is not well constrained due to its position very close to the critical lines. In proximity of the critical lines, the magnification gradient rapidly vary, leading to high uncertainties in the magnification in correspondence of small uncertainties in the position.
We estimate the relative magnification of ID2 and ID3 to be , which is in agreement with the observed fluxes ratio within 4 times the SExtractor photometric errors.
Finally, comparing the previous model, and the final one with the high- system, we found that including or omitting the high redshift candidate system does not significantly alter the results for the cluster mass model.
6 The central image
As we show in Fig. 9, our final best model predicts a central fifth image for our high- system, as we also expect from lensing theory. This central image is away from the BCG, thus it is completely embedded in the BCG light. However,
we find that, in the NIR images of the CLASH dataset, a source is detected at the position predicted for the central image (see Fig. 11). We call this source ID0.
To investigate this source we subtract the BCG light from our images. Within CLASH, we use the isophote fitting routine, SNUC666see http://astronomy.nmsu.edu/holtz/xvista/index.html and Lauer 1986, which is part of the XVISTA image processing system , to derive two-dimensional models of all early-type BCGs in the CLASH clusters. SNUC is capable of simultaneously obtaining the best non-linear
least-squares fits to the two-dimensional surface brightness distributions in multiple, overlapping galaxies (see Lauer 1986). We perform these fits independently in the 12 HST passbands acquired with the ACS/WFC and WFC3/IR cameras (the BCGs are typically not dominant in the four WFC3/UVIS bands used in CLASH). Up to ten of the brightest galaxies, including the BCG, are fitted. Other objects in this region are masked prior to the fit.
In the specific case of RXC J2248, we only fit the BCG and its three closest satellite galaxies. Residuals were typically less than 0.001 mag, indicating that all 4 of the fitted galaxies are consistent with the concentric elliptical isophote assumption used in this procedure. SNUC, however, does allow the ellipticity and position angle of the isophotes to vary with the semi-major axis.
In Fig. 11 we show the cutout of the central image ID0 of our lensed system for the HST/ACS and HST/WFC3IR images after the subtraction of the BCG and the satellite galaxies.

After removing the BCG, ID0 is clearly detected in all the NIR HST filters, while its detection in the f814w and f850lp filters is difficult to claim, given the high noise fluctuations in this two bands and their low S/N. Despite the fact that the photometry of this object is highly contaminated by the BCG light, we try to estimate the using the photometry extracted from the images after the BCG subtraction. The result from LePhare gives as the best solution for the galaxy SED fit. Due to the noisy photometry, the PDF() is quite broad, but given the good lensing prediction for this image, and also the best value, we are confident that this source is actually the central image of our system. For this image, our best strong lensing model predicts a magnification of . From the lensing model, the magnifications of ID2 and ID3 relative to ID0 are and respectively. These magnifications are in agreement within the uncertainties with the mean ratios of the observed fluxes in the NIR filters (from f105w to f160w), which are and .
7 Physical properties
In this section we estimate some physical properties of the high- galaxy quintuply lensed in the field of RXC J2248.
As noted in the previous sections, the images ID2 and ID3 are the ones with the best photometry, which do not suffer any contamination by nearby sources, so we focus on these images to estimate physical properties based on photometry.
In Sec. 5, we estimate the magnification for ID2 and ID3 to be and . From the best LePhare galaxy SED fit, we extract the UV absolute magnitude for these images, and after correcting for the magnification, we get delensed absolute UV magnitudes of and respectively for ID2 and ID3.
Comparing these values with the luminosity function at redshift z=6 as estimated in Bouwens et al. (2012), our candidates have .
In order to derive the physical properties of the system ID2&3 we perform a fit of model SEDs to the colours of ID2&3 with the SED-fitting routine SEDfit (Drory, Bender & Hopp, 2004). It performs a fit of model SEDs to the observed photometry, concurrently allowing reddening by dust following the law of Calzetti et al. (2000). As basis for the template set for the fitting we use the single stellar population (SSP) model SEDs of Bruzual & Charlot (2003, hereafter BC03) with a Chabrier IMF (Chabrier, 2003) and Padova 1994 evolutionary tracks. From these we create composite stellar populations (CSPs) with the software galaxev 777http://www.cida.ve/~bruzual/bc2003 or http://www.iap.fr/~charlot/bc2003. The star formation history (SFH) of galaxies is commonly described by a so-called ’ model’ that follows:
| (6) |
where denotes the star formation rate, and the (positive) -folding timescale.
is the time that has elapsed since the start of star formation, i.e., the age of the galaxy.
This function describes well the SFHs of local galaxies, but likely does not hold for (e.g., Maraston et al., 2010; Lilly et al., 2013).
In fact, Maraston et al. (2010) showed that fitting model SEDs with exponentially decreasing SFRs to star-forming galaxies at yields unrealistic young ages because the galaxy spectrum is then dominated by the young stellar population.
Moreover, they showed that models with negative lead to more physical results.
Here we create CSPs for models with both positive and negative (and therefore decreasing and increasing SFR), as these should set lower and upper limits to the SFR of the investigated galaxy.
We generate CSPs with metallicities of , , , , , and -folding timescales of , , , , , , , and for the model.
The created CSPs were extracted at different ages evenly distributed in logarithmic space between and .
Additionally to the CSPs, we extract SSPs with the same metallicities and ages.
We set the redshift of the system ID1-4 to .
For model ages that are higher than the age of the universe at redshift the SED fitting code will assign probabilities of zero.
The extinction is allowed to take values between and with steps of .
We perform the SED fitting for model sets containing the SSPs and CSPs with increasing and decreasing SFH separately, and afterwards with all models combined.
The results are summarised in Tab. 5.
Using the SSPs models, the best fits yield subsolar metallicities (0.2 and for ID2 and ID3 respectively) and very young ages (0.1 and 1.5 Myr for ID2 and ID3 respectively).
The results when using the CSPs with increasing and decreasing SFR are similar to one another.
The best fits yield the same values for the metallicities (0.2 and ) and comparable small ages ( and ).
In summary, for the three different model sets (SSPs, and CSPs with ) the results for metallicities, extinctions, and ages are essentially the same (except for the age of ID2, which is for the CSPs, and for the SSPs).
Actually this is what we would expect given the small ages resulting from the best fits.
Within these short timescales () the galaxies could not evolve significantly which is why the stellar populations (and therefore SEDs) of the CSPs are very similar to one another and also to the SSPs.
When including all models (CSPs and SSPs) in the SED fitting, we get that ID2 is better fitted by a CSP model with increasing SFR, while an SSP model is preferred for ID3.
In any case, the differences in the stellar populations are, as mentioned above, not very high at these young ages which is why the results for ID2&3 are in good agreement.
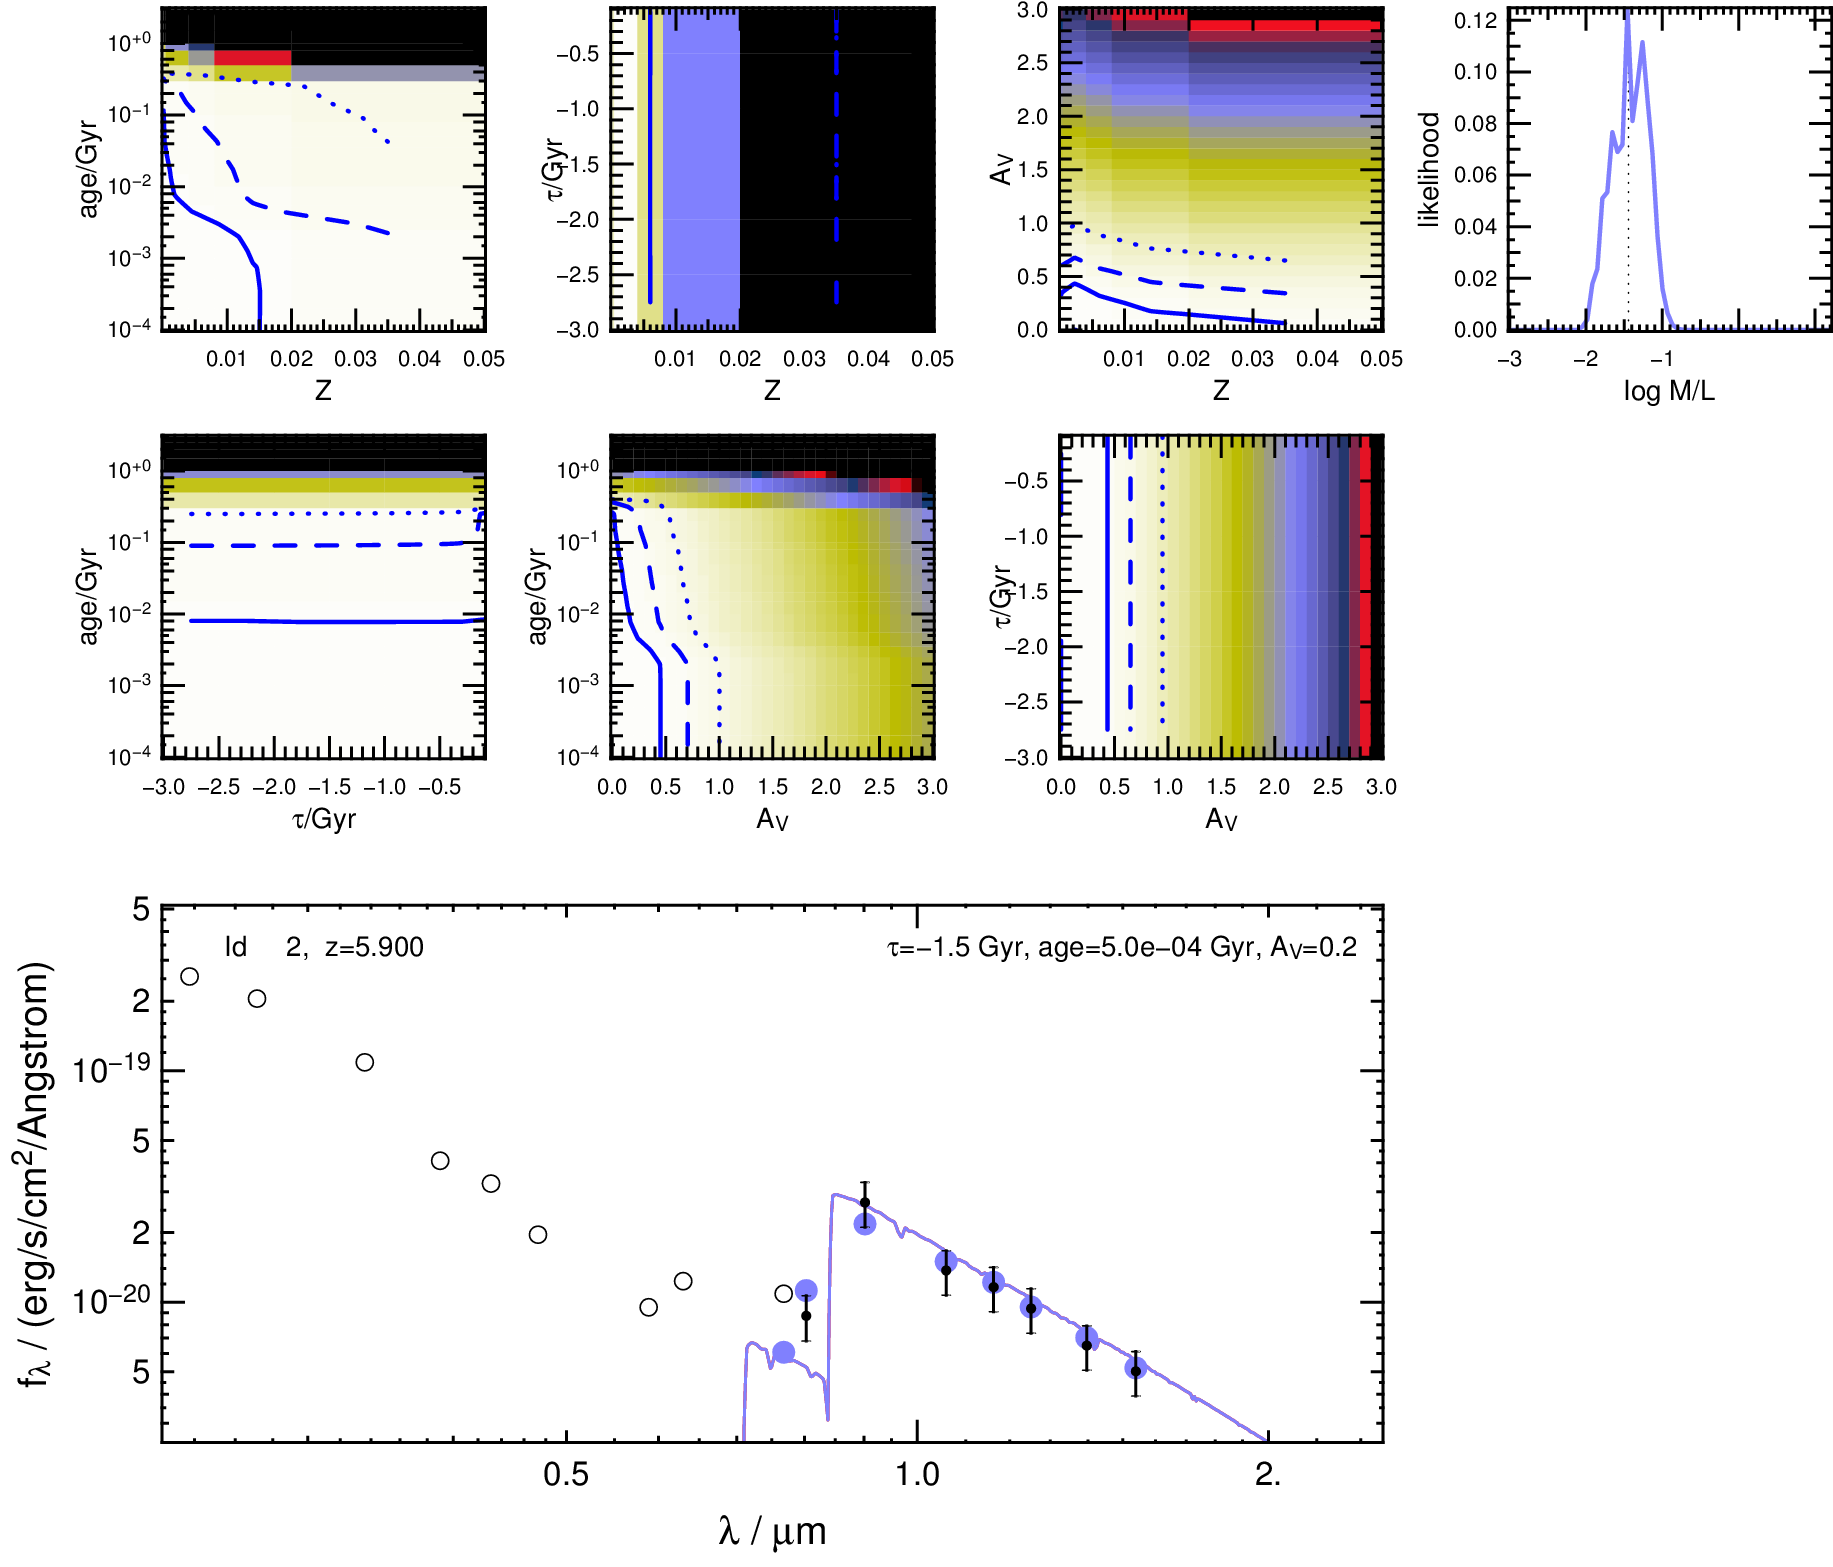
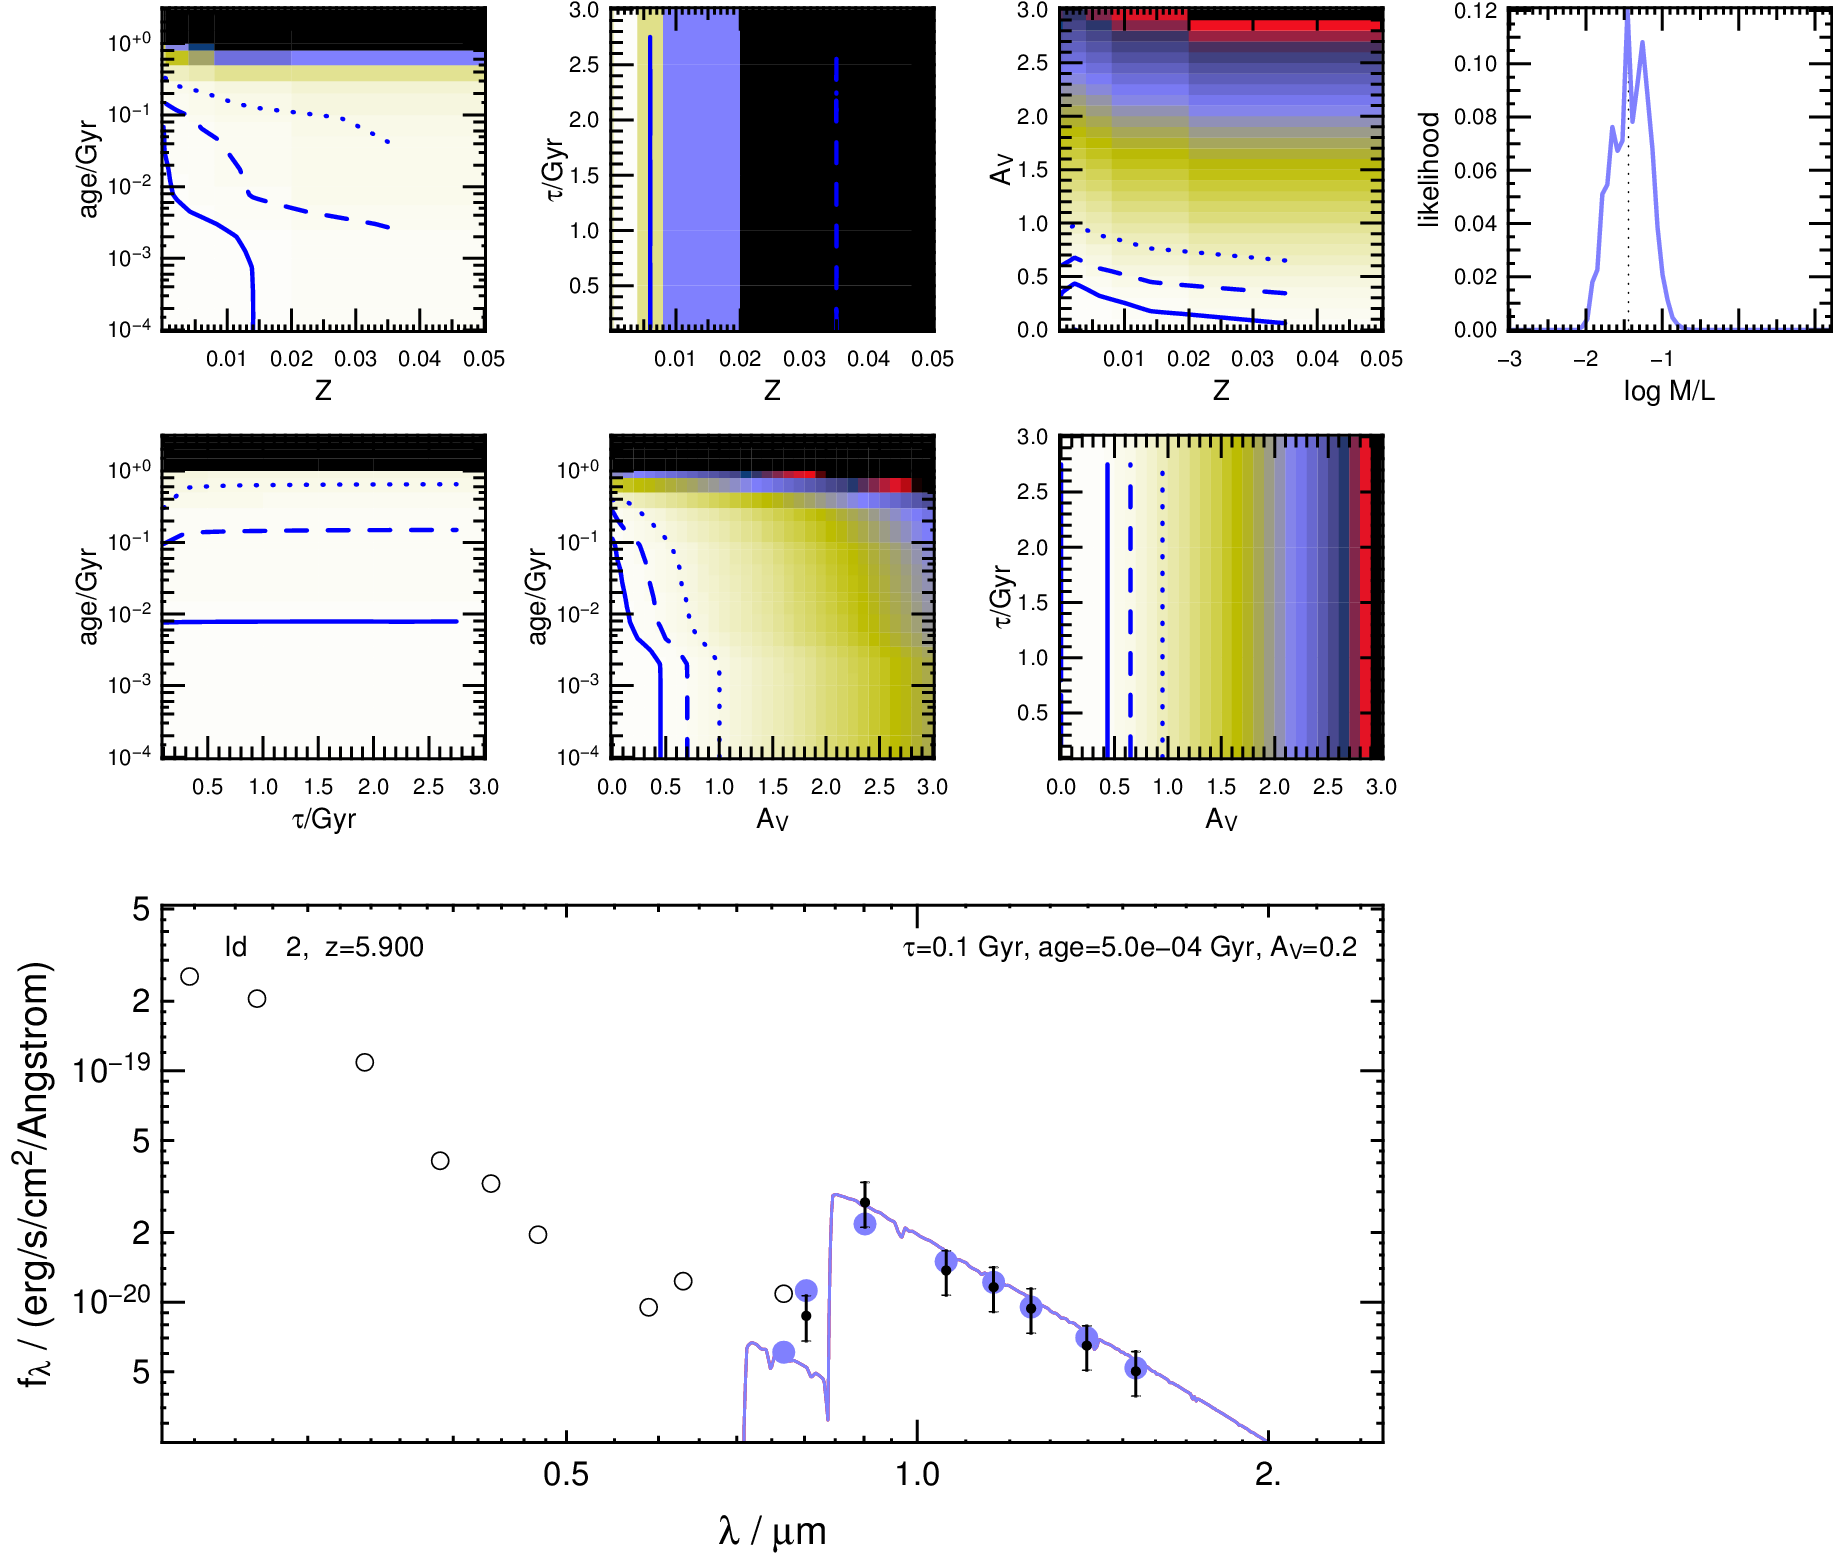
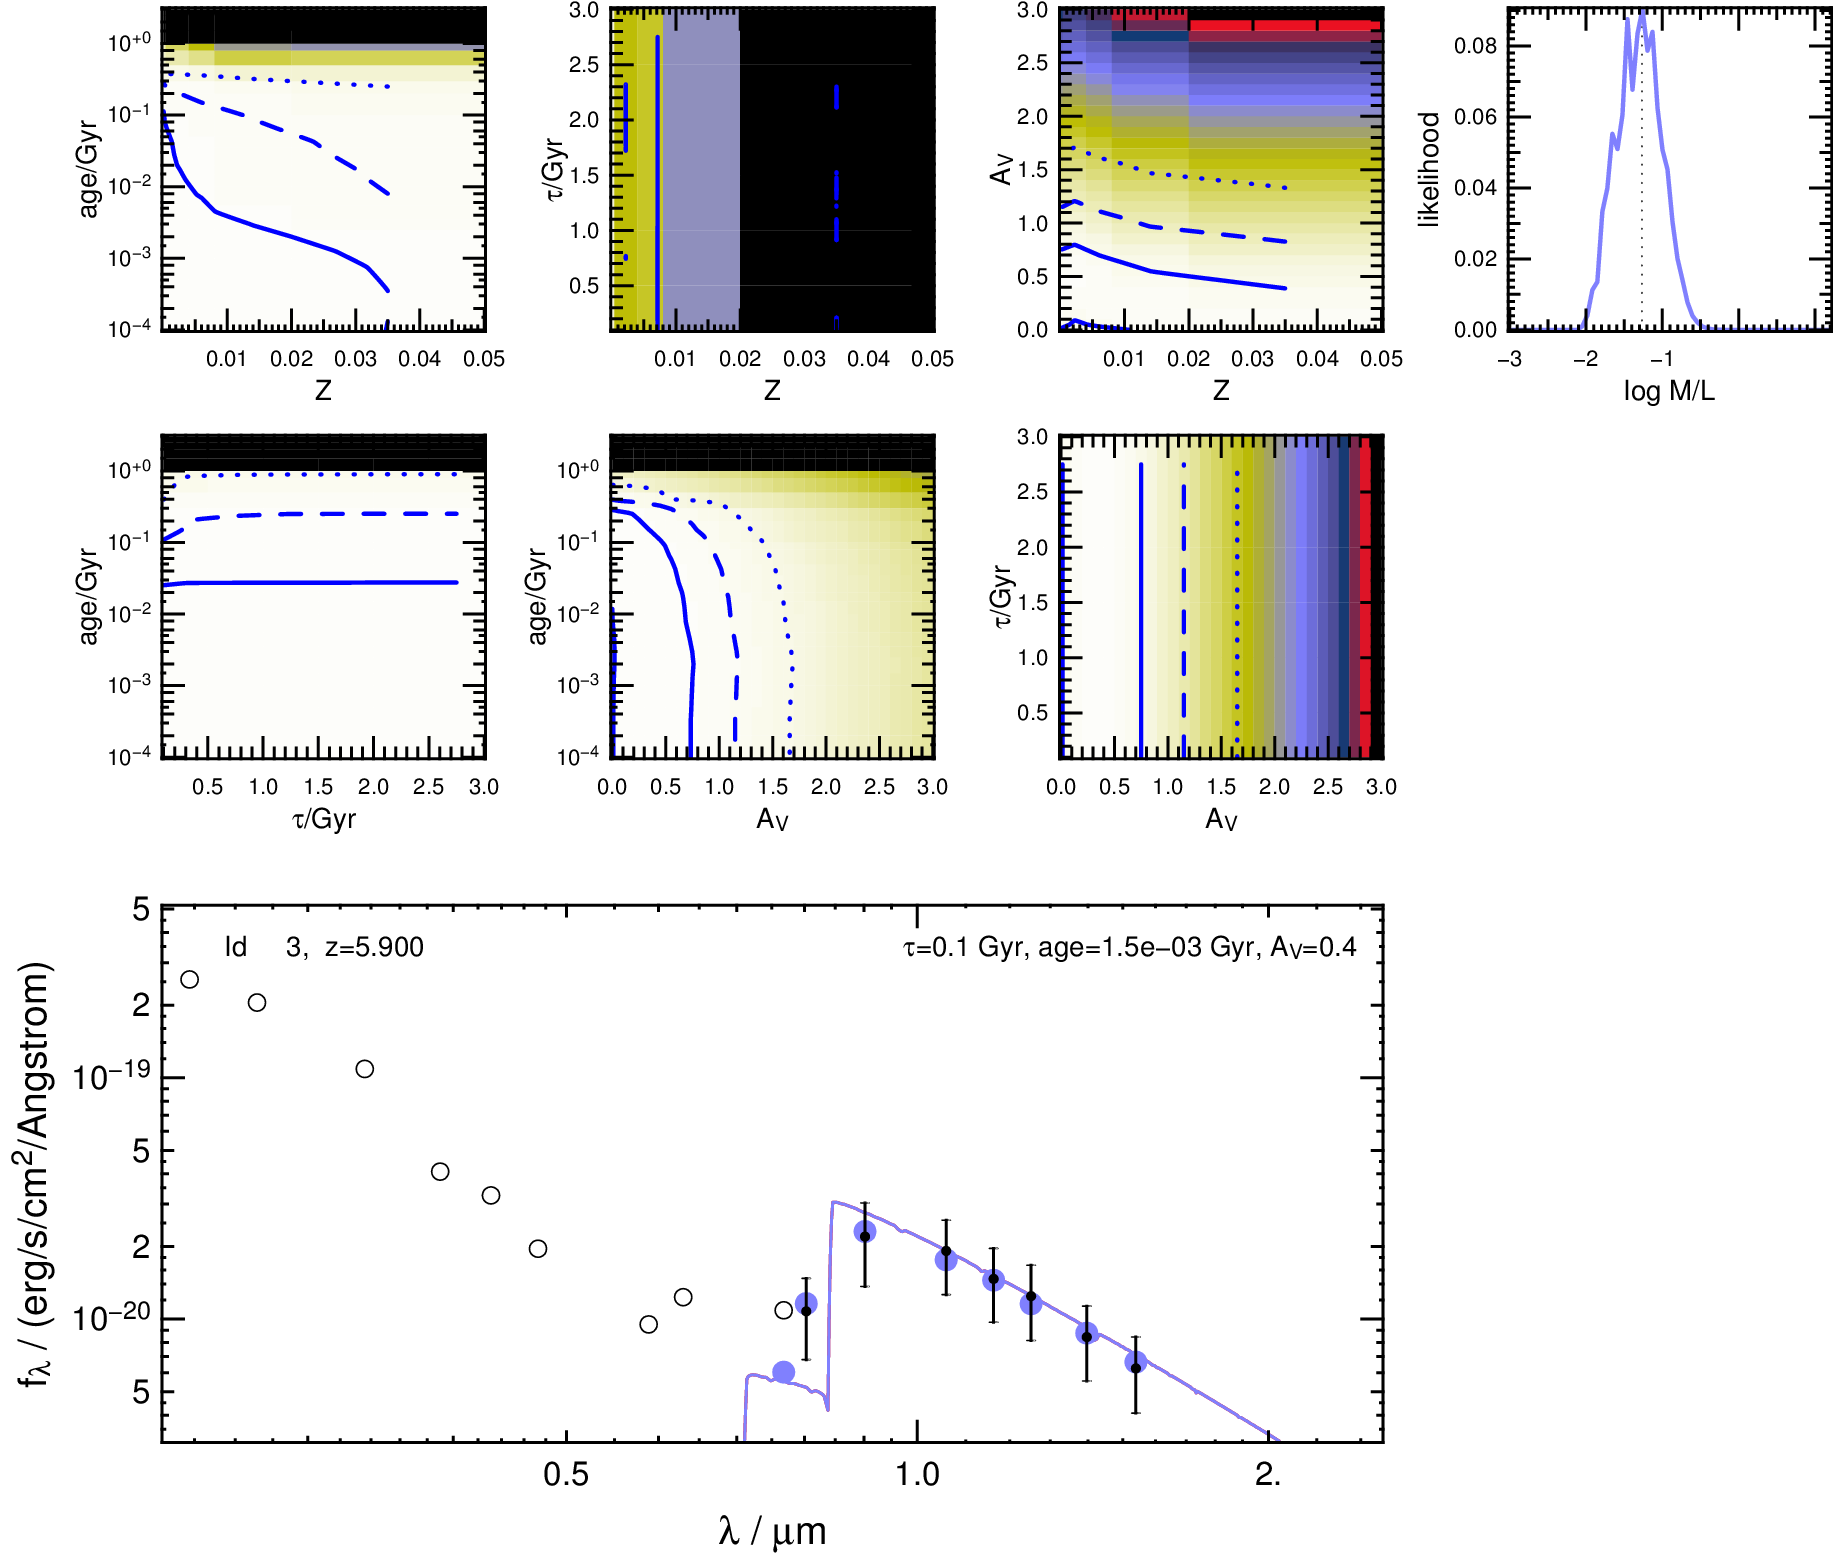
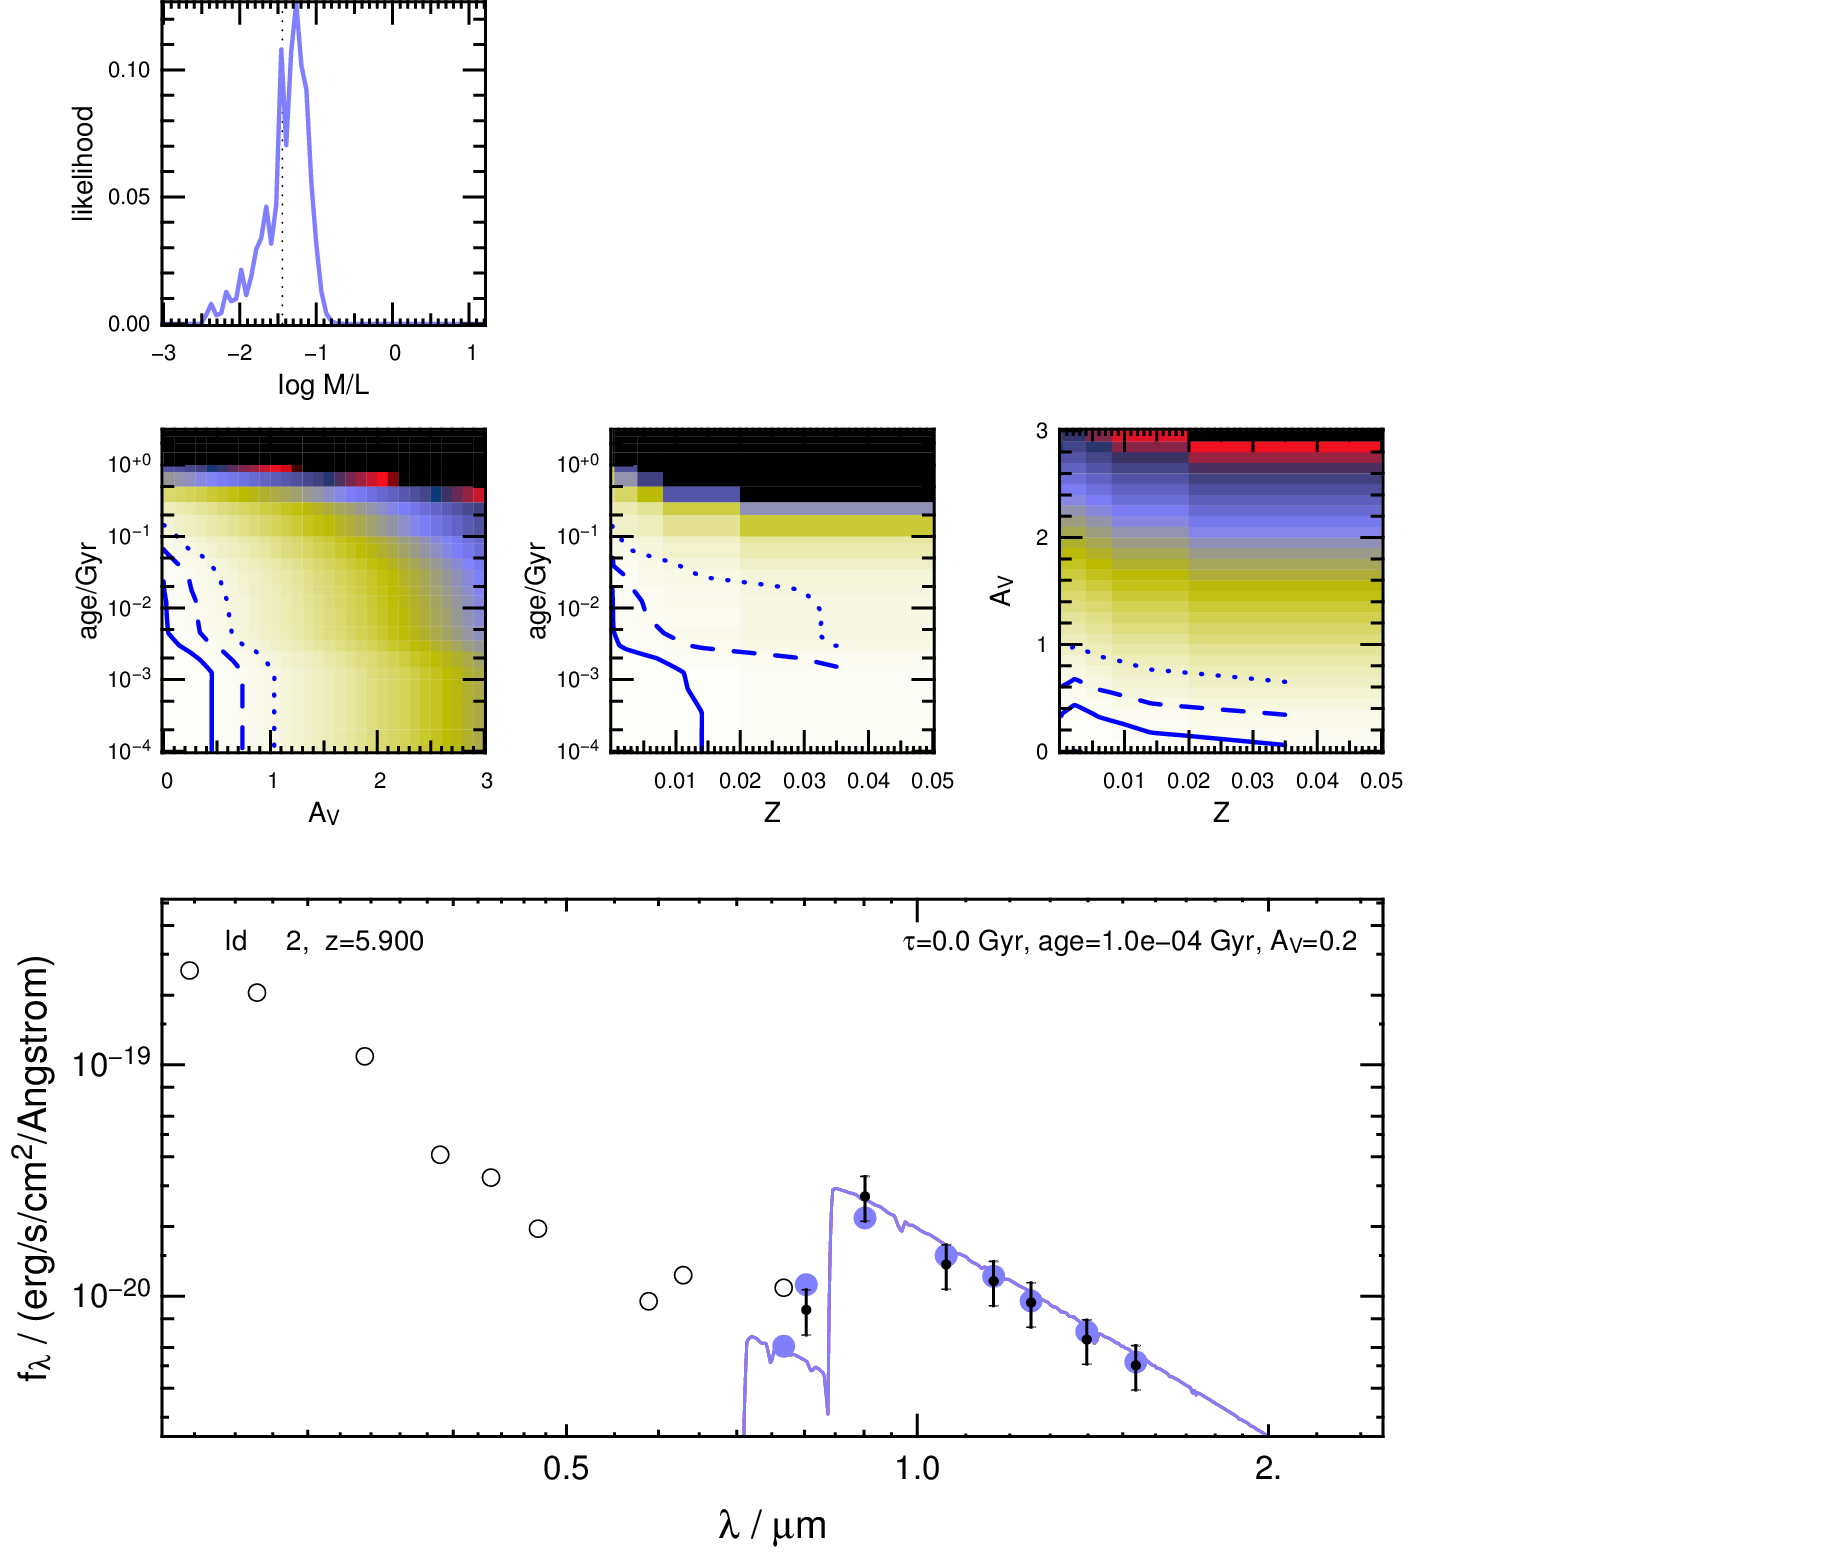
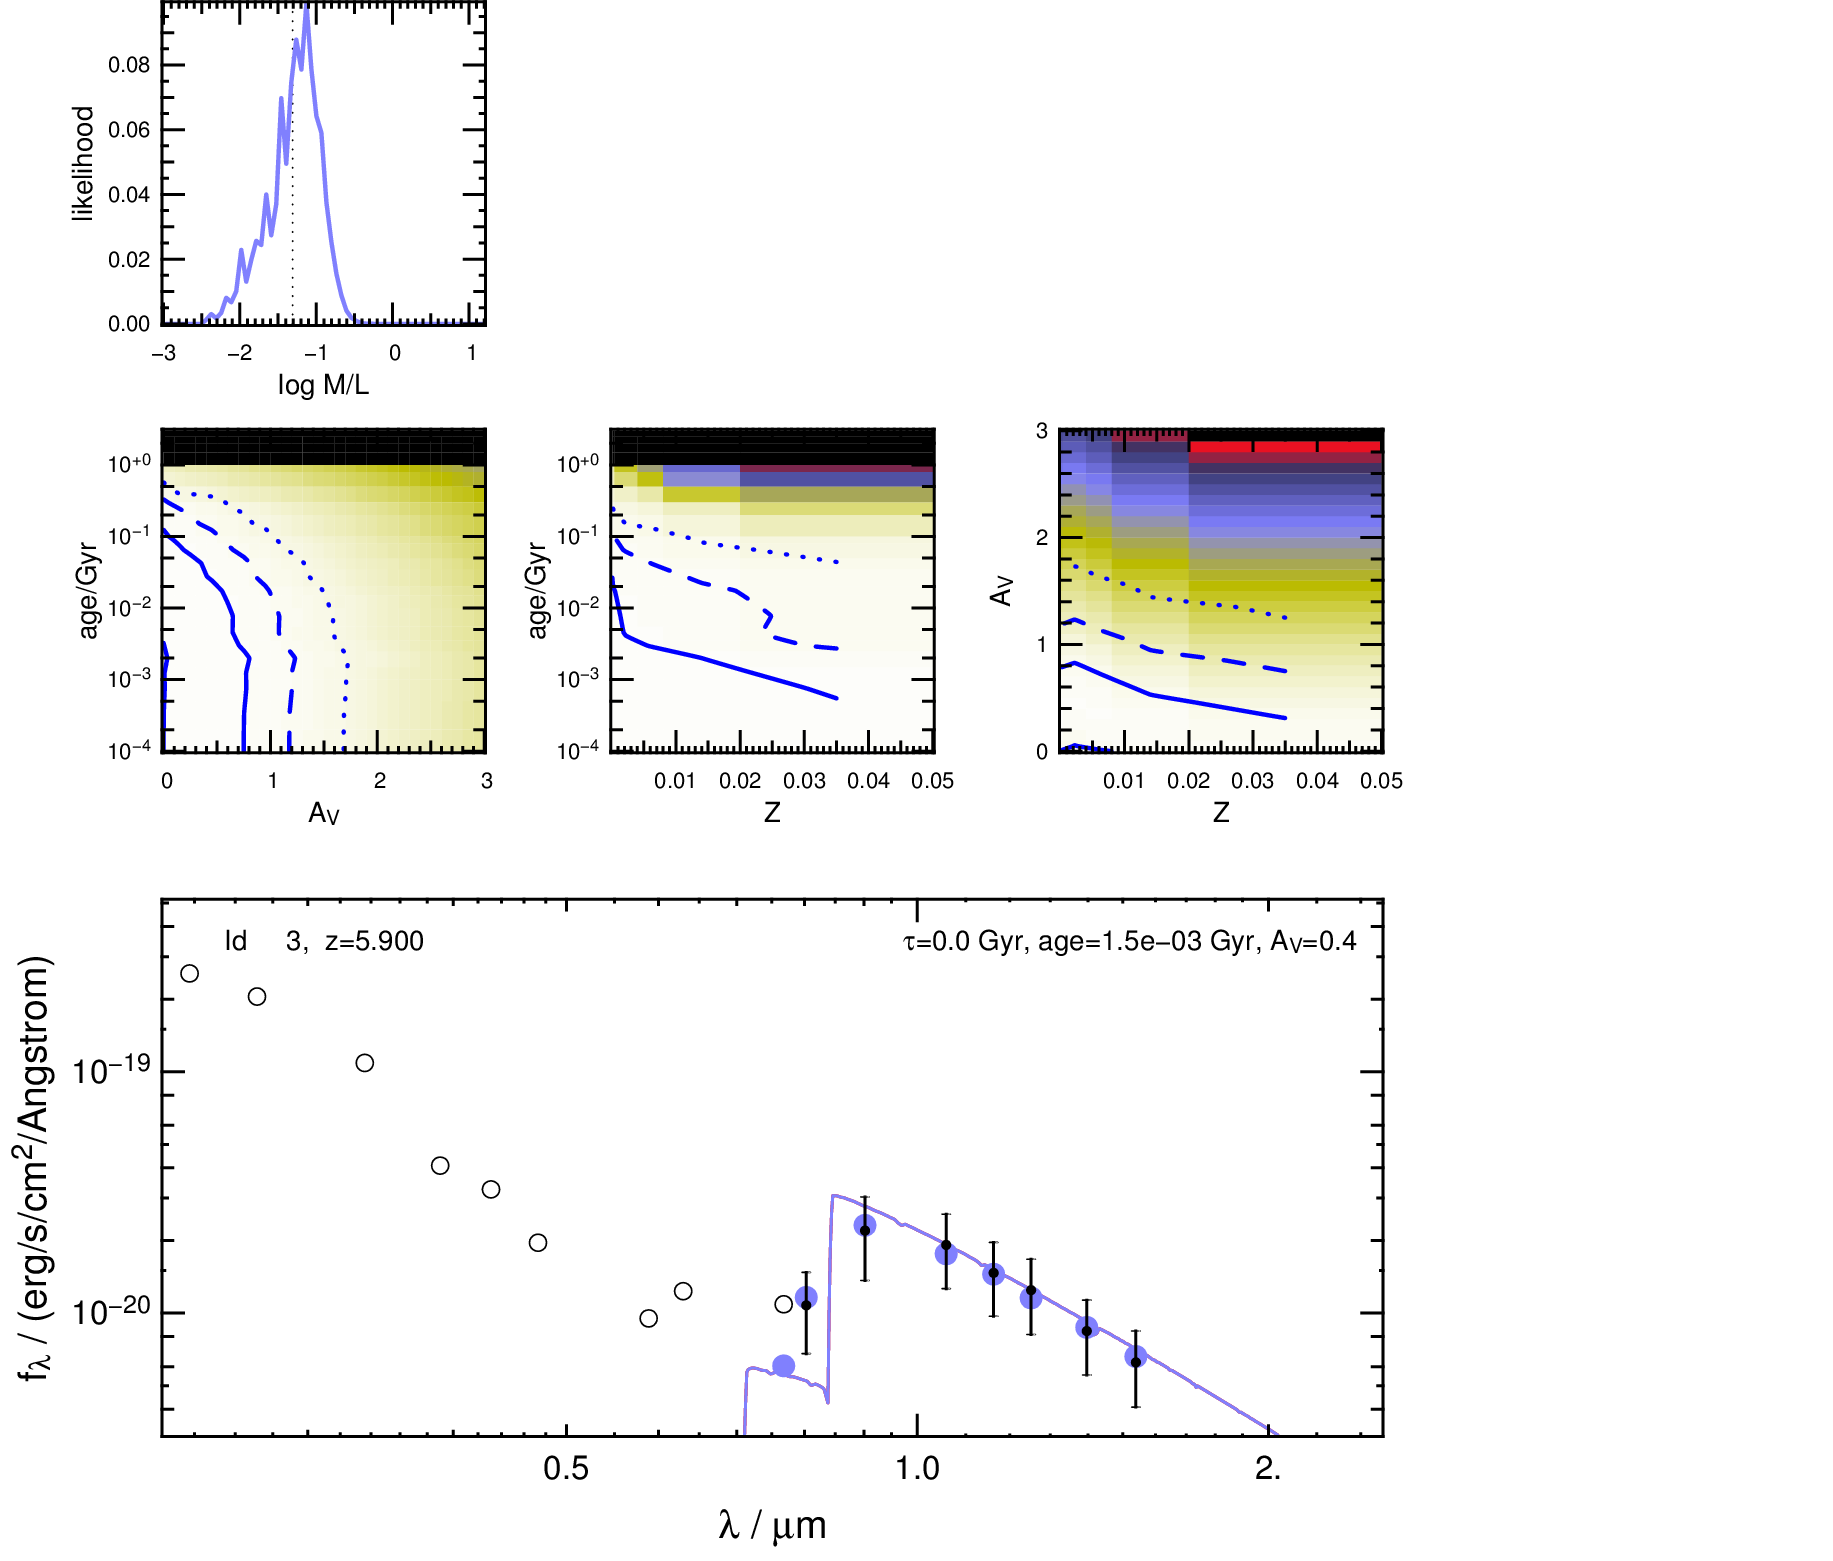
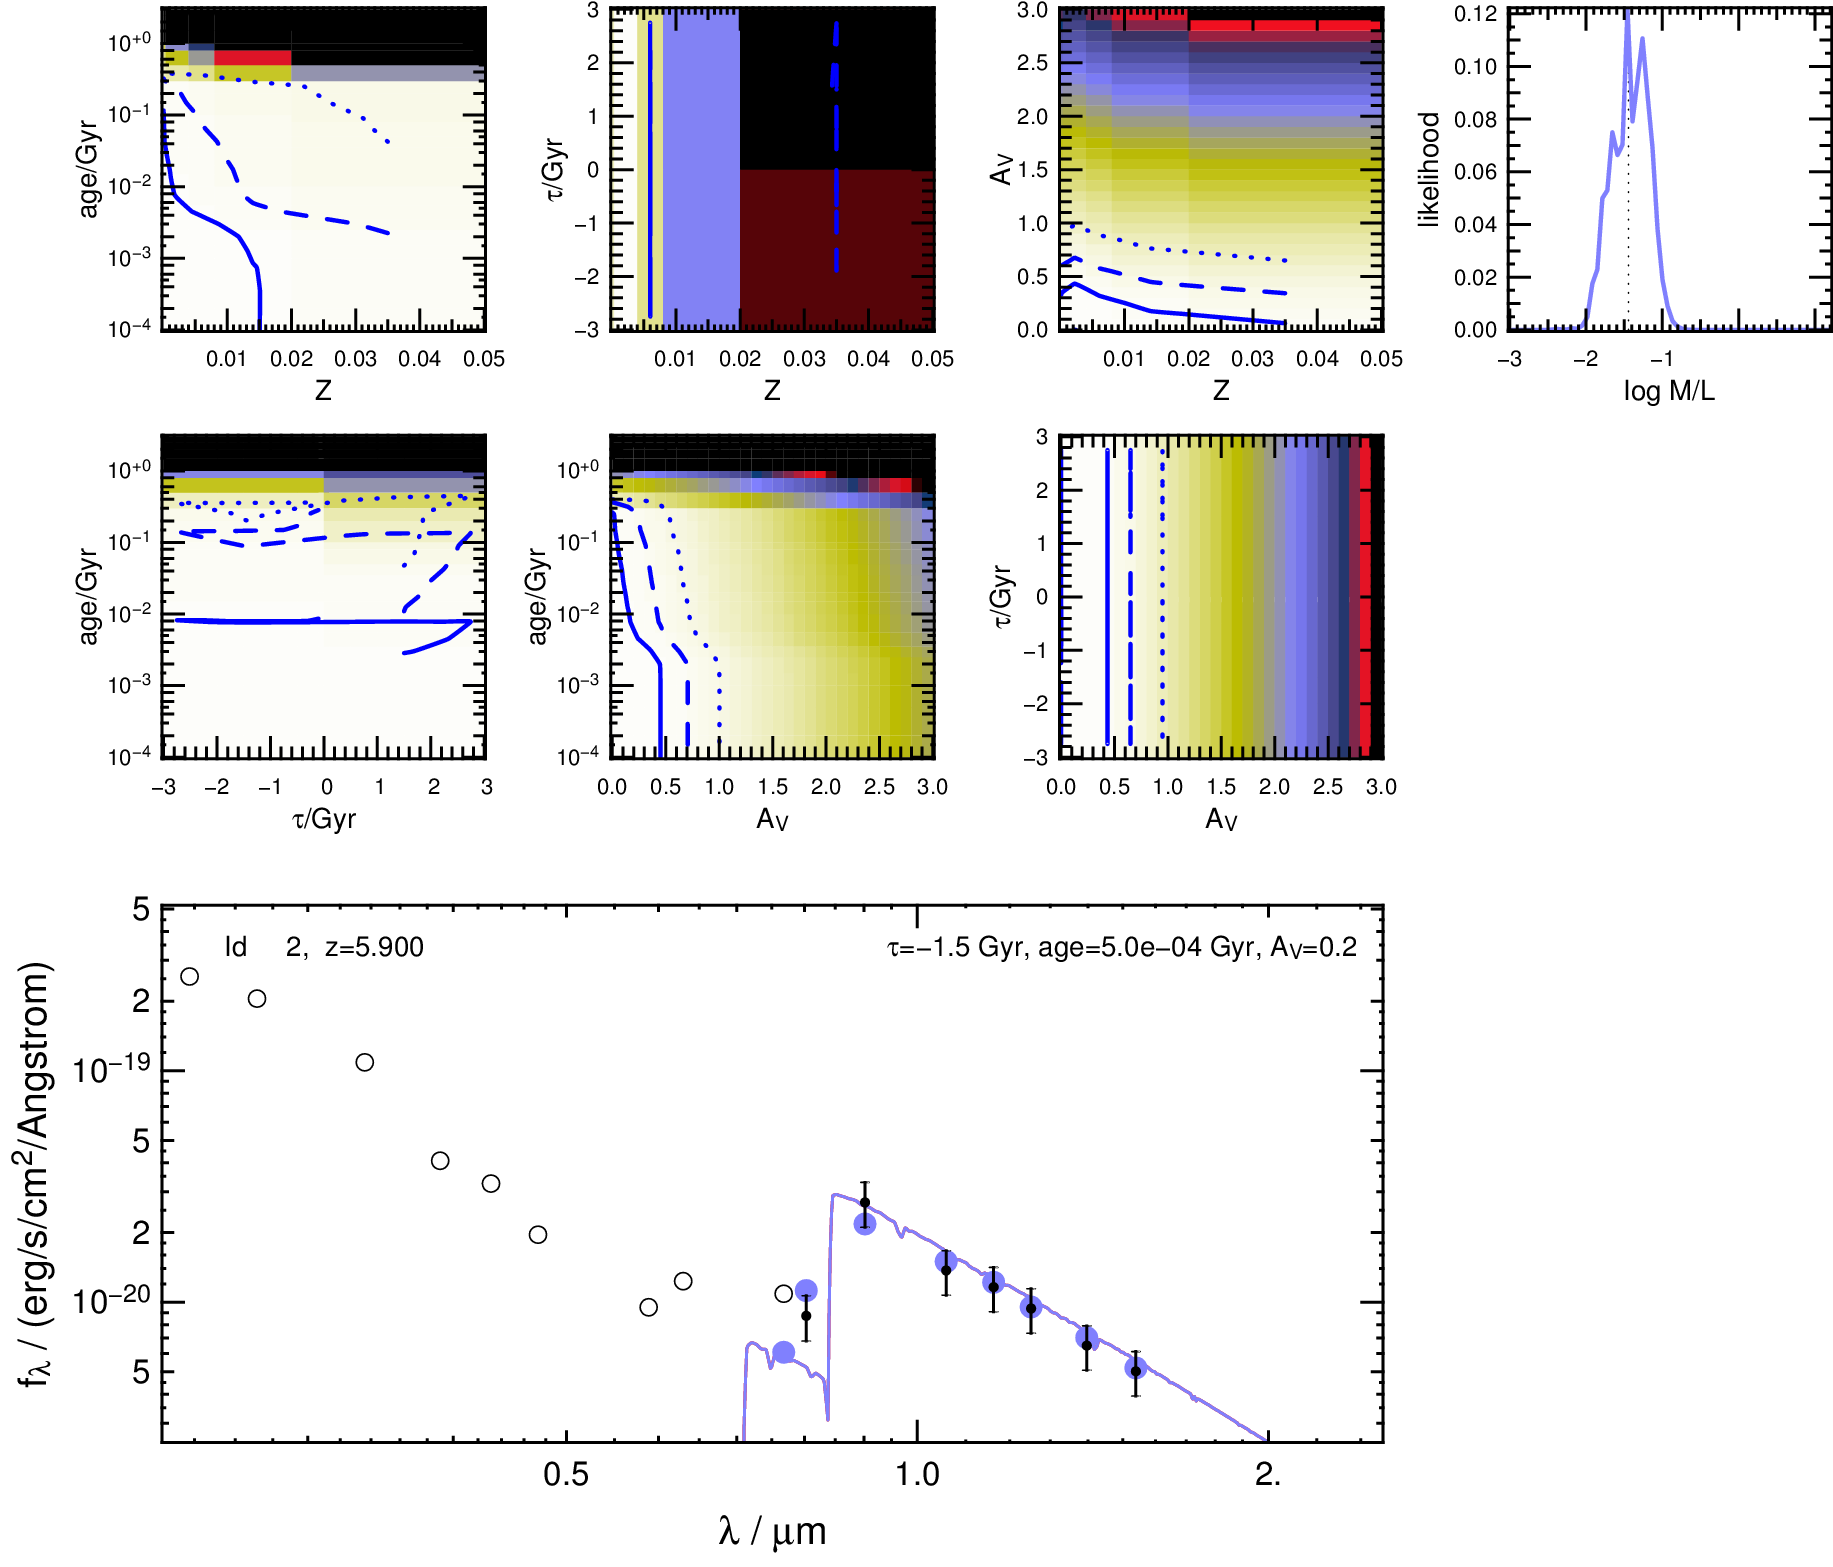
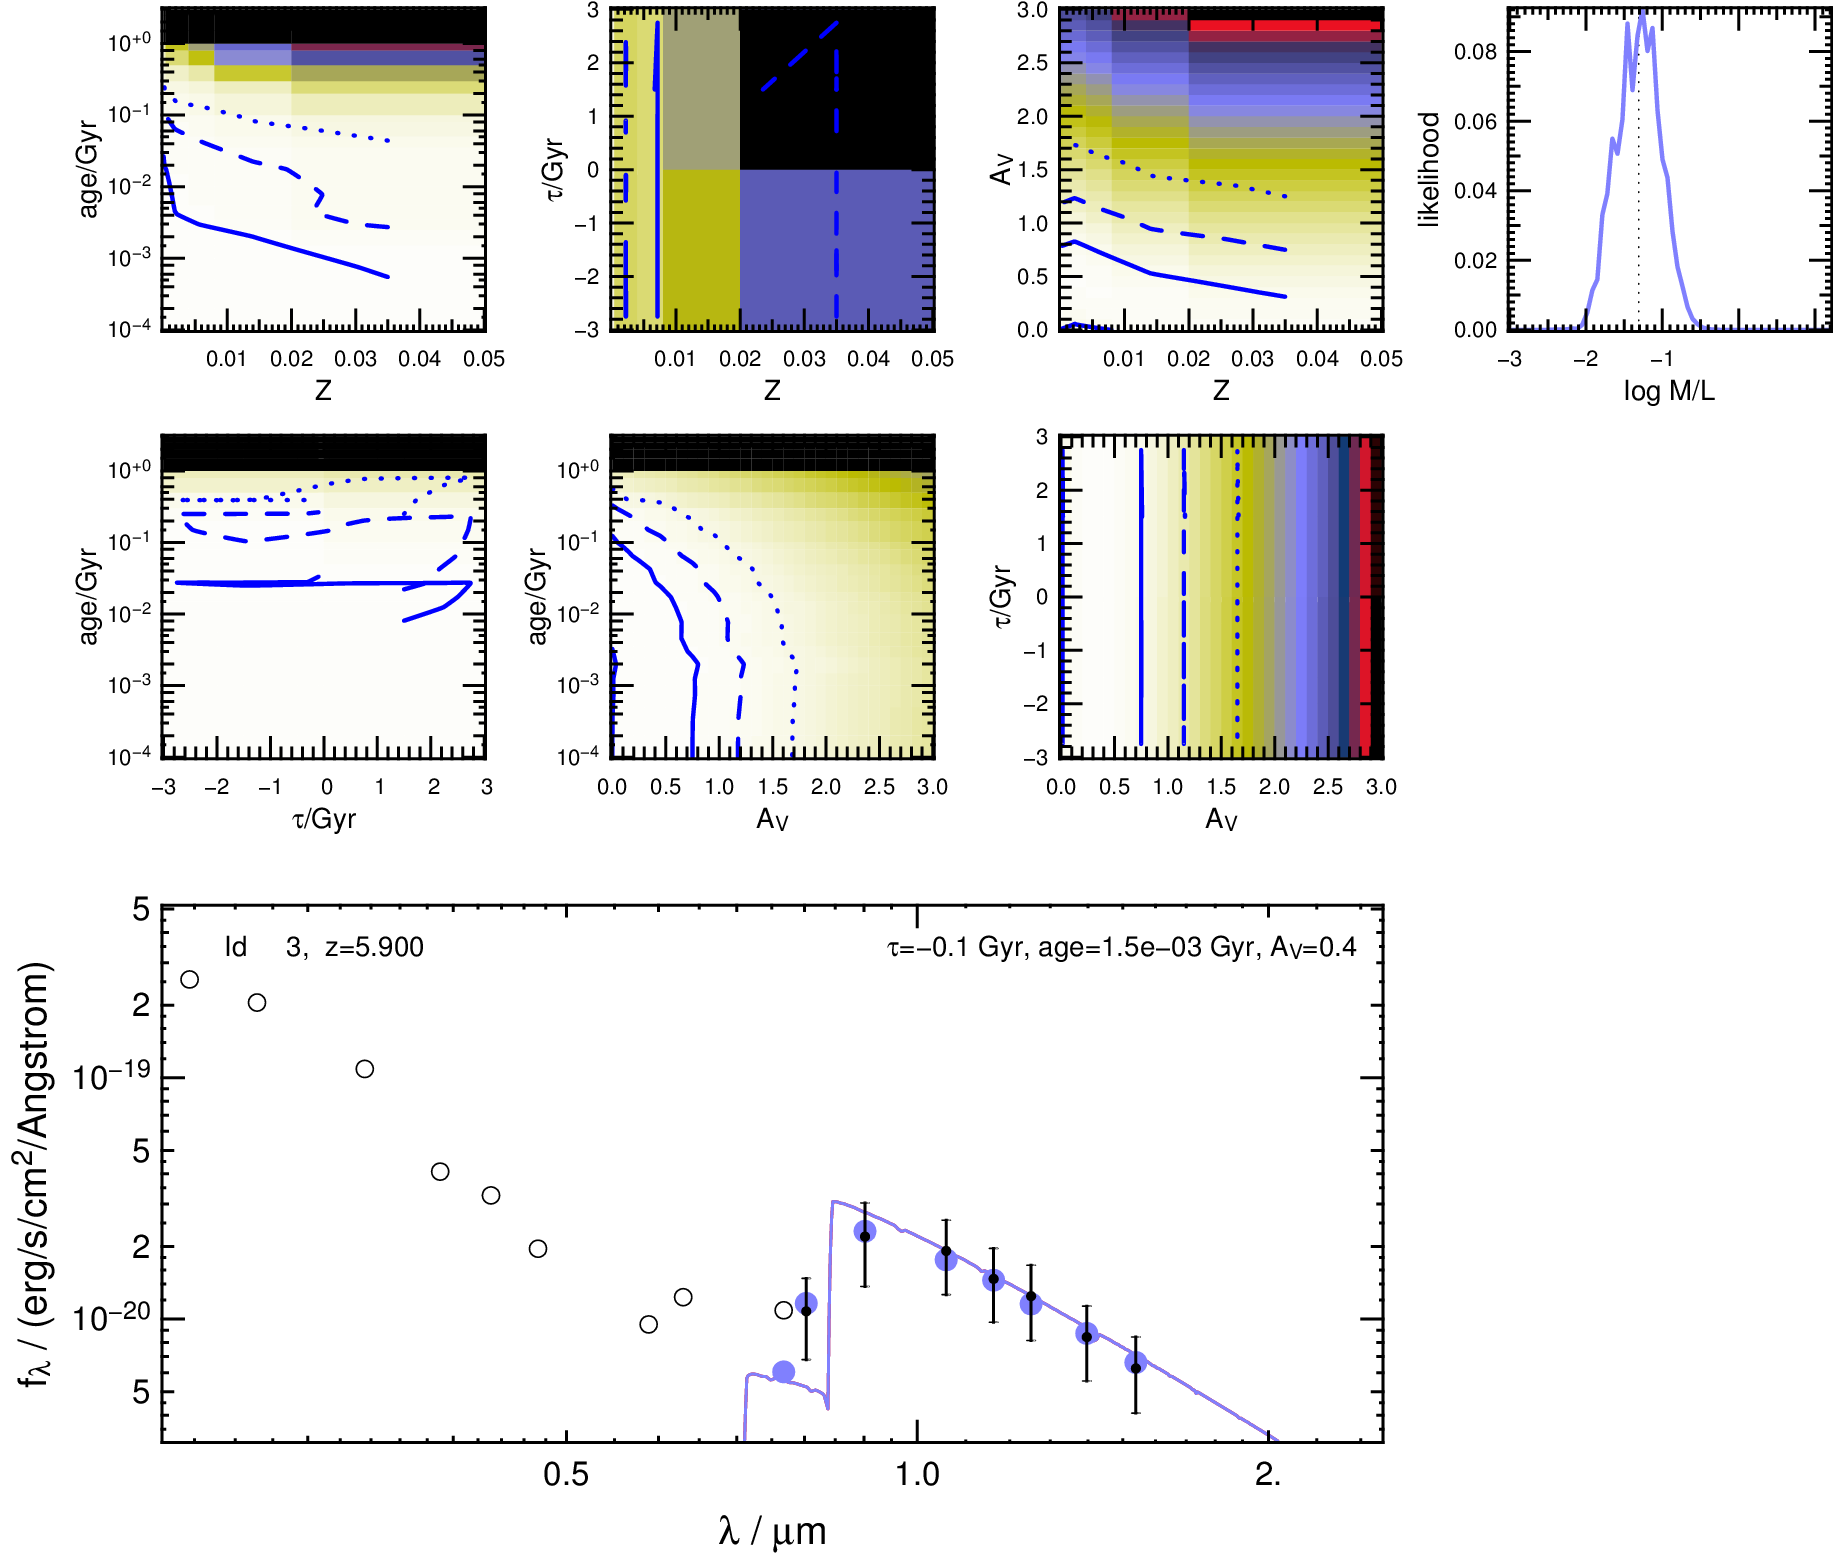
All the results are shown in greater detail in App. A, Figs. 14 to 17, where we plot the best fitting SEDs and the likelihood distributions in parameter space, as well as in Figs. 19 to 21, which display the PDFs of the model ages.
Through interpolation of the age PDF, we calculate that ID2&3 have ages within the interval of [0.1,330] Myr (centred on the PDF) at a () confidence.
The same was done for the masses, which we estimate to be within at the same level of confidence.
The best fitting masses and the age and mass intervals are also summarised in Table 5.
The values of all fitting results lie between 10 and 12.7 and differ only marginally when the underlying model set is changed.
We furthermore estimate the UV slope (Tab. 5) of the best fitting SED of each run by a linear fit of versus within Å (see Calzetti, Kinney & Storchi-Bergmann, 1994), getting results which are in total agreement with estimated using the observed NIR colours in Sec. 4.
We also combine the likelihoods from the SED fits of the two candidates, and the results for masses and ages are same as the previous ones.
Moreover, we repeat the SED fits with SSP and CPS, using this time the combined photometry of the two lensed images ID2&3, and the SED fits lead to same constraints on masses and ages.
| ID | / Gyr | age [age] / Myr | / | |||
| SSPs | ||||||
| ID2 | SSP | 0.2 | 0.1 [0.1,45] | 0.093 [0.17,0.28] | 0.2 | |
| ID3 | SSP | 0.005 | 1.5 [0.1,111] | 0.21 [0.034,0.79] | 0.4 | |
| model CSPs | ||||||
| ID2 | -1.5 | 0.2 | 0.5 [0.1,274] | 0.093 [0.034,0.25] | 0.2 | |
| ID3 | -0.1 | 0.005 | 1.5 [0.1,301] | 0.23 [0.059,0.71] | 0.4 | |
| model CSPs | ||||||
| ID2 | 0.1 | 0.2 | 0.5 [0.1,291] | 0.093 [0.034,0.27] | 0.2 | |
| ID3 | 0.1 | 0.005 | 1.5 [0.1,383] | 0.23 [0.059,0.78] | 0.4 | |
| all combined | ||||||
| ID2 | -1.5 | 0.2 | 0.5 [0.1,270] | 0.093 [0.033,0.26] | 0.2 | |
| ID3 | SSP | 0.005 | 1.5 [0.1,330] | 0.21 [0.058,0.75] | 0.4 | |
Finally we investigate whether the inclusion of the additional information from the shallow IRAC data affects our results. We repeat the previous SED fitting but include the upper limits estimated in the 3.6 m and 4.5 m filters in the photometry. In this step we only focus on ID3, since the ID2 IRAC photometry is significantly contaminated by the near cluster members.
The best fitting SSP model has an age of 1.5 Myr within the interval of [0.1,30] Myr and mass of within [0.4,5.2]. For the increasing and decreasing SFH we get respectively Gyr and Gyr, ages of 2.5 Myr within [0.1,222] Myr and 2.5 Myr within [0.1,212] Myr, and masses of within [0.6,4.7]. In these cases, the best fitting models require a higher then the previous results, in which we get . However, in the appendix (Figs. 14 and 15 for increasing and decreasing SFH models) we show that the probability distributions of are very flat, so that slight changes in the input photometry can change the best fitting values for very easily.
Finally, when combining all the models, the best fit is provided by the SSP model with age of 1.5 Myr within [0.1,211] Myr, and best mass of within [0.6,4.8]. The metallicities and the dust contents of all the cases remain the same as in the previous results. Thus the inclusion of IRAC upper limits for ID3 leads to best fitting parameters which are in agreement with the previous ones for all the cases, and to slightly smaller intervals for the age and mass.
To robustly compare our results with the literature, we perform the same fitting procedure (using CSPs and SSPs models) on other known lensed sources selected in the field of the CLASH clusters (i.e., Richard et al., 2011; Zitrin et al., 2012; Bradley et al., 2013), for which we have the same photometry as for our candidate.
The SED fitting performed in our work uses similar model parameters as Zitrin et al. (2012, hereafter Z12).
The main difference is in the lowest model ages, which is in our work and in Z12.
For the quadruply lensed galaxy in the field of MACS0329, we get results that are consistent with Z12, for a low mass () young galaxy. Our best age (300 Myr) is slightly higher, but still consistent within the confidence level.
Richard et al. (2011, hereafter R11), unlike us, adopt in their SED fitting models a Sapleter IMF and smaller ranges for the metallicity ( within ) and ages (within 10 Myr and 1 Gyr).
Our best age is much younger than the age range predicted in R11, although our confidence level age interval of Myr covers the age range of [640,940] Myr given in R11.
As a consequence, also the stellar mass is found to be quite different, given that our best value is much smaller than the mass estimated by R11 ( although they are anyhow consistent within our confidence level mass interval).
In table 6 we summarise our results for these two lensed systems, and provide the physical properties estimated in the reference works.
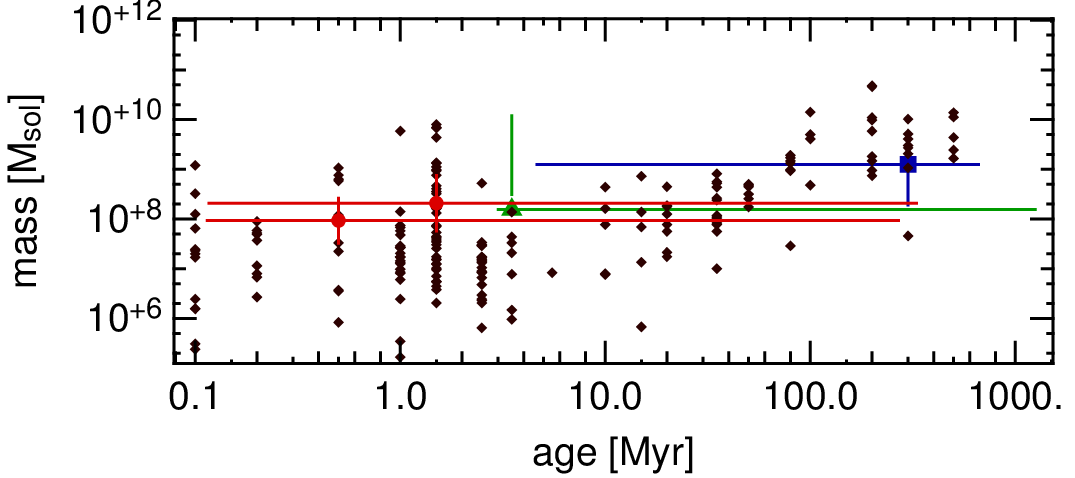
We also perform the SED fitting for the 208 galaxy candidates at from Bradley et al. (2013, hereafter B13).
We plot in Fig. 12 the best fitting ages versus masses for these candidates, together with the results we get for our system, R11 and Z12. Our candidates have age and mass similar to many young candidates from B13. In Fig.13 we show the histograms for best age, with the lower- and upper- age limits, for B13 and our candidates. Although the large confidence level intervals, we see that our multiple lensed system is definitely among the young sample of galaxies. Moreover we also estimate the UV slope from the best SED fitting templates for all the sources and we get that our candidate belongs to the sample of galaxies with very steep UV slope ().
Moreover, although the large confidence level intervals on the ages, our SED fitting suggest a very young best age for our system, compared to the other multiply lensed galaxies (Z12 and R11), while the Z12 and R11 have confirmed older ages, in agreements with the results from literature.
| ID | / Gyr | age [age] / Myr | Reference | ||||
|---|---|---|---|---|---|---|---|
| MACS0329 | 0.1 | 0.005 | 300 [4.7,700] | 1.3 [0.2,1.5] | 0.0 | this work | |
| – | 0.5 | 180 | 1 | – | Z12 | ||
| A383 | SSP | 0.005 | 3.5 | 0.2 [0.3,11.4] | 0.8 | this work | |
| 0.5 | – | [640,940] | – | R11 |

8 Summary and Conclusions
We report the discovery of a young quintuply lensed galaxy candidate at z in the field of the galaxy cluster RXC J2248 ().
We identify this system as four i-dropouts, plus a central lensed image which we detect once we remove the BCG from the dataset images.
The lensed images have colours consistent within the errors, which are in agreement with the colour prediction for starbust galaxies at . Moreover, they have photometric redshift of , with a well defined peak in the PDF(z) and no photo-z solution at low-z.
We perform the strong lensing analysis of the cluster, using 11 systems of multiple images as constraints, and we find that our model predicts the multiple lensed system with an accuracy of .
The magnifications predicted for the lensed images are between 2.2 and 8.3.
Referring to the two images with the best photometry, we estimate the delensed UV luminosity to be at . From the observed NIR colours, we estimate the UV slope of our source to be .
We perform a SED fitting of the observed photometry, using SSPs and CSPs SED templates, and derive that our candidate has subsolar metallicity (), low dust content , stellar mass M and best age of . Although the age is not well constrained, we can set an upper limit of , given the uncertainties that we get. We verify that including the shallow IRAC photometric upper limits in the SED fitting leads to similar results, with slightly smaller intervals on the mass and age.
We finally compare our predicted ages and masses, with the candidates selected up to date in the field of all CLASH clusters, and we find that our multiply lensed galaxy has a young age and low mass, similar to some of the objects from B13. However, compared to the other known multiply lensed galaxies, our SED fitting suggests a younger age for our multiple lensed system. This source adds to the several multiple lensed objects known at high- , characterized for being five times lensed, with a central image identified in the very inner region of the lensing cluster.
After the submission of the paper to the journal, three multiple images of this system (ID2,3,4) have been spectroscopically confirmed at z=6.11 by Balestra et al. 2013 in a dedicated VIMOS Large Programme to follow-up CLASH high-z objects. An independent redshift measurement with VLT/FORS2 is also reported in Boone et al. 2013, who initially associated this system with a bright sub-mm LABOCA source. Such an association is not supported by the spectroscopic properties described in Balestra et al. 2013 and the hard UV slope reported in this paper.
Acknowledgements
This work is supported by the Transregional Collaborative Research Centre TRR 33 - The Dark Universe and the DFG cluster of excellence “Origin and Structure of the Universe”. The CLASH Multi-Cycle Treasury Program (GO-12065) is based on observations made with the NASA/ESA Hubble Space Telescope. The Space Telescope Science Institute is operated by the Association of Universities for Research in Astronomy, Inc. under NASA contract NAS 5-26555. The Dark Cosmology Centre is funded by the DNRF. Support for AZ is provided by NASA through Hubble Fellowship grant HST-HF-51334.01-A awarded by STScI. He was also partly supported by contract research “Internationale Spitzenforschung II/2-6” of the Baden Württemberg Stiftung.
References
- Arnouts et al. (1999) Arnouts S., Cristiani S., Moscardini L., Matarrese S., Lucchin F., Fontana A., Giallongo E., 1999, Mon. Not. Roy. Astron. Soc., 310, 540
- Balestra et al. (2013) Balestra I. et al., 2013, A&A, 559, L9
- Benítez (2000) Benítez N., 2000, ApJ, 536, 571
- Bertin & Arnouts (1996) Bertin E., Arnouts S., 1996, A&AS, 117, 393
- Boone et al. (2013) Boone F. et al., 2013, A&A, 559, L1
- Bouwens et al. (2004) Bouwens R. J., Illingworth G. D., Blakeslee J. P., Broadhurst T. J., Franx M., 2004, ApJ, 611, L1
- Bouwens et al. (2012) Bouwens R. J. et al., 2012, ApJ, 754, 83
- Bouwens et al. (2013) Bouwens R. J. et al., 2013, ArXiv e-prints
- Bradley et al. (2012) Bradley L. D. et al., 2012, ApJ, 747, 3
- Bradley et al. (2013) Bradley L. D. et al., 2013, ArXiv e-prints, 1308.1692
- Brainerd, Blandford & Smail (1996) Brainerd T. G., Blandford R. D., Smail I., 1996, ApJ, 466, 623
- Brimioulle et al. (2013) Brimioulle F., Seitz S., Lerchster M., Bender R., Snigula J., 2013, Mon. Not. Roy. Astron. Soc., 432, 1046
- Bruzual & Charlot (2003) Bruzual G., Charlot S., 2003, Mon. Not. Roy. Astron. Soc., 344, 1000
- Calzetti et al. (2000) Calzetti D., Armus L., Bohlin R. C., Kinney A. L., Koornneef J., Storchi-Bergmann T., 2000, ApJ, 533, 682
- Calzetti, Kinney & Storchi-Bergmann (1994) Calzetti D., Kinney A. L., Storchi-Bergmann T., 1994, ApJ, 429, 582
- Chabrier (2003) Chabrier G., 2003, PASP, 115, 763
- Coe et al. (2012) Coe D. et al., 2012, ApJ, 757, 22
- D’Aloisio & Natarajan (2011) D’Aloisio A., Natarajan P., 2011, Mon. Not. Roy. Astron. Soc., 411, 1628
- Drory, Bender & Hopp (2004) Drory N., Bender R., Hopp U., 2004, ApJ, 616, L103
- Dunlop (2013) Dunlop J. S., 2013, in Astrophysics and Space Science Library, Vol. 396, Astrophysics and Space Science Library, Wiklind T., Mobasher B., Bromm V., eds., p. 223
- Eichner et al. (2013) Eichner T. et al., 2013, ArXiv e-prints
- Fan, Carilli & Keating (2006) Fan X., Carilli C. L., Keating B., 2006, ARA&A, 44, 415
- Gómez et al. (2012) Gómez P. L. et al., 2012, AJ, 144, 79
- Gregg et al. (2002) Gregg M. D., Lacy M., White R. L., Glikman E., Helfand D., Becker R. H., Brotherton M. S., 2002, ApJ, 564, 133
- Greisel et al. (2013) Greisel N., Seitz S., Drory N., Bender R., Saglia R. P., Snigula J., 2013, ApJ, 768, 117
- Gruen et al. (2013) Gruen D. et al., 2013, Mon. Not. Roy. Astron. Soc.
- Guzzo et al. (2009) Guzzo L. et al., 2009, A&A, 499, 357
- Halkola, Seitz & Pannella (2006) Halkola A., Seitz S., Pannella M., 2006, Mon. Not. Roy. Astron. Soc., 372, 1425
- Hatziminaoglou et al. (2005) Hatziminaoglou E. et al., 2005, AJ, 129, 1198
- Hoekstra, Yee & Gladders (2004) Hoekstra H., Yee H. K. C., Gladders M. D., 2004, ApJ, 606, 67
- Host (2012) Host O., 2012, Mon. Not. Roy. Astron. Soc., 420, L18
- Hu et al. (2002) Hu E. M., Cowie L. L., McMahon R. G., Capak P., Iwamuro F., Kneib J.-P., Maihara T., Motohara K., 2002, ApJ, 568, L75
- Ilbert et al. (2006) Ilbert O. et al., 2006, A&A, 457, 841
- Ilbert et al. (2009) Ilbert O. et al., 2009, ApJ, 690, 1236
- Kassiola & Kovner (1993) Kassiola A., Kovner I., 1993, in Liege International Astrophysical Colloquia, Vol. 31, Liege International Astrophysical Colloquia, Surdej J., Fraipont-Caro D., Gosset E., Refsdal S., Remy M., eds., p. 571
- Kneib et al. (2004) Kneib J.-P., Ellis R. S., Santos M. R., Richard J., 2004, ApJ, 607, 697
- Koekemoer et al. (2011) Koekemoer A. M. et al., 2011, ApJS, 197, 36
- Kormendy & Bender (2013) Kormendy J., Bender R., 2013, ApJ, 769, L5
- Kriek et al. (2006) Kriek M. et al., 2006, ApJ, 645, 44
- Lauer (1986) Lauer T. R., 1986, ApJ, 311, 34
- Lilly et al. (2013) Lilly S. J., Carollo C. M., Pipino A., Renzini A., Peng Y., 2013, ArXiv e-prints
- Maraston et al. (2010) Maraston C., Pforr J., Renzini A., Daddi E., Dickinson M., Cimatti A., Tonini C., 2010, Mon. Not. Roy. Astron. Soc., 407, 830
- Medezinski et al. (2013) Medezinski E. et al., 2013, ArXiv e-prints
- Pickles (1998) Pickles A. J., 1998, PASP, 110, 863
- Polletta et al. (2006) Polletta M. d. C. et al., 2006, ApJ, 642, 673
- Postman et al. (2012a) Postman M. et al., 2012a, ApJS, 199, 25
- Postman et al. (2012b) Postman M. et al., 2012b, ApJ, 756, 159
- Prevot et al. (1984) Prevot M. L., Lequeux J., Prevot L., Maurice E., Rocca-Volmerange B., 1984, A&A, 132, 389
- Richard et al. (2011) Richard J., Kneib J.-P., Ebeling H., Stark D. P., Egami E., Fiedler A. K., 2011, Mon. Not. Roy. Astron. Soc., 414, L31
- Steidel (1996) Steidel C. C., 1996, in Bulletin of the American Astronomical Society, Vol. 28, Bulletin of the American Astronomical Society, p. 1312
- Steidel et al. (1996a) Steidel C. C., Giavalisco M., Dickinson M., Adelberger K. L., 1996a, AJ, 112, 352
- Steidel et al. (1996b) Steidel C. C., Giavalisco M., Pettini M., Dickinson M., Adelberger K. L., 1996b, ApJ, 462, L17
- Suyu & Halkola (2010) Suyu S. H., Halkola A., 2010, A&A, 524, A94
- Suyu et al. (2012) Suyu S. H. et al., 2012, ApJ, 750, 10
- Umetsu et al. (2012) Umetsu K. et al., 2012, ApJ, 755, 56
- Zheng et al. (2012) Zheng W. et al., 2012, Nat, 489, 406
- Zitrin et al. (2009) Zitrin A. et al., 2009, Mon. Not. Roy. Astron. Soc., 396, 1985
- Zitrin et al. (2012) Zitrin A. et al., 2012, ApJ, 747, L9
Appendix A SED Fitting Results
We show here the results of the SED fitting from Sec. 7 of the multiple lensed system in greater detail.
We concentrate again only on ID2&3 which have the cleanest photometry.
Figs. 14 and 15 display the results for exponentially increasing () and decreasing () SFRs.
Fig. 16 shows the fitting results with SSP models only, whereas Fig. 17 displays the results when we perform the SED fit to all models (SSPs and CSPs) combined.
The lower panels of Figs. 14 to 17 display the best fitting SED and the photometry.
The panels in the middle and upper rows show the 2-dimensional likelihood distributions of fitting parameters (, , model age, ), whereas the probability distributions of the mass-to-light ratios () in the band are shown in the upper panels.
The blue contours in the likelihood distributions outline the - (solid), - (dashed), and (dotted) confidence levels.
The filter bands in which the S/N ratio does not exceed 1 (the dropout filters f225w to f775w) are considered upper limits in the SED fit (lower panels).
Figs. 19 to 21 show furthermore the probability distributions of the model ages, marginalized over the other fitting parameters.
The upper limits of the interval in age is smallest for the fit with SSP models (Fig. 20).
This is because all stars are assumed to form at the time of formation and therefore the mean stellar age of a SSP is higher than that of a CSP with the same formation redshift observed at the same cosmic time.