Three New Galactic Center X-ray Sources Identified with Near-Infrared Spectroscopy
Abstract
We have conducted a near-infrared spectroscopic survey of 47 candidate counterparts to X-ray sources discovered by the Chandra X-ray Observatory near the Galactic Center (GC). Though a significant number of these astrometric matches are likely to be spurious, we sought out spectral characteristics of active stars and interacting binaries, such as hot, massive spectral types or emission lines in order to corroborate the X-ray activity and certify the authenticity of the match. We present three new spectroscopic identifications, including a Be high mass X-ray binary (HMXB) or a Cassiopeiae (Cas) system, a symbiotic X-ray binary and an O-type star of unknown luminosity class. The Be HMXB/ Cas system and the symbiotic X-ray binary are the first of their classes to be spectroscopically identified in the GC region.
1 Introduction
The Chandra X-ray Observatory has uncovered nearly 10,000 X-ray point sources within the central of the Galaxy. The surface density of these sources and their heavy extinction together imply that the majority reside near the Galactic Center (GC), in an area that projects to pc at the GC distance of 8 kpc (Reid, 1993; Muno et al., 2003).
Most of these sources have faint, hard X-ray emission usually only associated with rare categories of objects, such as high mass X-ray binaries (HMXBs), low mass X-ray binaries (LMXBs), cataclysmic variables (CVs) with highly magnetized white dwarfs, colliding-wind binaries with blue supergiants or Wolf-Rayet stars, and in some rare types of symbiotic binaries (Luna & Sokoloski, 2007; Muno et al., 2009). Therefore these deep and well-localized observations of Galactic X-ray sources present an opportunity to find new examples of rare and valuable objects within the Galaxy. In addition the identification of the nature of these systems will constrain models of their binary formation channels and their accretion physics, as well as provide a probe of the stellar evolutionary history in the inner Galactic Bulge and around Sgr A∗.
The principal difficulties with finding optical/IR counterparts to the GC X-ray sources are the interstellar extinction and high stellar density. On average, the GC lies behind a column of cm-2, or mag (Predehl & Truemper, 1994; Baganoff et al., 2003), precluding observations in the ultraviolet/optical bands or with X-rays with keV. This inevitably leads to observing in the near-infrared (NIR), where the magnitude of dust extinction is significantly smaller than for optical light (; Nishiyama et al. (2008)) and where there are many identifying spectral features for stars and accretion-powered systems.
The high stellar density imposes its own difficulties. Astrometric matches between X-ray sources and NIR sources are frequently chance alignments instead of true physical counterparts. Our simulations of the astrometric matching between X-ray point sources and NIR point sources toward the central region around Sgr A∗ have shown that of apparent NIR astrometric matches to the hard X-ray Chandra sources are spurious (DeWitt et al., 2010). Thus a spectrum of a NIR candidate counterpart is required to establish an authentic match and identify the counterpart.
To date there have been more than 30 spectroscopic identifications of GC X-ray sources from the Muno 2009 catalog (Mikles et al., 2006; Hyodo et al., 2008; Mauerhan et al., 2007, 2010b). All have been either O supergiant or Wolf-Rayet stars with apparent magnitudes of mag. O/WR stars with similarly hard X-ray emission have been seen from colliding wind binaries (CWBs) or supergiant HMXBs. However, as direct evidence for binary companions is lacking in most cases, a single star emission mechanism cannot be ruled out. Sixteen of these spectroscopically identified counterparts are located in the central GC region in which we conducted our spectroscopic survey described in this paper.
Our aim was to continue these efforts and simultaneously extend the search to different classes of X-ray source whose infrared counterparts are fainter than the limits of the previously published studies. In this paper, we describe our spectroscopic survey targeting 47 NIR candidate counterparts to X-ray sources with mag. We present the spectra for three true counterparts, including a Be high mass X-ray binary (HMXB) or Cas system, a symbiotic X-ray binary and an O-type star with undetermined luminosity class. The Be type X-ray source and the symbiotic X-ray binary are the first of their class to be spectroscopically identified in the GC. Our discoveries increase the number of spectroscopically identified X-ray sources in the inner by 20 .
2 Sample Selection
Our primary objective was to identify X-ray sources in the catalog of Muno et al. (2009) that reside near the Galactic Center distance. We used our 2137 source NIR/X-ray matched catalog to select targets. This catalog contains 1565 hard X-ray source matches and 572 soft X-ray source matches to the 4268 X-ray sources detected by Muno et al. (2009) in the inner GC region.
The division between soft and hard X-ray sources was made to distinguish X-ray sources with low extinction that are within 4 kpc of the Earth and sources with high extinction, which are likely to lie at 4 kpc and beyond. We use a threshold hardness ratio of HR for defining soft sources, where HR, is the net soft photon counts with keV and is the net hard photon counts with keV (Muno et al., 2009). Hard X-ray sources will also include foreground sources with intrinsically hard X-ray spectra. To focus on the source matches likely to be located near the Galactic Center distance we chose to target sources with heavily reddened colors of mag that were matched to hard X-ray sources. These matches frequently represent chance alignments of the X-ray and NIR source coordinates due to the high NIR source density along the line of sight, which makes targeting the true NIR counterparts difficult.
In DeWitt et al. (2010), we identified sets of near-infrared/X-ray properties that maximized the number of probable true counterparts over the spurious matches. One of our most promising findings was a set of 69 heavily reddened NIR matches to hard X-ray sources with a likelihood of being true counterparts. All of these sources had X-ray positional errors of ″, detections in , and bands and relatively bright X-ray fluxes ( counts s-1). Ten of the 16 previously known NIR/X-ray counterparts in central GC region are included in this set of 69 sources (e.g. Mikles et al. 2006; Mauerhan et al. 2010b), which gives us confidence that our matching simulations successfully identify the properties of true counterparts. Since we did not wish to include previously known targets in our search, we limited our selection to the 59 targets within this set for which there are no published identifications. Adjusting for the known targets in this set, the remaining 59 targets have a 389 chance of being authentic ([47 sources 10 known sources] 590.38).
We observed 17 of these 59 “high probability” targets. In addition we observed 23 X-ray hard, heavily reddened matches with properties that excluded them from the “high probability” set of 69, such as nominally faint X-ray brightness or the lack of a -band detection. These targets were also chosen by using the DeWitt et al. (2010) results to enhance the probability for finding true counterparts, but their properties and associated probabilities are too heterogeneous to report here. Lastly, because of the limitations for the placement of individual long slit and MOS mask observations, we observed 7 NIR/X-ray counterparts with reddening or X-ray hardness ratios that should not correspond to GC distances. In total, we observed 47 targets for our spectroscopic campaign to find NIR counterparts to X-ray sources toward the GC.
3 Spectroscopic Observations and Reduction
We used the Large Binocular Telescope (LBT) LUCIFER1 spectrograph (Seifert et al., 2003) in multi-object spectroscopy (MOS) mode, and the SOAR/OSIRIS spectrograph (Depoy et al., 1993) in long slit mode to take spectra of our selected candidates. The dates and weather conditions for the LUCIFER1 observations and OSIRIS observations are listed in Table 1. In this table we include the official IAU name of each X-ray source (e.g. CXOUGC J174533.5-285540) and the corresponding record number within the Chandra X-ray source catalog from Muno et al. (2009). For the sake of brevity, we use the X-ray record number, designated by the prefix, “XID” for referring to X-ray sources and their NIR counterparts.
| Chandra X-ray | X-ray Catalog | Date of | Telescope and | R ( band), | Airmass | Seeing | Sky |
|---|---|---|---|---|---|---|---|
| Source (CXOUGC) | Number | Observations | Instrument | Conditions | |||
| J174552.9-285537 | XID 3275 | 5/17/2010 | LBT/LUCIFER | 2500 | 2.06 | ″ | thin cirrus |
| J174528.7-290942 | XID 6592 | 8/20/2010 | SOAR/OSIRIS | 1200 | 1.01 | ″ | clear |
| J174528.8-285726 | XID 947 | 8/19/2010 | SOAR/OSIRIS | 1200 | 2.09 | ″ | clear |
3.1 LUCIFER1 Observations
LUCIFER1 is a near-infrared spectrograph on the Large Binocular Telescope at Mount Graham Observatory, Arizona that performs multi-object spectroscopic (MOS) observations by use of laser-cut slit masks. The field of view of each slit mask is 4′2′.5. For our observations, we selected the grism which simultaneously provides in the band and in the band. In order to obtain the full spectral range targets must coincide with the center of the mask, since the spectrum spans the entire 2048 pixel detector width. We selected targets that would be positioned for coverage of the 2.1661 m Brackett feature, so that this important accretion signature would always be detectable if present.
We observed two MOS masks with LUCIFER on 17 May 2010. The MOS mask positions were chosen to get the greatest possible number of the 59 “high-probability” NIR/X-ray matches found in DeWitt et al. (2010). In total, we were able to position 9 of these sources on the two masks. The mask center positions were 17:45:50, -28:57:29 (J2000) for Mask 1 and 17:46:00, -28:54:24 (J2000) for Mask 2.
LUCIFER1 had only recently been commissioned for MOS mode at the time of our observations. The procedures for mask alignment and guiding were still being optimized and were expected to take up large amounts of overhead time. Therefore, instead of using known A0V telluric standards that would require recentering the slit mask, we used unreddened sources in the MOS mask field of view which had NIR colors consistent with stars earlier than G0. This approach has the disadvantage that the exact spectral type of the reference star is unknown in advance and must be derived as part of our spectroscopic analysis , which is affected by the atmospheric transmission spectrum that we desire to remove. We describe the procedure for correcting for atmospheric transmission for LUCIFER1 in §3.2.2.
Mask 1 and Mask 2 were designed for 18 and 21 targets, respectively. These targets included 19 of our NIR/X-ray candidate counterparts, 3 telluric reference stars and also GC red giant branch stars in support of another science project.
Each target slit was ″″. During observations, the MOS masks were aligned to bright reference stars within the mask field of view and an ABBA nodding sequence containing eight 100 second exposures was taken for each mask. The nod length was 2″.5. We attempted to select only targets that were free of stars in the sky positions of the nod pattern in order to facilitate clean sky subtraction. This was not possible for of the targets, and in these cases we selected targets with clear sky in just one of the nod positions. As we discuss in §3.2.1, we discarded the nod positions with contaminated skies. The NIR/X-ray candidate counterpart targets on each mask ranged from mag. At the end of the night arc lamps and spectral flat fields were taken with each MOS mask in place. Dark exposures were acquired for all exposure times used in our observations.
3.2 LUCIFER1 data reduction
We performed the LUCIFER1 data reduction using the Florida Analysis Tool Born of Yearning for high quality data (FATBOY) software package (Warner et al., 2008). We began the reduction process by subtracting dark frames from all images to remove the detector dark current and then dividing by spectral flat fields taken with each slit mask to correct for the grating blaze function and the detector’s wavelength sensitivity.
Then we subtracted the 2-D spectral frames of the B dither position from the A dither position, pairing the A and B frames by the time they were taken. The resultant “sky-subtracted” 2-D spectra should have removed the bulk of the variable OH line emission, and largely contain only signal from the target object. We coadded all the A sky-subtracted spectra, coadded all the B sky-subtracted spectra, and finally combined the A and B spectra by multiplying the B component by -1 and shifting it in the slit direction by the length of the dither. For some targets there was a contaminating star in the target slit that was acquired at the sky position of one of the AB dither positions. In these cases we discarded the contaminated positions from the stacked spectrum.
At this point we corrected the curvature of the spectral line and continuum shapes of the 2-D spectra by performing a rectification so that the spatial and spectral channels of the 2-D were all aligned in x and y pixel space. We extracted 1-D spectra by summing the 2-D spectra in the slit direction.
At the sky subtraction phase, a median image was also created which isolates the OH sky lines rather than removing them. We rectified this sky line image using the same transformation as for the sky-subtracted spectra. We calibrated the wavelength solution for each target spectrum using a 2nd order polynomial fit to the centers of atmospheric OH emission lines with known wavelength in the median image. The errors on the wavelength calibration for each target were between 0.03 and 0.1 Å.
3.2.1 Removal of Residual OH sky lines
We encountered residual OH emission for some sources that was not completely removed after sky subtraction. This was most apparent in the faintest targets and when we were forced to use only one object/sky nod position. To treat these cases, we adapted the methods of Davies (2007). We extracted the center parts of the median-stacked 2-D spectra (which isolated the OH sky spectra) to generate a template of the OH sky-lines for each target spectrum. We fit a power law to the thermal continuum in the sky template spectrum and removed it. Then the sky lines were broken into groups which share the same intensity variations (Davies, 2007). These different components of the sky template were then added or subtracted to visually remove residual OH emission lines.
3.2.2 Telluric Transmission Correction
To produce telluric transmission spectra we needed to remove intrinsic absorption lines from the telluric spectrum, which requires knowledge of the spectral type. We chose targets with mag and which were unblended in our ISPI imaging. At this threshold our telluric reference spectral types should have been limited to G0 types and earlier (Ducati et al., 2001). O/B stars have He I absorption features at m and m. Neither of our selected standards showed these features, which constrains the spectral types to A0-G0. For these spectral types, the only strong absorption features should be the Brackett series. Br was easily detected in band, as was Br 10-4 through Br 16-4 in band. We used a synthetic telluric absorption spectrum created for Mauna Kea conditions at with ATRAN (Lord, 1992). We adjusted this synthetic spectrum by adjusting its depth and wavelength offset so that it would best remove the deep telluric absorption bands at 2 m and 2.05 m in the band and 1.6 m and 1.63 m in the when it was divided from our observed telluric reference spectra. This allowed us to see, for the most part, the profiles of Brackett absorption features, although the telluric line-corrected regions were still quite noisy due to the usage of an artificially derived transmission spectrum.
We fit Br , and Br 10-4 through Br 16-4 using Gaussian functions and removed them. Brackett was too contaminated by atmospheric absorption to fit reliably. We used the ratio of depths () of Br / found in the synthetic spectrum of the A0 V star Vega (Castelli & Kurucz, 1994) to remove the Brackett line which is likely to exist in this region of our telluric standard stars, but we consider the resultant signal from m to be highly suspect. After these intrinsic stellar absorption lines were removed, we restored the telluric lines (which have been only partially removed by the synthetic telluric spectrum), and normalized the resultant spectrum. At this point we had a normalized telluric spectrum with the underlying stellar features from which it was derived removed. We divided all our LUCIFER1 targets by this telluric spectrum.
3.3 OSIRIS observations
We used OSIRIS on the 4-m SOAR telescope on Cerro Pachon, Chile in low resolution band mode () with the ″″ long slit. The long slit length allowed us to target two candidates at once by adjusting the slit position angle to acquire both star positions. As often as possible, we tried to pair sources by matching them closely in magnitude so that acceptable signal could be reached simultaneously.
In total, we observed 28 candidate counterparts to X-ray sources with OSIRIS on August 19-20, 2010. We primarily targeted candidate counterparts with mag. Eight targets were observed from the list of 59 “high probability” targets that had not been previously observed. The exposures were taken with ABBA nodding, where the nod length was carefully chosen to avoid contaminating stars in the sky positions for both targets on the slit.
We took a spectrum of the A1 V star HD160461 at least once per hour for the purpose of telluric calibration. This star was never more than 0.05 different in airmass from any of our Galactic Center targets.
3.4 OSIRIS data reduction
The basic steps of the OSIRIS data reduction were handled with FATBOY in the same way as for LUCIFER1, as described in §3.2. We calibrated the wavelength solution using both HeNeAr lamp exposures from the beginning and end of the nights and the positions of OH sky-lines acquired with target spectra. At the resolution in the band, the detectable OH lines do not span the full band range. We calculated the wavelength solution with the arc lamp exposures, and shifted the solution to the zero-positions of a set of four of the brightest OH lines in the target spectra. The HeNeAr wavelength solution was determined to have less than Å scatter over both nights by measuring the difference in wavelength solutions of arc lamps taken during the night.
Many of our spectra were affected by the intermittent appearance of regularly spaced dips in the spectrum. In Figure 1 we show our spectra from LBV 1806-20 taken on successive nights. We observed this source during the 20 minute interval on both observing nights when the GC targets were beyond the azimuth limits of the SOAR telescope. Our spectra of LBV 1806-20 closely resembles previously published -band spectra from this source, such as in Eikenberry et al. (2004). However, the second night spectrum shows four large semi-regularly spaced dips in the continuum that were not present in the first night spectrum. We observed similar features in roughly 50 of our other OSIRIS targets. By visual examination we noted that the features changed in amplitude and central position but the spacing and relative amplitudes of the dips appeared to stay constant.
This is a known but unsolved issue with OSIRIS since its installation on SOAR from its previous location at the 4 m CTIO telescope (R.Blum, priv. comm.). We created a template for the shape of these features by fitting Gaussian functions to the four pits in the ratio of the night 2 and night 1 OSIRIS spectra of LBV 1806-10. The pitting template is shown at the bottom of Figure 1. For each target that was affected we visually matched the amplitude and position of the pitting template and divided it from the target spectrum. We do not believe that our results are significantly affected since the pitting features are broad compared to the stellar absorption lines and emission lines.

The telluric correction for OSIRIS was performed by first removing the intrinsic Brackett absorption from each of the telluric standard spectra by fitting a Gaussian function to the Brackett position and dividing it out. We then normalized the telluric transmission spectra to 1.0. Each science target spectrum was divided by the normalized telluric standard spectrum taken closest in time and airmass to the science target observations.
4 Results
We identified three counterparts to hard X-ray sources near the Galactic Center. As described in detail below, these discoveries include a Be HMXB or Cassiopeiae (Cas) system and symbiotic X-ray binary. Both are the first of their types to be spectroscopically identified within the region toward Sgr A∗. The third newly discovered X-ray system is an O type star near the GC distance, which may be a low luminosity HMXB, a CWB or an unusually X-ray hard single star.
Within our 7 foreground targets, we uncovered an O type supergiant counterpart to CXOUGC J174537.9-290134, confirming the spectroscopic identification published by Mauerhan et al. (2010a) shortly after our observations were taken. Table 2 summarizes our NIR spectroscopic identifications of GC counterparts to X-ray sources. The other 6 foreground targets were primarily found to be dwarf stars without emission lines.
The 37 remaining GC target spectra were found to be late-type giants without emission lines. In these cases the matches are either spurious or they represent true counterparts that were targeted during a low-activity state. For reference, we include the coordinates and NIR photometry of all our spectroscopic targets in the Appendix.
| X-ray | Spectral | X-ray | Approximate |
|---|---|---|---|
| Source Number | Type | Source Type | Distance |
| 3275 | B0-3e III | Be HMXB or Cas system | GC distance |
| 6592 | M7 III | symbiotic XRB | GC distance |
| 947 | O I, III or V | CWB, HMXB, single O star | GC distance |
The ISPI magnitudes and colors of these three NIR counterparts and their X-ray characteristics are presented in Table 3. We detail the properties of each source below.
| X-ray | RAIR | DECIR | Sep.a | b | HR0 | Type | log(FX) | |||
|---|---|---|---|---|---|---|---|---|---|---|
| Source No. | (J2000.0) | (J2000.0) | (mag) | (mag) | (mag) | (″) | (″) | |||
| 3275 | 17:45:52.97 | -28:55:37.0 | 17.69 0.18 | 14.75 0.04 | 13.08 0.04 | 0.15 | 0.6 | c | hard | -3.968 |
| 6592 | 17:45:28.79 | -29:09:42.8 | - | 13.03 0.03 | 9.88 0.03 | 0.2 | 0.6 | hard | -2.673 | |
| 947 | 17:45:28.88 | -28:57:26.4 | 16.23 0.06 | 13.29 0.03 | 11.61 0.03 | 0.06 | 0.5 | hard | -4.110 |
4.1 XID 3275: a Galactic Center Be HMXB or Cassiopeiae System
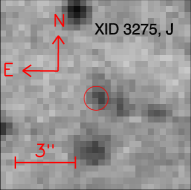
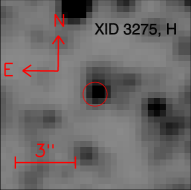
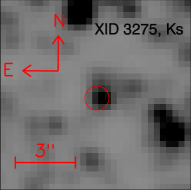
The NIR counterpart to XID 3275 is a mag star with heavy reddening ( mag and mag). Finding charts produced with ISPI data are shown in Figure 2. The spectrum, observed with LUCIFER1, clearly shows emission from the Brackett series from H 7-4 to H 18-4, as well as He I 2.0589 m (see Figures 3 and 4). There is also evidence for emission from the Mg II doublet at 2.138 m and 2.144 m. We quote air wavelengths for all spectral features. No clear absorption lines are present in the spectra, and in particular there is no evidence of a CO feature at 2.295 m. At a signal to noise level per resolution element, the absence rules out spectral types later than F0. Our line identifications and measurements for the NIR spectra are listed in Table 4.


| Line ID | rest | observed | WEQ | FWHM |
|---|---|---|---|---|
| wavelength (m) | wavelength (m) | (Å) | (Å) | |
| Br | 2.16610 | 2.165610.00001 | -11.8 0.8 | 20 5 |
| He I | 2.05870 | 2.058440.00001 | -3.8 1.0 | 23 5 |
| Br | 1.94510 | 1.944540.00001 | -10.3 1.5 | 29 5 |
| Mg II | 2.13800 | 2.136900.00001 | -2.1 1.0 | 20 10 |
| Mg II | 2.14400 | 2.143200.00001 | -1.6 1.0 | 20 10 |
| H 10-4 | 1.73670 | 1.736110.00001 | -10.2 1.5 | 32 3 |
| H 11-4 | 1.68110 | 1.680530.00001 | -11.4 1.5 | 32 5 |
| H 12-4 | 1.64120 | 1.640740.00001 | -8.8 1.5 | 23 5 |
| H 13-4 | 1.61140 | 1.610560.00001 | -7.0 1.5 | 32 5 |
| H 14-4 | 1.58850 | 1.588220.00001 | -6.8 1.5 | 23 5 |
| H 15-4 | 1.57050 | 1.570230.00001 | -8.3 1.5 | 29 5 |
Visually, the spectrum is like that of a typical Be type star. Steele et al. (1999) and Steele & Clark (2001) present a catalog of and band spectra of 57 optically-typed Be stars between O9-B9. Brackett and He I emission are identifying characteristics of their classification for “Group I”, corresponding to spectral types of O9e-B3e. The presence of Mg II emission corroborates this range of spectral types, as it is only seen in types earlier than B4e. (Steele & Clark, 2001). Therefore we can constrain the spectral type of this source to O9e-B3e.
Be stars are young, massive O and B stars that are rotating near their break-up speed, casting off matter into an equatorial circumstellar disk. The disk material fluoresces as it is irradiated by UV emission from the stellar photosphere. Although normal Be stars are not known to be sources of hard X-ray radiation, Be stars are known for being components in HMXBs and in Cas systems, both of which produce hard X-rays with luminosities detectable at the GC distance. Therefore, we consider this NIR source to be the likely true physical counterpart to the X-ray source, XID 3275.
Be stars are commonly found to be the donor stars in HMXBs. Of the 131 known HMXBs, nearly half are thought to contain Be stars and 28 have been spectrally confirmed (Reig, 2011). Be HMXBs are known for hard X-ray emission described by a power-law. Typically Be XRBs contain a neutron star in an eccentric orbit with a period of 10-300 days (Reig, 2011). Accretion episodes occur during the closest approach of the neutron star and often exhibit X-ray pulsations due to the neutron star rotation. The high states can be very luminous, reaching ergs s-1, while quiescent luminosities are typically ergs s-1. In general, Be HMXBs with fainter and steadier emission are associated with longer periods and lower orbital eccentricities.
Given the large range of Brackett strengths found for ordinary Be stars (Å in absorption to Å in emission for the sources in the Steele et al. (1999) sample), there is no clear evidence for or against accretion activity contributing to the emission features in our spectrum. The equivalent widths (EW) of the Brackett and He I 2.0587 m emission lines in the XID 3275 counterpart are -10.3 Å and -3.8 Å , respectively. These values are typical for Be stars(Clark & Steele, 2000).
The emission line FWHMs are consistent with an origin in the circumstellar material. Using the FWHMBrγ- relationship from Steele & Clark (2001) the FWHM20 Å translates to 160 50 km s-1. The Be stars in the Clark sample have a range of km s km s-1, which means the line widths from the spectrum of XID 3275 are typical for Be stars.
To determine the luminosity class of this object, we need to constrain the distance. The color, mag is near the modal value of the distribution of sources within 20″ of this area (see Figure 5), which implies a distance close to that of the Galactic Center. O9-B3 stars have intrinsic colors of mag or -0.10 -0.05 mag, according to Ducati et al. (2001). However, Be HMXBs are often redder than this due to circumstellar material; the typical range given in Reig (2011) is -0.2 0.6 mag, which corresponds to -0.04 0.1 mag, approximating the absorption ratios with values derived from the GC interstellar medium (Nishiyama et al., 2009). We adopt the intrinsic color range -0.04 0.1 mag for XID 3275 and a GC distance value of 8 kpc (Reid, 1993). Using extinction coefficients derived for the Galactic Center by Nishiyama et al. (2008) we calculate an extinction range of 2.16 2.36 mag. The dereddened magnitudes are thus mag, mag and mag. We calculate an absolute magnitude of -3.79 M -3.6 mag.

Main sequence O9-B3 stars have absolute magnitudes of mag (Carroll & Ostlie, 1996). For giant stars in the same range of subtypes, the absolute magnitudes are mag. Thus, a range of B0-3e III best matches the calculated absolute magnitude, but we cannot rule out that our source is a main sequence star earlier than O9V, or that this distance and luminosity is not overestimated due to intrinsic reddening in excess of our assumed maximal value of mag. However, a much redder value of would be unusual for a Be HMXB (Reig, 2011).
We used XSPEC (Arnaud, 1996) to perform X-ray spectral fitting on the unbinned X-ray data from Muno et al. (2009) using the Cash statistic (hereafter C-statistic; Cash 1979), which is more appropriate for modeling low-count X-ray spectra. We refrain from subtracting the background, and instead follow Broos et al. (2010) to model both source and background in the observed spectrum. We fit both a mekal thermal bremmstrahlung model (Liedahl et al., 1995) and an absorbed power-law model to the X-ray data.
The fits are poorly constrained, but indicate that the source is intrinsically hard, with or kT 10 keV. The column density from the model fits is also poorly constrained, but generally consistent with the values we obtained using NIR colors: cm-2. For the best-fit absorbed power-law model, we obtained an unabsorbed flux from 0.5-8 keV of ergs cm-2 s-1. At the GC distance of 8 kpc (Reid, 1993) , this corresponds to ergs s-1.
This measurement would be the second faintest observed X-ray luminosity for a Be HMXB. Tomsick et al. (2011) report that the Be HMXB IGR J01363+6610 had an upper limit luminosity of L ergs s-1 during an observation with Chandra. Prior to the Chandra observation, the luminosity of IGR J01363+6610 was measured with XMM-Newton to be L9 ergs s-1, also unusually low for a Be HMXB. At another time, IGR J01363+6610 was observed by INTEGRAL during an outburst at an X-ray luminosity of ergs s-1 (Tomsick et al., 2011).
To date, XID 3275 has not been observed during an outburst nor has it varied outside the Chandra noise error levels despite having been observed 35 times between October 2000 and July 2007 for a total of 11.7 days of on-source time (Muno et al., 2009). We note, however, that there were a number of long gaps in the coverage: two day gaps and two 260 day gaps during which XID 3275 could have undergone an outburst and returned to a quiescent state.
The implication could be that XID 3275 is a large separation, low eccentricity version of the average Be HMXB. Five Be HMXBs are known to have orbital eccentricities smaller than and with days (Reig, 2011). Due to the lack of close approaches to the Be star, these systems are observed to have steady luminosities of 1033 ergs s-1.
Alternatively, XID 3275 may belong to the Cas subclass of Be systems. These systems have hard X-ray emission dominated by a 12 keV plasma, instead of the usual hard power-law seen in other Be HMXBs (Lopes de Oliveira et al., 2010). Their luminosity is found in the range of 1032-1033 ergs s-1, which makes them a reasonable candidate for the X-ray luminosity seen in XID 3275. Cas systems also do not display the large amplitude outbursts common to traditional Be HMXBs. Instead, smaller amplitude variability is seen on all time scales, from hours to months (Lopes de Oliveira et al., 2010). The hourly flickering has been used by some authors to argue that Cas systems host a WD instead of a neutron star, by analogy to the high temperature thermal plasmas and flickering seen in some CVs (Reig, 2011). The largest observed amplitude variability has been a factor of 3 over time scales of 50-90 days. Muno et al. (2009) did not find evidence for flux variations between the 35 observations of this source; however we again note the irregularity of the Chandra coverage. The question of whether this system is a classical Be HMXB or a Cas may be best determined by modeling the X-ray spectrum to determine if it is an X-ray power-law (for classical BeHMXBs) or a thermal plasma (for Cas systems). However, the 109 X-ray photon spectrum accumulated by Chandra over 1 Ms of exposure time for this source is insufficient for this distinction.
4.2 XID 6592: a Candidate Galactic Center Symbiotic Binary
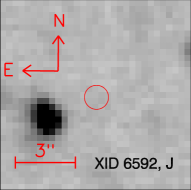
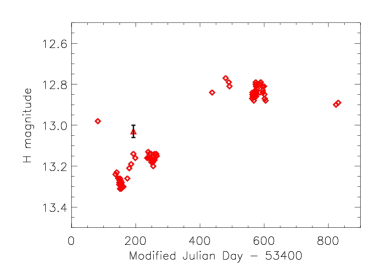
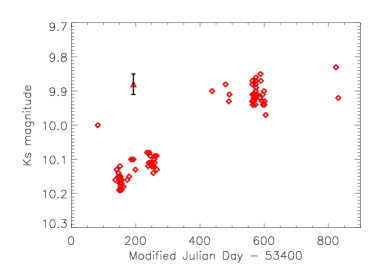
The counterpart to XID 6592 is a bright mag star with heavy reddening (; undetected in in our ISPI data). Matsunaga et al. (2009) identify this source as a long period variable based on and photometric monitoring, but they were unable to identify a period. Finding charts produced with ISPI data are shown in Figure 6.
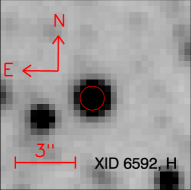
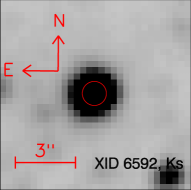
We identify the counterpart to XID 6952 as a potential X-ray emitting source on the basis of the large Br emission line in the band spectrum, shown in Figure 7. However, as we discuss below, there are other interpretations as well. The band spectrum shows deep CO bands beyond m and deep Na I and Ca I absorption lines (2.2062/2.2090 m and 2.2631/2.2667 m, respectively), as well as a depression in the continuum below m due to steam absorption. Our line measurements from the spectrum are listed in Table 5.
| Line ID | rest | observed | EW | FWHM |
|---|---|---|---|---|
| wavelength (m) | wavelength (m) | (Å) | (Å) | |
| Br | 2.16610 | 2.164740.00003 | 1.8 | 17 3 |
| Na | 2.2062/2.2090 | 2.2053/2.2081 0.0001 | - | |
| Ca | 2.2631/2.2667 | 2.2619/2.2655 0.0001 | - |
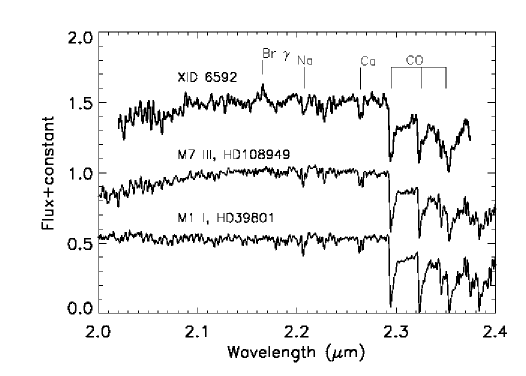
We derived the spectral type for the counterpart to XID 6592 by calculating differences to stellar spectra in the IRTF spectral library (Rayner et al., 2009). First we fit the slope of the continuum between m and m and removed the slope from both the counterpart and the IRTF templates. Then we shifted the template spectra to the velocity of the XID 6592 velocity, using a cross correlation function. To calculate the value, we assumed the template spectrum had negligible noise and used the standard deviation between the counterpart spectrum and a smoothed version of itself as the noise value. We calculated the value in the region between m and m, which contains the segment of the CO band acquired by OSIRIS, as well as the Ca feature at 2.285 m (Table 6).
The best matches in terms of value for XID 6592 were a semi-regular variable M7 III star (HD108849) and the M supergiants. However, in the supergiants, the CO band minima overshoot the levels in XID 6592 by 15 or more. XID 6592 would also be underluminous for a supergiant at the GC distance (see below), which leads us to conclude that the M7 III giant is the most likely spectral type.
Our ISPI data falls within the time span of the photometric monitoring reported in Matsunaga et al. (2009). In Figure 8 we show their and lightcurves of the XID 6592 counterpart, with the addition of our ISPI photometry. The ISPI band and band seem to be outliers from the SIRIUS and light curve; both our measurements are significantly brighter and may indicate a flaring episode in the data. We would not insist on this interpretation, since the source is very bright and our measurement could be affected by pixel non-linearity. Detailed comparison of our ISPI photometry and the SIRIUS photometry from Matsunaga et al. (2009) should be performed to verify a possible flaring episode.
| Sp.Type | (D.O.F.149) | reduced | template ID |
|---|---|---|---|
| K2 III | 7913.5 | 53.1 | HD132935 |
| K6 III | 5229.5 | 35.1 | HD3346 |
| M1 III | 3579.2 | 24.0 | HD204724 |
| M4 III | 2764.4 | 18.6 | HD214665 |
| M6 III | 1119.1 | 7.5 | HD196610 |
| M7 III | 721.3 | 4.8 | HD108849 |
| M5e-M9e III | 1129.5 | 7.6 | HD14386 (Mira) |
| M9 III | 1069.7 | 7.2 | IRAS15060+0947 |
| M0.5Ib | 1242.2 | 8.3 | HD236697 |
| M1-2 Ia-Iab | 695.6 | 4.7 | HD39801 |
| M3-4 Iab | 718.3 | 4.8 | HD14469 |
| M5 Ib-II | 2061.6 | 13.8 | HD156014 |
The intrinsic color for the template M7 III is 0.414 mag (Rayner et al., 2009). We use the XID 6592 counterpart mean color from the observations of Matsunaga et al. (2009) ( mag), and an extinction scaling of (Nishiyama et al., 2008, 2009), to calculate A mag and A mag for the extinction to XID 6592.
Normal late type stars should dominate the Galactic Center population and have colors of mag. Even adjusting for the intrinsic color difference, this source’s reddening is larger by at least 0.7 mag than the modal value for the local extinction of this region (Figure 9), so it may either lie beyond the GC distance, or be subject to intrinsic extinction in addition to what is present in the best fit template (meaning that 0.414 mag). We adopt the GC distance of 8 kpc (Reid, 1993) but note that it may represent the minimum distance to this object. For the GC distance we calculate an absolute magnitude mag, given a spectral type of M7 III. This value falls within the range of GC LPVs studied by Blum et al. (2003), which range from mag.
Using the ratio of column density to the visual extinction ( cm s-1 mag-1 ; Predehl & Schmitt 1995), we estimate that XID 6592 lies behind cm-2. We also fit the Chandra data for this source from Muno et al. (2009) using XSPEC with an absorbed powerlaw (Arnaud, 1996). We found that XID 6592 is absorbed by cm2. This is 2.5 times larger than the estimate derived from NIR colors, which may indicate intrinsic absorption of the X-ray source. The power-law slope was found to be and the best-fit parameters yield an unabsorbed X-ray flux (0.2-8 keV) of ergs cm-2 s-1. For the GC distance of 8 kpc (Reid, 1993), this corresponds to ergs s-1.
The counterpart spectrum shown in Figure 7 shows a Brackett emission line at 2.1645 m, with an equivalent width of -1.8 to -2.6 Å , depending on the placement of the continuum. This corresponds to a blue shift of km s-1 with respect to the prominent Na and Ca absorption lines.
Isolated Mira variables are not known to be strong X-ray sources. However, they often show emission lines from hydrogen during some phases of their pulsations. This is thought to be due to shocks forming in the expanding and contracting envelope of the star. Hinkle et al. (1984) found that Mira emission lines are blueshifted an average of 13.2 km/s with respect to the absorption lines of the star. The maximum emission line velocity found for Miras in their study was km s-1. We could not find many measurements of the EW for Brackett emission from isolated Miras in the literature. The Wallace & Hinkle (1997) spectral atlas includes 9 spectra of o Ceti (Mira) taken at different phases across the pulsation period. We measured the Brackett emission line EWs of the atlas spectra of o Ceti from different pulsational phases and found it to vary between 0 and −1.2±0.2 /AA, smaller than the EW we measure for XID 6592’s spectrum.

Chakrabarty et al. (1998) measured the blueshifted emission in the symbiotic binary GX 1+4 and found velocities up to km s-1 for He I 1.083 m. GX 1+4 is known to contain a pulsar. Chakrabarty et al. (1998) considered whether the blueshifted emission line could originate from the ionization of the wind of the M giant, or from a wind driven directly from the pulsar or accretion disk. Since M giant wind speeds are expected to have a range of 1030 km s-1 (Dupree, 1986), they conclude in favor of an outflow driven by the pulsar or accretion disk.
Our value of km s-1 is inconsistent with the known velocity values of self-shocked emission from Miras. Therefore we believe that there is a binary companion to the red giant in the XID 6592 system that is either ionizing the red giant’s wind or directly driving an outflow. This companion, if compact, could also be responsible for the X-ray emission from the system. The high velocity seen in the Br line is more consistent with outflow driven from an accretion disk around the binary companion than by ionization of wind from the red giant.
Twenty percent of the objects in the Belczyński et al. (2000) symbiotic binary catalog have irregular variables or Mira variables as secondary stars. Their mass loss at this evolutionary stage makes them effective mass donors to any compact objects in day orbits (Mürset & Schmid, 1999).The remainder of symbiotic secondaries consist of normal first ascent M type giants.
Most symbiotic stars discovered so far contain white dwarf compact objects. The majority of these sources show X-rays characteristic of 0.41 keV plasmas, as a result of quasi-steady nuclear burning of accreted material on the WD surface (Muerset et al., 1997). The exceptions are NS symbiotic binaries also known as symbiotic X-ray binaries and the newly emerging class of hard X-ray emitting white dwarf symbiotic binaries.
The WD or NS identification is often made by X-ray spectral fits which simultaneously solve for accretion rate (by measuring the internal absorption of the X-rays) and total X-ray luminosity. The amount of energy liberated by accretion onto a compact object is inversely proportional to its surface radius. Thus, once the accretion rate and resulting luminosity are known, the radius of the compact object can be constrained (Luna & Sokoloski, 2007). The radius of a white dwarf has a negative dependence on the mass (Provencal et al., 1998), allowing X-ray spectral fitting to solve for the WD mass (Luna & Sokoloski, 2007).
There are several symbiotic binaries now known to host neutron star primaries, including GX 1+4, 4U 1700+24, 4U 1954+31, IGR J16194-2810, IGR 16393-4643 and IGR 16358-4726 (Luna & Sokoloski, 2007; Nespoli et al., 2010). These objects display X-ray luminosities between 1032-1034 ergs s-1 (Masetti et al., 2002; Nespoli et al., 2010). GX 1+4 has been observed in outburst at 1037 ergs s-1 (Staubert et al., 1995).
Masetti et al. (2006) took optical spectra of the NS symbiotic binaries 4U 1954+319 and 4U 1700+24 during periods of relatively low X-ray luminosity of 1032 ergs s-1. They found the optical spectra for both sources were completely devoid of emission lines, with the continuum dominated by the secondary M III stars. The lack of Balmer lines in the optical make it unclear whether these sources would have detectable Brackett emission in the NIR. Nespoli et al. (2010) took -band spectra of IGR 16393-4643 and IGR 16358-4726 and found tenuous detections of Brackett and He I 2.0581 m in each. The spectrum of GX 1+4 taken in the band by Chakrabarty et al. (1998) has strong emission at Brackett and no other emission features.
There are at least 13 known hard spectrum symbiotic binaries thought to host white dwarfs, including RT Cru, TCrB, CH Cyg, CD-573057, SS73 17 and 8 others recently detected by the X-ray telescope on the Swift Gamma Ray Observatory (Luna & Sokoloski, 2007; Smith et al., 2008; Luna et al., 2010). Luna & Sokoloski (2007) model the X-ray spectra of RT Cru with the purpose of finding the source of the hard X-ray emission. They exclude magnetic channeling of the accretion flow, as seen in hard spectrum WD polars, on the basis of the lack of pulsations caused by the WDs rotation. Instead they find that the WD mass is unusually high, M☉, which causes higher energy collisions at the surface of the WD than for lower mass WDs. White dwarf masses are usually 0.551 M☉ in symbiotic binaries (Sion & Ready, 1992).
Similarly high white dwarf masses are calculated for the other systems in this class (Luna et al., 2008; Smith et al., 2008; Luna et al., 2010). Eze (2011) suggest that this source class could be a major channel for Type Ia Supernovae. SN Ia’s are usually thought to result from the collapse of Chandrasekhar mass (1.4M☉) CO white dwarfs. Various accreting binaries with white dwarfs have been proposed as the progenitors, but most of these systems are either too rare for the observed SN Ia rate or unlikely to accrete enough mass to reach the Chandrasekhar mass limit (van Kerkwijk et al., 2010). Hard spectrum WD symbiotic binaries may signify systems that have nearly succeeded in reaching the Chandrasekhar mass and thus may prove to be a major channel for SN Ia (Eze, 2011).
The X-ray luminosity range found in hard X-ray WD symbiotic binaries is between 1032-1034 ergs s-1 (Luna & Sokoloski, 2007; Smith et al., 2008). To date we know of no published NIR spectra of any of these sources, but the optical spectra are known to have Balmer line emission in at least three cases (Cieslinski et al., 1994; Mukai et al., 2003). This gives us reason to expect Brackett line emission in the NIR from hard spectrum WD symbiotic binaries.
Thus, we have two strong candidates for the nature of this system: NS symbiotic X-ray binaries and hard-spectrum WD symbiotic binaries. Each of these candidates have the luminosity range and hard spectral characteristics of XID 6592. The nature of the compact object could in principle be constrained with observations of NS bursts or pulsations, or by X-ray spectral modeling; however, the present tally of 150 photon counts, acquired in 60 ks of exposure time, is insufficient to draw firm conclusions. Additional X-ray observations may be warranted.
4.3 XID 947: a Candidate Galactic Center O star
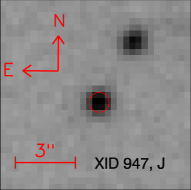
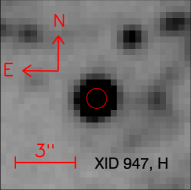
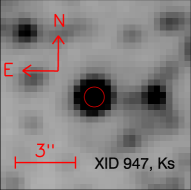
The counterpart to XID 947 is a mag, mag, mag star shown in Figure 10. We observed the -band spectrum with OSIRIS. We identify it as a probable true counterpart because of the lack of apparent CO features at m and because of the marginal detections of an He I/N III P-Cygni feature at 2.113 m and weak Brackett absorption commonly found in mid O-type spectra (Hanson et al., 2005). This spectrum is difficult to type beyond the lack of CO absorption because the telluric transmission was poorly corrected by the two observations of the A1 V star taken before and after this target (see Figure 11). This may be due to the fact that the slit position angle of the telluric reference spectra was taken near the parallactic angle, and 100∘ away from the position angle used for the observation of XID 947. The spectrum of this source may therefore be affected by wavelength-dependent slit losses, exacerbated by the high airmass at the time of the observations [].

The color of the XID 947 counterpart is at the modal value of the color distribution of other NIR sources within 20″(see Figure 12). Therefore we adopt the Galactic Center distance of 8.0 kpc for this source (Reid, 1993).
We proceed by adopting the intrinsic colors of O stars from Martins & Plez (2006): mag and mag. We adopt mag for the reddening and calculate mag, mag, mag and mag using extinction scalings from Nishiyama et al. (2008). The extinction-to-column-depth conversion ratio cm-2 gives us a column depth value of cm-2 toward XID 947 (Predehl & Schmitt, 1995). We calculate absolute magnitudes of mag, mag, mag. This magnitude is compatible with O3-9.5 I supergiants, O6 III giants, and O3 V dwarfs (Martins & Plez, 2006).
We also modeled the Chandra data with XSPEC (Arnaud, 1996) using both an absorbed thermal bremsstrahlung model and an absorbed power law model. The bremsstrahlung model yields an unrealistically high temperature of keV. The absorbed power-law model has a best-fit parameters of and cm-2. For these parameters, the unabsorbed X-ray flux is ergs cm-2 s-1, which corresponds to ergs s-1 at the GC distance.

This is on the low end for the known O supergiants that are detected in the GC (Mauerhan et al., 2010b). A single O V or O III star could in principle generate this luminosity in X-ray photons, from internal shocks within its wind. The typical scaling of the X-ray flux to the bolometric luminosity is for isolated O stars of all luminosity classes (Oskinova, 2005). For a -band bolometric correction of -4.4 (Mauerhan et al., 2010a), . This yields a ratio of 10-7.5, which is lower than the canonical value for isolated O stars (Oskinova, 2005). However, our XSPEC spectral model calculated the total flux of only a power-law component, extrapolating the flux to soft X-ray energies that were absorbed in our spectrum. If there was an additional soft thermal X-ray component, the resultant flux would also be absorbed but it would not be taken into account by our XSPEC luminosity calculation. Most of the sources used to derive the canonical value had multiple soft, thermal X-ray components (Oskinova, 2005). Therefore, XID 947 may have a typical X-ray luminosity for an O star, when all spectral components are taken into account.
We conclude that XID 947 is likely to be an O-type star with uncertain evolutionary class that may be isolated, in a colliding-wind binary, or quietly accreting onto a compact object. A higher S/N ratio spectrum is needed to make any significant conclusions about this source.
5 Conclusion
Our spectroscopic observations found three new counterparts to the population of X-ray sources near the Galactic Center, increasing the number identified in the inner by 20. These included a Be HMXB or Cas system, a symbiotic X-ray binary, and an O-type star with an undetermined luminosity class.
Despite observing 17 of our “high probability” candidate counterparts, the Be HMXB XID 3275 was the only one to exhibit emission lines in the NIR spectra. The GC O-type star and symbiotic XRB show emission lines but were not part of the “high probability” set due to lower X-ray flux and a lack of a -band detection, respectively.
The remaining 16 “high probability” targets were all late-type giants without emission lines. We expected to discover 62 true counterparts to X-ray sources based on the 389 probability found in our simulations (DeWitt et al., 2010). We believe that our previous statistical analysis was robust, and that this apparent discrepancy may be due to observing candidate counterparts during phases of low accretion activity and/or that the nature of these sources is such that accretion signatures are not generally visible in their spectra, as in the case for some symbiotic X-ray binaries (e.g. Masetti et al. 2006; Nespoli et al. 2010). We will address these possibilities and their implications for the GC X-ray source population in a future paper.
For the candidate Be HMXB/ Cas system (XID 3275), we inferred a spectral type of B0-3 III. We do not have enough well-sampled X-ray data to determine if there is X-ray variability of the expected type for a classical Be HMXB or a Cas system; the Muno et al. (2009) data are consistent with constant X-ray flux over a long time baseline. We also note that this source would be atypically X-ray faint for a Be HMXB, although such a faint X-ray luminosity is not unprecedented. Further regular X-ray monitoring of this source to search for X-ray variability is required to determine its nature.
The O type star, XID 947 could be a colliding wind binary or a high mass X-ray binary or an isolated star with unusually energetic X-ray emission. This source adds to the total of 32 similar hard X-ray spectrum massive young stars (WR/O types) toward the Galactic Center.
Finally, we discovered a hard X-ray emitting likely symbiotic star with an M7 III semi-regular variable secondary (XID 6592). It has a Brackett line blueshifted by 80 km s-1 with respect to the stellar center of velocity for the M giant, which we interpret as a feature from an accretion driven wind. Symbiotic stars are usually known for having low energy X-ray spectra with kT1 keV. The hard X-ray spectrum for this source could be explained by a neutron star companion, which tends to produce a high-energy power-law tail, or this source could be a member of the newly emerging class of nearly Chandrasekhar mass white dwarf symbiotic binaries. These stars are of interest as possible progenitors to supernovae Type Ias.
The authors thank Richard Pogge, Matthias Dietrich and Chris Howk for performing the observations of our targets with LBT LUCIFER1.
CD, RMB, and SSE gratefully acknowledge the support of NSF grant AST-0807867.
OSIRIS (Ohio State Infrared Imager/Spectrometer) is a collaborative project between The Ohio State University and Cerro Tololo Inter-American Observatory (CTIO) and was developed through NSF grants AST 90- 16112 and AST 92-18449.
CTIO is part of the National Optical Astronomy Observatory (NOAO), based in La Serena, Chile. NOAO is operated by the Association of Universities for Research in Astronomy (AURA), Inc., under cooperative agreement with the National Science Foundation.
This work has been done with observations from the Southern Astrophysics Research (SOAR) telescope, a collaboration among the Ministério da Ciência e Tecnologia/Brazil, NOAO, The University of North Carolina at Chapel Hill, and Michigan State University.
FEB acknowledges the support of CONICYT, Chile, under grants FONDECYT 1101024 and FONDAP (CATA) 15010003.
Appendix A Appendix: Table of All Sources Spectroscopically Observed
In Table 7 we include the coordinates and ISPI photometry of all NIR counterparts that we targeted as part of our survey. Except where otherwise noted, these sources had no emission lines corroborating X-ray activity. Every deeply reddened non-emission line NIR source [ had spectral features indicating a late type. Foreground sources [] had a mix of spectral types, but no emission lines indicating high activity.
| Chandra X-ray | X-ray | RAIR | DECIR | Observatory | Comments | |||
|---|---|---|---|---|---|---|---|---|
| Source (CXOUGC) | Catalog No. | (J2000.0) | (J2000.0) | (mag) | (mag) | (mag) | ||
| J174459.0-285123 | XID 6010 | 17:44:59.05 | -28:51:23.6 | 15.65 0.05 | 14.19 0.04 | 12.94 0.05 | OSIRIS/SOAR | |
| J174459.4-285140 | XID 6019 | 17:44:59.41 | -28:51:40.7 | 13.44 0.02 | 11.90 0.03 | 10.72 0.03 | OSIRIS/SOAR | |
| J174459.5-285108 | XID 6023 | 17:44:59.53 | -28:51:08.0 | 13.88 0.03 | 12.32 0.03 | 11.26 0.04 | OSIRIS/SOAR | |
| J174500.0-285132 | XID 6034 | 17:45:00.08 | -28:51:32.9 | 13.88 0.03 | 12.93 0.03 | 12.23 0.04 | OSIRIS/SOAR | |
| J174500.8-285121 | XID 6055 | 17:45:00.82 | -28:51:21.9 | - | 15.28 0.07 | 12.83 0.05 | OSIRIS/SOAR | |
| J174507.4-290456 | XID 57 | 17:45:07.41 | -29:04:57.3 | - | 14.47 0.04 | 12.520.04 | OSIRIS/SOAR | |
| J174510.1-290515 | XID 6262 | 17:45:10.18 | -29:05:15.2 | 17.74 0.17 | 14.15 0.04 | 12.23 0.04 | OSIRIS/SOAR | |
| J174527.8-290109 | XID 861 | 17:45:27.86 | -29:01:09.4 | 14.90 0.04 | 11.02 0.03 | 8.95 0.03 | OSIRIS/SOAR | |
| J174528.0-290023 | XID 885 | 17:45:28.02 | -29:00:23.0 | 14.46 0.03 | 12.59 0.03 | 11.48 0.04 | OSIRIS/SOAR | |
| J174528.5-285959 | XID 930 | 17:45:28.55 | -28:59:59.6 | 15.86 0.05 | 11.98 0.03 | 9.90 0.03 | OSIRIS/SOAR | |
| J174528.7-290942 | XID 6592 | 17:45:28.79 | -29:09:42.8 | - | 13.03 0.03 | 9.88 0.03 | OSIRIS/SOAR | symbiotic XRB; described above |
| J174528.8-285726 | XID 947 | 17:45:28.88 | -28:57:26.4 | 16.23 0.06 | 13.29 0.03 | 11.61 0.04 | OSIRIS/SOAR | O-type star; described above |
| J174529.0-290406 | XID 978 | 17:45:29.03 | -29:04:06.5 | 14.88 0.04 | 10.45 0.03 | 8.52 0.03 | OSIRIS/SOAR | |
| J174529.6-290227 | XID 1030 | 17:45:29.68 | -29:02:27.2 | 17.12 0.10 | 12.85 0.03 | 10.61 0.03 | OSIRIS/SOAR | |
| J174530.3-290341 | XID 1100 | 17:45:30.27 | -29:03:41.8 | 17.49 0.14 | 13.59 0.04 | 11.46 0.04 | OSIRIS/SOAR | |
| J174531.6-290048 | XID 1229 | 17:45:31.65 | -29:00:48.3 | 17.63 0.14 | 13.77 0.04 | 11.79 0.04 | OSIRIS/SOAR | |
| J174532.4-290126 | XID 1330 | 17:45:32.47 | -29:01:26.0 | 15.64 0.05 | 13.57 0.04 | 12.53 0.04 | OSIRIS/SOAR | |
| J174533.5-285540 | XID 1444 | 17:45:33.53 | -28:55:39.9 | - | 14.39 0.04 | 11.94 0.04 | OSIRIS/SOAR | |
| J174533.5-290759 | XID 6687 | 17:45:33.44 | -29:07:59.7 | - | 13.77 0.04 | 10.91 0.03 | OSIRIS/SOAR | |
| J174533.7-285728 | XID 1470 | 17:45:33.76 | -28:57:28.7 | 18.45 0.23 | 14.55 0.05 | 12.46 0.04 | OSIRIS/SOAR | |
| J174536.4-290227 | XID 1783 | 17:45:36.43 | -29:02:28.0 | 17.29 0.12 | 12.23 0.03 | 9.46 0.03 | OSIRIS/SOAR | |
| J174537.9-290134 | XID 1944 | 17:45:37.99 | -29:01:34.5 | 10.78 0.02 | 9.54 0.03 | 8.76 0.03 | OSIRIS/SOAR | O4-6 I; (Mauerhan et al., 2010a) |
| J174540.1-290055 | XID 2212 | 17:45:40.16 | -29:00:55.5 | 16.78 0.08 | 12.09 0.03 | 9.52 0.03 | OSIRIS/SOAR | |
| J174543.4-285841 | XID 2553 | 17:45:43.51 | -28:58:41.1 | 17.90 0.18 | 15.39 0.07 | 13.77 0.07 | LBT/LUCIFER | |
| J174544.4-285829 | XID 2642 | 17:45:44.47 | -28:58:29.9 | - | 13.26 0.03 | 10.54 0.03 | LBT/LUCIFER | |
| J174544.6-285806 | XID 2663 | 17:45:44.70 | -28:58:06.6 | 14.85 0.04 | 12.96 0.03 | 11.94 0.04 | LBT/LUCIFER | |
| J174546.9-285903 | XID 2870 | 17:45:46.88 | -28:59:03.2 | 16.27 0.06 | 13.23 0.03 | 11.73 0.04 | LBT/LUCIFER | |
| J174547.2-285816 | XID 2890 | 17:45:47.27 | -28:58:16.2 | 17.81 0.17 | 14.96 0.06 | 13.02 0.05 | LBT/LUCIFER | |
| J174547.7-285719 | XID 2931 | 17:45:47.75 | -28:57:19.8 | 18.09 0.22 | 15.01 0.06 | 13.38 0.06 | LBT/LUCIFER | |
| J174549.6-285704 | XID 3077 | 17:45:49.61 | -28:57:04.1 | 18.41 0.23 | 15.08 0.06 | 13.35 0.06 | LBT/LUCIFER | |
| J174550.5-290201 | XID 3145 | 17:45:50.53 | -29:02:01.6 | 15.41 0.04 | 11.83 0.03 | 9.87 0.03 | OSIRIS/SOAR | |
| J174551.2-285838 | XID 3178 | 17:45:51.21 | -28:58:39.2 | 14.27 0.03 | 13.53 0.04 | 13.06 0.05 | LBT/LUCIFER | |
| J174552.0-285507 | XID 3218 | 17:45:52.07 | -28:55:06.6 | 16.82 0.08 | 12.90 0.03 | 10.84 0.03 | LBT/LUCIFER | |
| J174552.9-285537 | XID 3275 | 17:45:52.97 | -28:55:37.0 | 17.69 0.16 | 14.75 0.05 | 13.08 0.05 | LBT/LUCIFER | B0-3e III;described above |
| J174554.0-285432 | XID 3334 | 17:45:54.11 | -28:54:33.1 | 18.78 0.25 | 15.45 0.07 | 13.82 0.08 | LBT/LUCIFER | |
| J174554.4-285455 | XID 3360 | 17:45:54.47 | -28:54:55.7 | 18.26 0.21 | 14.90 0.06 | 12.96 0.05 | LBT/LUCIFER | |
| J174554.8-285650 | XID 3390 | 17:45:54.82 | -28:56:50.5 | 12.15 0.02 | 11.98 0.03 | 11.87 0.04 | LBT/LUCIFER | |
| J174556.0-285056 | XID 7204 | 17:45:56.02 | -28:50:56.4 | 16.60 0.07 | 13.52 0.04 | 12.12 0.04 | OSIRIS/SOAR | |
| J174556.3-285054 | XID 7214 | 17:45:56.35 | -28:50:54.0 | 15.08 0.04 | 13.76 0.04 | 13.31 0.06 | OSIRIS/SOAR | |
| J174557.3-285353 | XID 3496 | 17:45:57.34 | -28:53:53.9 | 16.06 0.06 | 12.61 0.03 | 10.79 0.03 | LBT/LUCIFER | |
| J174558.1-285303 | XID 7266 | 17:45:58.19 | -28:53:03.8 | - | 13.79 0.04 | 11.54 0.03 | LBT/LUCIFER | |
| J174558.6-285511 | XID 3547 | 17:45:58.73 | -28:55:11.2 | 18.32 0.22 | 15.43 0.07 | 13.90 0.08 | LBT/LUCIFER | |
| J174559.7-290112 | XID 3593 | 17:45:59.79 | -29:01:12.8 | 15.66 0.04 | 11.99 0.03 | 10.10 0.03 | OSIRIS/SOAR | |
| J174604.8-285439 | XID 7440 | 17:46:04.74 | -28:54:38.7 | 17.28 0.12 | 13.40 0.03 | 11.47 0.04 | LBT/LUCIFER | |
| J174605.5-285319 | XID 3768 | 17:46:05.59 | -28:53:20.2 | 15.30 0.04 | 11.47 0.03 | 9.48 0.03 | OSIRIS/SOAR | |
| J174606.3-285313 | XID 7474 | 17:46:06.39 | -28:53:14.6 | 16.10 0.06 | 12.95 0.03 | 11.37 0.04 | LBT/LUCIFER | |
| J174607.6-285351 | XID 7497 | 17:46:07.72 | -28:53:52.3 | 16.75 0.08 | 13.44 0.04 | 11.75 0.04 | LBT/LUCIFER |
References
- Arnaud (1996) Arnaud, K. A. 1996, in Astronomical Society of the Pacific Conference Series, Vol. 101, Astronomical Data Analysis Software and Systems V, ed. G. H. Jacoby & J. Barnes, 17
- Baganoff et al. (2003) Baganoff, F. K., et al. 2003, ApJ, 591, 891
- Belczyński et al. (2000) Belczyński, K., Mikołajewska, J., Munari, U., Ivison, R. J., & Friedjung, M. 2000, A&AS, 146, 407
- Blum et al. (2003) Blum, R. D., Ramírez, S. V., Sellgren, K., & Olsen, K. 2003, ApJ, 597, 323
- Broos et al. (2010) Broos, P. S., Townsley, L. K., Feigelson, E. D., Getman, K. V., Bauer, F. E., & Garmire, G. P. 2010, ApJ, 714, 1582
- Carroll & Ostlie (1996) Carroll, B. W., & Ostlie, D. A. 1996, An Introduction to Modern Astrophysics, ed. Carroll, B. W. & Ostlie, D. A.
- Cash (1979) Cash, W. 1979, ApJ, 228, 939
- Castelli & Kurucz (1994) Castelli, F., & Kurucz, R. L. 1994, A&A, 281, 817
- Chakrabarty et al. (1998) Chakrabarty, D., van Kerkwijk, M. H., & Larkin, J. E. 1998, ApJ, 497, L39
- Cieslinski et al. (1994) Cieslinski, D., Elizalde, F., & Steiner, J. E. 1994, A&AS, 106, 243
- Clark & Steele (2000) Clark, J. S., & Steele, I. A. 2000, A&AS, 141, 65
- Davies (2007) Davies, R. I. 2007, MNRAS, 375, 1099
- Depoy et al. (1993) Depoy, D. L., Atwood, B., Byard, P. L., Frogel, J., & O’Brien, T. P. 1993, in Society of Photo-Optical Instrumentation Engineers (SPIE) Conference Series, Vol. 1946, Society of Photo-Optical Instrumentation Engineers (SPIE) Conference Series, ed. A. M. Fowler, 667–672
- DeWitt et al. (2010) DeWitt, C., Bandyopadhyay, R. M., Eikenberry, S. S., Blum, R., Olsen, K., Sellgren, K., & Sarajedini, A. 2010, ApJ, 721, 1663
- Ducati et al. (2001) Ducati, J. R., Bevilacqua, C. M., Rembold, S. B., & Ribeiro, D. 2001, ApJ, 558, 309
- Dupree (1986) Dupree, A. K. 1986, ARA&A, 24, 377
- Eikenberry et al. (2004) Eikenberry, S. S., et al. 2004, ApJ, 616, 506
- Eze (2011) Eze, R. N. C. 2011, Advances in Space Research, 47, 1999
- Hanson et al. (2005) Hanson, M. M., Kudritzki, R., Kenworthy, M. A., Puls, J., & Tokunaga, A. T. 2005, ApJS, 161, 154
- Hinkle et al. (1984) Hinkle, K. H., Scharlach, W. W. G., & Hall, D. N. B. 1984, ApJS, 56, 1
- Hyodo et al. (2008) Hyodo, Y., Tsujimoto, M., Koyama, K., Nishiyama, S., Nagata, T., Sakon, I., Murakami, H., & Matsumoto, H. 2008, PASJ, 60, 173
- Liedahl et al. (1995) Liedahl, D. A., Osterheld, A. L., & Goldstein, W. H. 1995, ApJ, 438, L115
- Lopes de Oliveira et al. (2010) Lopes de Oliveira, R., Smith, M. A., & Motch, C. 2010, A&A, 512, A22
- Lord (1992) Lord, S. 1992, A New Software Tool for Computing Earth’s Atmospheric Transmission of Near- and Far-Infrared Radiation, NASA Technical Memorandum 103957
- Luna et al. (2010) Luna, G. J. M., Sokoloski, J., Mukai, K., & Nelson, T. 2010, The Astronomer’s Telegram, 3053, 1
- Luna & Sokoloski (2007) Luna, G. J. M., & Sokoloski, J. L. 2007, ApJ, 671, 741
- Luna et al. (2008) Luna, G. J. M., Sokoloski, J. L., & Mukai, K. 2008, in Astronomical Society of the Pacific Conference Series, Vol. 401, RS Ophiuchi (2006) and the Recurrent Nova Phenomenon, ed. A. Evans, M. F. Bode, T. J. O’Brien, & M. J. Darnley, 342
- Martins & Plez (2006) Martins, F., & Plez, B. 2006, A&A, 457, 637
- Masetti et al. (2006) Masetti, N., Orlandini, M., Palazzi, E., Amati, L., & Frontera, F. 2006, A&A, 453, 295
- Masetti et al. (2002) Masetti, N., et al. 2002, A&A, 382, 104
- Matsunaga et al. (2009) Matsunaga, N., Kawadu, T., Nishiyama, S., Nagayama, T., Hatano, H., Tamura, M., Glass, I. S., & Nagata, T. 2009, MNRAS, 399, 1709
- Mauerhan et al. (2010a) Mauerhan, J. C., Cotera, A., Dong, H., Morris, M. R., Wang, Q. D., Stolovy, S. R., & Lang, C. 2010a, ApJ, 725, 188
- Mauerhan et al. (2007) Mauerhan, J. C., Muno, M. P., & Morris, M. 2007, ApJ, 662, 574
- Mauerhan et al. (2010b) Mauerhan, J. C., Muno, M. P., Morris, M. R., Stolovy, S. R., & Cotera, A. 2010b, ApJ, 710, 706
- Mikles et al. (2006) Mikles, V. J., Eikenberry, S. S., Muno, M. P., Bandyopadhyay, R. M., & Patel, S. 2006, ApJ, 651, 408
- Muerset et al. (1997) Muerset, U., Wolff, B., & Jordan, S. 1997, A&A, 319, 201
- Mukai et al. (2003) Mukai, K., Kinkhabwala, A., Peterson, J. R., Kahn, S. M., & Paerels, F. 2003, ApJ, 586, L77
- Muno et al. (2003) Muno, M. P., et al. 2003, ApJ, 589, 225
- Muno et al. (2009) —. 2009, ApJS, 181, 110
- Mürset & Schmid (1999) Mürset, U., & Schmid, H. M. 1999, A&AS, 137, 473
- Nespoli et al. (2010) Nespoli, E., Fabregat, J., & Mennickent, R. E. 2010, A&A, 516, A94
- Nishiyama et al. (2008) Nishiyama, S., Nagata, T., Tamura, M., Kandori, R., Hatano, H., Sato, S., & Sugitani, K. 2008, ApJ, 680, 1174
- Nishiyama et al. (2009) Nishiyama, S., Tamura, M., Hatano, H., Kato, D., Tanabé, T., Sugitani, K., & Nagata, T. 2009, ApJ, 696, 1407
- Oskinova (2005) Oskinova, L. M. 2005, MNRAS, 361, 679
- Predehl & Schmitt (1995) Predehl, P., & Schmitt, J. H. M. M. 1995, A&A, 293, 889
- Predehl & Truemper (1994) Predehl, P., & Truemper, J. 1994, A&A, 290, L29
- Provencal et al. (1998) Provencal, J. L., Shipman, H. L., Hog, E., & Thejll, P. 1998, ApJ, 494, 759
- Rayner et al. (2009) Rayner, J. T., Cushing, M. C., & Vacca, W. D. 2009, ApJS, 185, 289
- Reid (1993) Reid, M. J. 1993, ARA&A, 31, 345
- Reig (2011) Reig, P. 2011, Ap&SS, 332, 1
- Seifert et al. (2003) Seifert, W., et al. 2003, in Presented at the Society of Photo-Optical Instrumentation Engineers (SPIE) Conference, Vol. 4841, Society of Photo-Optical Instrumentation Engineers (SPIE) Conference Series, ed. M. Iye & A. F. M. Moorwood, 962–973
- Sion & Ready (1992) Sion, E. M., & Ready, C. J. 1992, PASP, 104, 87
- Smith et al. (2008) Smith, R. K., Mushotzky, R., Mukai, K., Kallman, T., Markwardt, C. B., & Tueller, J. 2008, PASJ, 60, 43
- Staubert et al. (1995) Staubert, R., Maisack, M., Kendziorra, E., Draxler, T., Finger, M. H., Fishman, G. J., Strickman, M. S., & Starr, C. H. 1995, Advances in Space Research, 15, 119
- Steele & Clark (2001) Steele, I. A., & Clark, J. S. 2001, A&A, 371, 643
- Steele et al. (1999) Steele, I. A., Negueruela, I., & Clark, J. S. 1999, A&AS, 137, 147
- Tomsick et al. (2011) Tomsick, J. A., Heinke, C., Halpern, J., Kaaret, P., Chaty, S., Rodriguez, J., & Bodaghee, A. 2011, ApJ, 728, 86
- van Kerkwijk et al. (2010) van Kerkwijk, M. H., Chang, P., & Justham, S. 2010, ApJ, 722, L157
- Wallace & Hinkle (1997) Wallace, L., & Hinkle, K. 1997, ApJS, 111, 445
- Warner et al. (2008) Warner, C., Gonzalez, A., & Eikenberry, S. 2008, FATBOY: Data Processing Pipeline for FLAMINGOS-II, Proceedings of the Astronomical Data Analysis Software and Systems Conference