Characterization of the Young Open Cluster G144.90.4 in the Camelopardalis OB1 Association
Abstract
Our star-count analysis of the Two Micron All Sky Survey point sources resulted in an identification of the star cluster G144.90.4. The cluster was found, but not characterized, by Glushkova et al. We show that the cluster is physically associated with the Cam OB1 association at a distance of about 1 kpc and with an age of 1–2 Myr. Pre-main sequence stars are identified, on the basis of photometric and proper motion data. A total of 91 additional OB star candidates was found in subgroups 1A and 1B, a significant increase from the currently known 43 OB stars. The OB members show an age spread that indicates a sustained star formation for at least the last 10–15 Myr. The young cluster G144.90.4 represents the latest episode of sequential star formation in this cloud complex.
1 Introduction
Hundreds of thousands of open clusters (OCs) should currently exist in the Milky Way galaxy based on the number of OCs present in the solar neighborhood (Piskunov et al., 2006). However, the databases of OCs (Dutra & Bica, 2001; Dias et al., 2002; Bica et al., 2003; Dutra et al., 2003; Kronberger et al., 2006; Froebrich et al., 2007) contain only a few thousand entries that are limited to OCs within 1 kpc. This discrepancy is due partly to dust extinction in the Galactic plane, and partly to a lack of comprehensive all-sky searches for distant systems.
Star clusters are groupings of member stars in a six-dimensional phase space in position and motion. Kinematic studies of star clusters require special instrumentation and are often time-consuming. Initial identification of a star cluster via space grouping, i.e., by the “star-count” technique is relatively straightforward and has been exploited efficiently on wide-field or all-sky surveys (Schmeja, 2011). The Two Micron All Sky Survey point source catalog (2MASS; Cutri et al., 2003) provides a uniformly calibrated database of the entire sky in the near-infrared (NIR) wavebands, which allows us to recognize OCs even with moderate dust extinction, i.e., partially embedded, young star clusters. Earlier works by Bica et al. (2003), Dutra et al. (2003), and Froebrich et al. (2007) have indeed found hundreds of previously unknown infrared clusters using the 2MASS catalog.
We have developed a star-count technique to recognize star density enhancements and have applied it to the sky within using the 2MASS data. Hundreds of density peaks were found. We then used the SIMBAD database to match these peaks with known sources within a radius of 5′, resulting in 501 OCs, 89 globular clusters, 35 galaxies, 55 galaxy clusters, 11 H II regions, and 24 regions contaminated by neighboring bright stars. A total of 5 candidates remain unaccounted for. One such density peak is G144.90.4 (designated as G144) located at and , or R.A. (J2000), decl. (J2000) , seen toward the Camelopardalis (Cam) OB1 association (Lin et al., 2012). This cluster candidate was recognized by Glushkova et al. (2010), who used a pipeline (Koposov et al., 2008) to search for star clusters with 2MASS data. However, the cluster candidate was not well characterized by their pipeline, apparently because of the nebulous contamination. The full results of our OC finding will be reported elsewhere. Here we present a characterization of this cluster using photometric and proper motion (PM) measurements, and discuss the context of the cluster amid the OB association and cloud complex.
2 Photometric, Kinematic, and Spectroscopic Data
Our data consist of the 2MASS and WISE infrared magnitudes, PPMXL PMs,
and our own photometric and spectroscopic observations.
2MASS.
The NIR magnitudes for point sources have been obtained from 2MASS to the
10 limiting magnitudes of (1.25 µm), (1.65 µm)
, and (2.17 µm), respectively. For our star count
analysis, we included only stars with a photometric quality flag better than
“CCC”, which effectively gives a signal-to-noise ratio
and a photometric uncertainty
of mag in every band to ensure completeness. Subsequently, to
characterize clusters we constrained only stars with a photometric quality
flag of “AAA”, which corresponds to a and a photometric
uncertainty of mag in every band for photometric accuracy.
WISE.
The Wide-field Infrared Survey Explorer mapped the whole sky at 3.4,
4.6, 12, and 22 µm (designated as , , , ) with an
angular resolution of 61, 64, 65, and 120, and a
5 point-source sensitivity of 0.08, 0.11, 1 and 6 mJy, respectively,
corresponding to Vega magnitudes of , , ,
and (WISE; Wright et al., 2010). We exploited the identification
scheme to search for potential young stellar objects (YSOs) used by
Koenig et al. (2012). The WISE point sources within the cluster region are
extracted from Vizier.111http://vizier.u-strasbg.fr/ Only
sources having 2MASS counterparts are included in the analysis.
PPMXL.
In addition to photometric data, kinematic information is also employed to
secure the membership in a star cluster. The PPMXL Catalog (Röser et al., 2010)
contains stars down to about mag and lists the USNO-B1.0 PMs
(Monet et al., 2003) and 2MASS magnitudes. The stars with PM uncertainties
mas yr-1 have not been used in our analysis.
Tenagra.
Narrow-band imaging observations were carried out using the Tenagra II
0.81 meter /7 telescope in Arizona on 2012 March 30. The CCD camera used
an SITe chip with pixels and a pixel size of
08, rendering a field of view of arcmin2 on
the sky. The total exposure times were 540 s for the H and bands,
and 300 s for the band. All images were reduced with standard routines,
including dark and bias subtraction and flat-field normalization.
SExtractor222http://www.astromatic.net/software/sextractor was
used for photometry. The stellar astrometric solution calibrated with the
2MASS coordinates was calculated with the astrometry package from
Astrometry.net.333http://astrometry.net/ The Tenagra data
reached about mag. Supplementary H data for fainter stars
were taken from the INT/WFC Photometric H Survey of the Northern
Galactic Plane (IPHAS; Drew et al., 2005).
HCT and LOT.
Follow-up spectroscopic observations were taken using the HFOSC on the
Himalayan Chandra Telescope (HCT) with a slit width of and Grism 8
(– Å, dispersion = 1.45 Å pixel-1) on
2012 July 26. Additional spectra were taken using the Hiyoyu spectrograph on
the Lulin One-meter Telescope (LOT) with a slit width of and grating
of 300 mm-1 (– Å) on the night of 2012 November
15. A one-dimensional spectrum was extracted from the dark, bias-subtracted
and flat-field-corrected image in the standard manner using IRAF. The
wavelength calibration was done using FeNe (HCT) or HeNeAr (LOT) lamp
sources.
3 Characterization of the Cluster
G144 was first recognized by Glushkova et al. (2010), who used the pipeline developed by Koposov et al. (2008) to search for density peaks in a star catalog as star clusters. They found 153 previously unknown clusters within the Galactic latitude , 23 of which were considered to be embedded star clusters and were not characterized by their pipeline. This candidate was also detected as a density peak by our pipeline. In this section, we present the properties of the cluster derived from our analysis.
3.1 Density Enhancements and Radial Density Profile
We selected the 2MASS point sources with in bands within 15′ of the apparent center of the cluster. Figure 1 shows the stellar density map for which the number of stars in a grid, whose scale was chosen to include an average of 10 stars, was counted. The resulting density map was then smoothed with a grid width. For G144, a background density of stars arcmin-2 was estimated by clipping of the density outliers. A grid in the smoothed density map above the background would be considered a high-density region, and a grouping of more than three connected high-density regions would be identified as a density enhancement, i.e., a cluster candidate. The density map around G144 is shown in Figure 1.
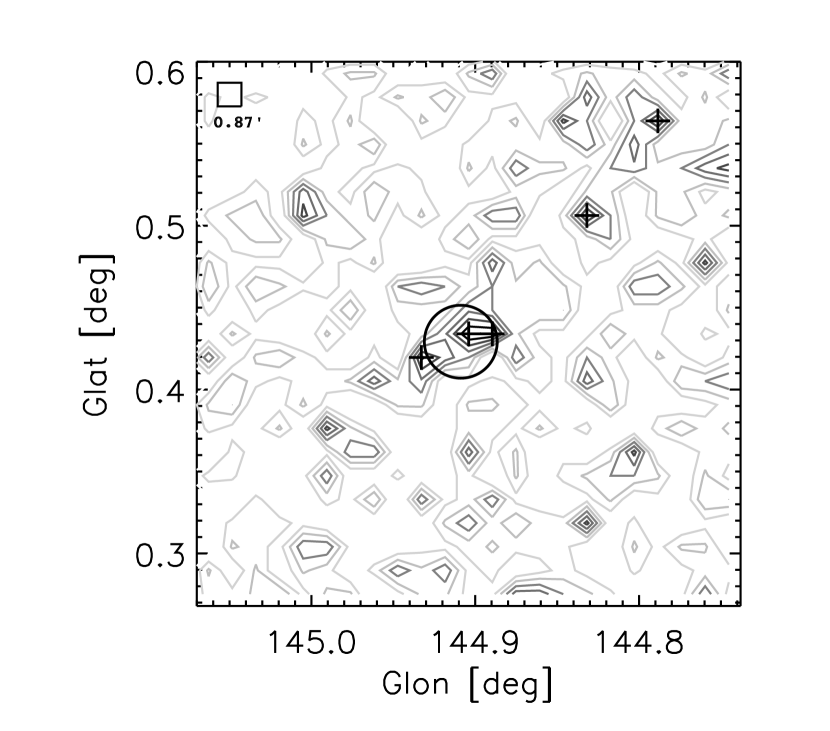
We estimated the size of G144 based on the radial density profile, though the cluster appears slightly elongated in shape. As seen in Figure 2, the density starts to blend with the field at a radius of . We therefore adopted a radius of for the cluster in subsequent analysis. Spatially the cluster is seen near the Cam OB1 association and is likely physically related to it.

3.2 Proper Motion Members
Cluster members share the same age, metallicity, distance, PMs, etc. Accordingly, common PMs would be a necessary condition for cluster membership. The Cam OB1 association was first investigated by Morgan et al. (1953), who found eight early-type stars aggregated at a distance of pc. Several studies , e.g., Haug (1970), Humphreys (1978), and Lyder (2001), append the members of Cam OB1. However, the Cam OB1 members spread over an area on the sky of deg2 corresponding to a physical dimension of pc2, making a coeval formation of the Cam OB1 impossible (de Zeeuw et al., 1999). Straižys & Laugalys (2007a) divided the association into three subgroups—1A, 1B, and 1C—and found them all at nearly the same distance of kpc. G144 is located between 1A and 1B, which contain 30 and 13 OB stars, respectively (Straižys & Laugalys, 2007a). The other subgroup, 1C, has 76 known members mainly from NGC 1502 (Weitenbeck, 1997).
To provide the criteria for selecting PM members in G144, we first extracted the PPMXL PMs of the known OB stars. The same data would also allow us to identify faint OB members that might have escaped recognition in previous works. The derived PPMXL PMs of each subgroup are , , mas yr-1 for 1A, , , mas yr-1 for 1B, and , , mas yr-1 for 1C. Indeed the three subgroups share similar PMs, suggesting a physical association. The parameters for the three subgroups, including the PMs, are summarized in Table 1.
| Subgroup | , | Angular Size | Distance | Age | No. of Stars | ddDerived from PPMXL. | ddDerived from PPMXL. |
|---|---|---|---|---|---|---|---|
| (deg) | (deg) | (pc) | (Myr) | (mas yr-1 ) | (mas yr-1 ) | ||
| 1A | aaStraižys & Laugalys (2007a). | 30aaStraižys & Laugalys (2007a). | |||||
| 1B | aaStraižys & Laugalys (2007a). | 13aaStraižys & Laugalys (2007a). | |||||
| 1C | 0.1 | ccPaunzen et al. (2005). | 76bbMostly NGC 1502 members (Weitenbeck, 1997). |
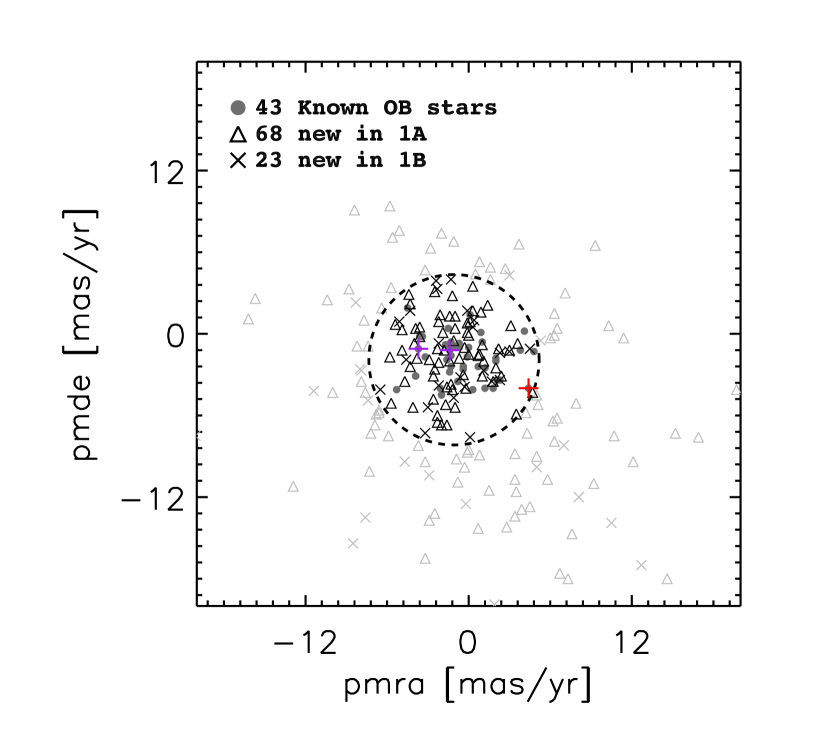
To identify previously unknown OB stars, we select stars within the same area deg2, as that of the known Cam OB1 association centered on Cam OB1A and 1B, respectively, which are (1) photometrically consistent with OB spectral types in the NIR color–magnitude diagram (CMD), and (2) kinematically consistent with the systemic PM of the 1A and 1B subgroups. The CMD criteria are 2MASS brighter than 13.0 mag and mag. Only stars with photometric uncertainties better than 0.02 mag in every 2MASS band were considered. The PM criteria include uncertainties less than 5 mas yr-1 and within the 3 range of the mean PM of 1A and 1B, as shown in Figure 3. Table 2 lists the 68 and 23 newly found OB stars in 1A and 1B, respectively. The first column gives the numerical identification of the stars, in order of descending brightness, followed bysubsequent columns listing the Galactic coordinates, 2MASS magnitudes, and PPMXL PMs of each star. The last column lists the data belonging in 1A or 1B. The photometric and color properties of these newly found OB stars will be discussed later together with the cluster members.
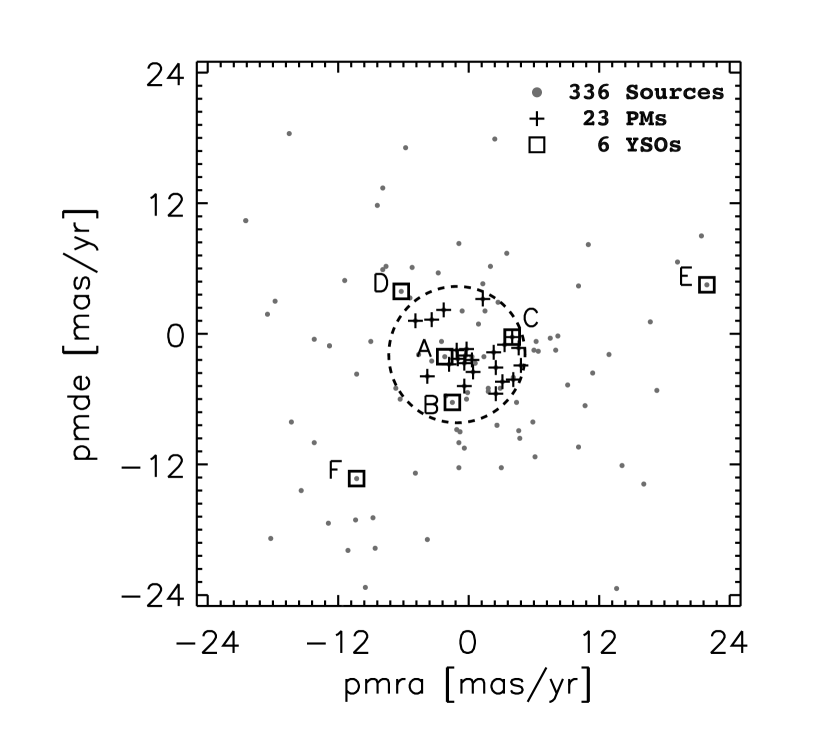
For cluster members, there are 23 stars that are spatially within the 35 radius and kinematically within the 3 range of the average PM of the known OB stars, as shown in Figure 4 and listed in Table 3. Again, only stars with PPMXL uncertainties less than 5 mas yr-1 were selected. The PM candidates need to be further winnowed by photometric selection as discussed in the next section.
| ID | Comments | ||||||
|---|---|---|---|---|---|---|---|
| (deg) | (mag) | (mag) | (mag) | (mas yr-1 ) | (mas yr-1 ) | ||
| 1 | 6.68 | 6.53 | 6.44 | 1A | |||
| 2 | 7.31 | 7.14 | 7.02 | 1A | |||
| 3 | 8.31 | 8.31 | 8.26 | 1A | |||
| 4 | 8.73 | 8.65 | 8.57 | 1A | |||
| 5 | 8.89 | 8.82 | 8.76 | 1A | |||
| 6 | 9.16 | 9.05 | 8.95 | 1A | |||
| 7 | 9.23 | 9.19 | 9.12 | 1A | |||
| 8 | 9.26 | 9.17 | 9.12 | 1A | |||
| 9 | 9.29 | 9.19 | 9.10 | 1A | |||
| 10 | 9.30 | 9.29 | 9.25 | 1A | |||
| 11 | 9.39 | 9.37 | 9.32 | 1A | |||
| 12 | 9.55 | 9.44 | 9.37 | 1A | |||
| 13 | 9.73 | 9.65 | 9.60 | 1A | |||
| 14 | 9.79 | 9.63 | 9.53 | 1A | |||
| 15 | 9.83 | 9.75 | 9.69 | 1A | |||
| 16 | 9.95 | 9.80 | 9.71 | 1A | |||
| 17 | 9.95 | 9.78 | 9.68 | 1A | |||
| 18 | 9.96 | 9.82 | 9.76 | 1A | |||
| 19 | 10.04 | 9.86 | 9.76 | 1A | |||
| 20 | 10.06 | 9.95 | 9.87 | 1A | |||
| 21 | 10.25 | 10.17 | 10.12 | 1A | |||
| 22 | 10.27 | 10.28 | 10.28 | 1A | |||
| 23 | 10.35 | 10.15 | 10.10 | 1A | |||
| 24 | 10.37 | 10.22 | 10.17 | 1A | |||
| 25 | 10.40 | 10.20 | 10.15 | 1A | |||
| 26 | 10.41 | 10.22 | 10.14 | 1A | |||
| 27 | 10.46 | 10.35 | 10.27 | 1A | |||
| 28 | 10.46 | 10.32 | 10.24 | 1A | |||
| 29 | 10.46 | 10.38 | 10.29 | 1A | |||
| 30 | 10.49 | 10.40 | 10.31 | 1A | |||
| 31 | 10.50 | 10.37 | 10.27 | 1A | |||
| 32 | 10.51 | 10.35 | 10.28 | 1A | |||
| 33 | 10.56 | 10.42 | 10.31 | 1A | |||
| 34 | 10.56 | 10.42 | 10.35 | 1A | |||
| 35 | 10.59 | 10.44 | 10.29 | 1A | |||
| 36 | 10.63 | 10.52 | 10.48 | 1A | |||
| 37 | 10.66 | 10.55 | 10.48 | 1A | |||
| 38 | 10.67 | 10.54 | 10.47 | 1A | |||
| 39 | 10.70 | 10.53 | 10.43 | 1A | |||
| 40 | 10.76 | 10.66 | 10.60 | 1A | |||
| 41 | 10.77 | 10.59 | 10.54 | 1A | |||
| 42 | 10.78 | 10.77 | 10.71 | 1A | |||
| 43 | 10.82 | 10.67 | 10.48 | 1A | |||
| 44 | 10.85 | 10.66 | 10.53 | 1A | |||
| 45 | 10.86 | 10.74 | 10.67 | 1A | |||
| 46 | 10.88 | 10.69 | 10.58 | 1A | |||
| 47 | 10.95 | 10.80 | 10.73 | 1A | |||
| 48 | 10.98 | 10.90 | 10.78 | 1A | |||
| 49 | 10.99 | 10.89 | 10.82 | 1A | |||
| 50 | 11.01 | 10.89 | 10.82 | 1A | |||
| 51 | 11.02 | 10.84 | 10.74 | 1A | |||
| 52 | 11.04 | 10.91 | 10.83 | 1A | |||
| 53 | 11.07 | 10.93 | 10.87 | 1A | |||
| 54 | 11.09 | 10.90 | 10.80 | 1A | |||
| 55 | 11.10 | 11.01 | 10.91 | 1A | |||
| 56 | 11.16 | 11.04 | 10.95 | 1A | |||
| 57 | 11.19 | 11.07 | 11.02 | 1A | |||
| 58 | 11.22 | 11.06 | 10.96 | 1A | |||
| 59 | 11.24 | 11.04 | 10.95 | 1A | |||
| 60 | 11.35 | 11.16 | 11.09 | 1A | |||
| 61 | 11.38 | 11.24 | 11.16 | 1A | |||
| 62 | 11.42 | 11.24 | 11.13 | 1A | |||
| 63 | 11.45 | 11.26 | 11.19 | 1A | |||
| 64 | 11.49 | 11.32 | 11.21 | 1A | |||
| 65 | 11.53 | 11.43 | 11.33 | 1A | |||
| 66 | 11.53 | 11.39 | 11.34 | 1A | |||
| 67 | 11.59 | 11.46 | 11.37 | 1A | |||
| 68 | 11.88 | 11.73 | 11.63 | 1A | |||
| 1 | 6.04 | 5.89 | 5.83 | 1B | |||
| 2 | 9.32 | 9.20 | 9.10 | 1B | |||
| 3 | 9.50 | 9.43 | 9.36 | 1B | |||
| 4 | 9.54 | 9.39 | 9.31 | 1B | |||
| 5 | 9.91 | 9.85 | 9.81 | 1B | |||
| 6 | 9.94 | 9.83 | 9.73 | 1B | |||
| 7 | 10.21 | 10.15 | 10.07 | 1B | |||
| 8 | 10.40 | 10.29 | 10.19 | 1B | |||
| 9 | 10.42 | 10.31 | 10.22 | 1B | |||
| 10 | 10.44 | 10.37 | 10.28 | 1B | |||
| 11 | 10.84 | 10.64 | 10.56 | 1B | |||
| 12 | 10.86 | 10.68 | 10.60 | 1B | |||
| 13 | 10.87 | 10.75 | 10.70 | 1B | |||
| 14 | 11.07 | 10.93 | 10.85 | 1B | |||
| 15 | 11.14 | 10.97 | 10.84 | 1B | |||
| 16 | 11.52 | 11.47 | 11.39 | 1B | |||
| 17 | 11.52 | 11.39 | 11.30 | 1B | |||
| 18 | 11.59 | 11.39 | 11.27 | 1B | |||
| 19 | 11.59 | 11.43 | 11.34 | 1B | |||
| 20 | 11.72 | 11.58 | 11.49 | 1B | |||
| 21 | 11.86 | 11.67 | 11.56 | 1B | |||
| 22 | 11.99 | 11.89 | 11.82 | 1B | |||
| 23 | 12.05 | 11.87 | 11.80 | 1B |
3.3 Young Stellar Objects
Straižys & Laugalys (2007b) have used infrared photometric data extracted from 2MASS, IRAS and MSX to identify 35 YSOs in a region deg2 toward the Cam OB1 association, none of which are located within G144. Nonetheless, nebulosity is clearly seen around G144, suggesting a young age. Generally, YSOs are identified by their infrared excess, H emission, or X-ray emission. No X-ray data are available in the region, so we used 2MASS and WISE to identify possible YSOs or embedded stars in G144.
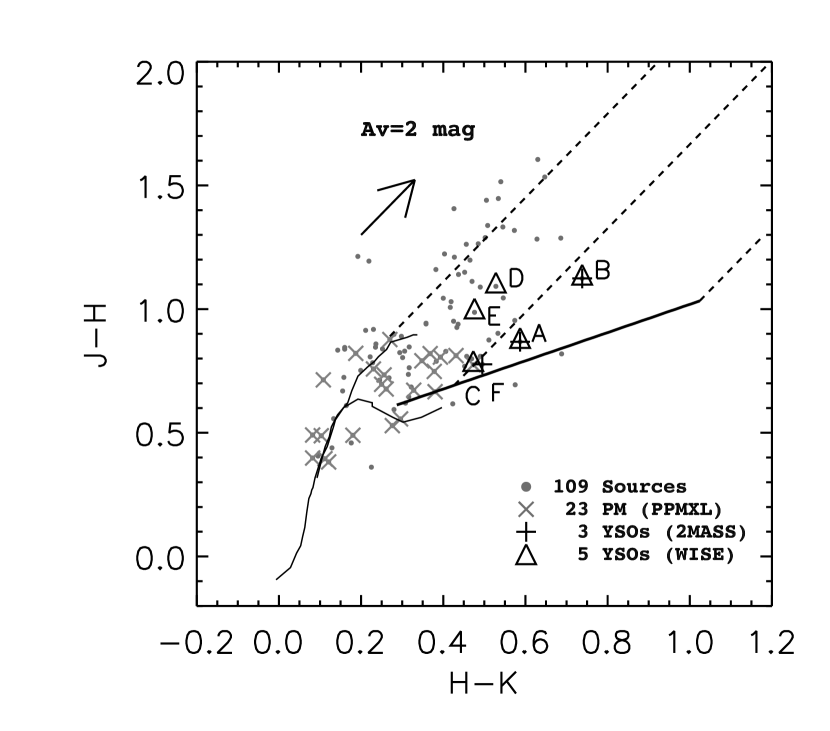
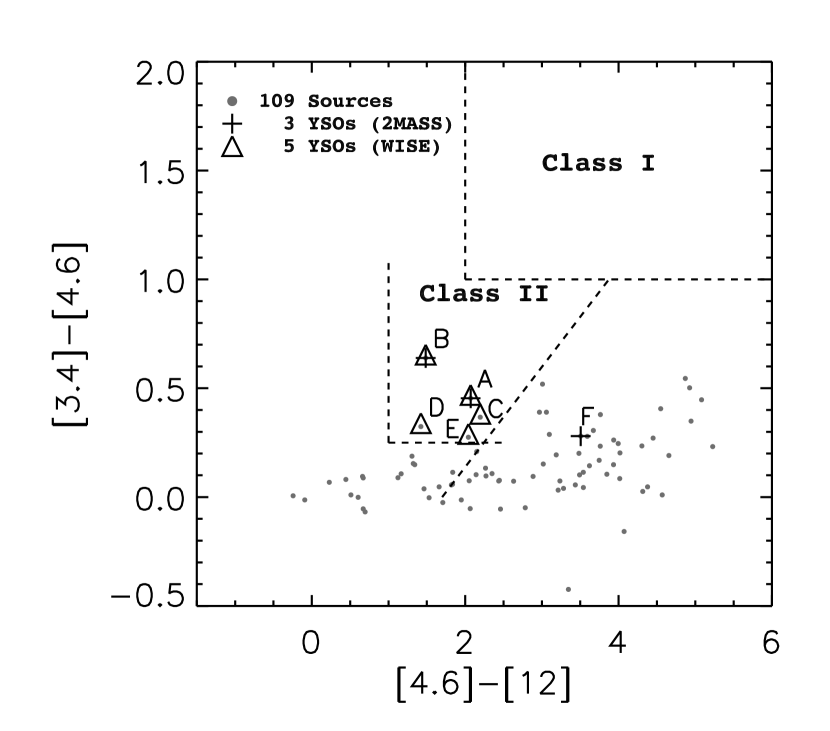
The NIR-excess sources were identified using the 2MASS versus and WISE versus color-color diagrams, shown in Figure 5 and Figure 6. Three classical T Tauri (CTTS; class II objects) candidates were found in the empirical CTTS region (Meyer et al., 1997) in the 2MASS color-color diagram. On the other hand, using the criteria adopted by Koenig et al. (2012), five CTTS candidates were identified on the basis of the WISE colors, two of which coincide with the 2MASS sources. Therefore, a total of six CTTS candidates are selected, whose coordinates, 2MASS and WISE magnitudes, and PPMXL PMs are listed in Table 4. The first column gives the alphabetical identification of the star, in order of descending brightness, followed by subsequent columns of Galactic coordinates, 2MASS as well as WISE magnitudes, and PPMXL PM of each star. The last column lists the data used for the classification.
| ID | ||||||
|---|---|---|---|---|---|---|
| (deg) | (mag) | (mag) | (mag) | (mas yr-1 ) | (mas yr-1 ) | |
| 1 | 11.89 | 11.50 | 11.41 | |||
| 2 | 11.93 | 11.25 | 10.99 | |||
| 3 | 12.28 | 11.53 | 11.15 | |||
| 4 | 12.71 | 12.04 | 11.71 | |||
| 5 | 12.96 | 12.15 | 11.76 | |||
| 6 | 13.12 | 12.74 | 12.62 | |||
| 7 | 13.14 | 12.35 | 12.00 | |||
| 8 | 13.40 | 12.91 | 12.81 | |||
| 9 | 13.43 | 12.94 | 12.86 | |||
| 10 | 13.66 | 13.26 | 13.15 | |||
| 11 | 13.69 | 13.20 | 13.02 | |||
| 12 | 13.94 | 13.16 | 12.69 | |||
| 13 | 14.58 | 13.91 | 13.53 | |||
| 14 | 14.63 | 13.87 | 13.64 | |||
| 15 | 14.67 | 13.97 | 13.72 | |||
| 16 | 14.73 | 13.92 | 13.49 | |||
| 17 | 14.85 | 14.29 | 14.00 | |||
| 18 | 14.90 | 14.19 | 14.08 | |||
| 19 | 14.92 | 14.10 | 13.91 | |||
| 20 | 14.92 | 14.39 | 14.11 | |||
| 21 | 15.13 | 14.31 | 13.94 | |||
| 22 | 15.43 | 14.69 | 14.44 | |||
| 23 | 15.91 | 15.04 | 14.77 |
| ID | Comments | ||||||||||
|---|---|---|---|---|---|---|---|---|---|---|---|
| (deg) | (mag) | (mag) | (mag) | (mag) | (mag) | (mag) | (mag) | (mas yr-1 ) | (mas yr-1 ) | ||
| A | 11.4 | 10.6 | 10.0 | 9.4 | 9.0 | 6.9 | 2.9 | WISE; 2MASS | |||
| B | 13.4 | 12.3 | 11.6 | 10.5 | 9.8 | 8.3 | 6.6 | WISE; 2MASS | |||
| C | 13.9 | 13.2 | 12.7 | 12.1 | 11.7 | 9.5 | 5.3 | WISE | |||
| D | 14.2 | 13.1 | 12.6 | 11.9 | 11.6 | 10.2 | 6.1 | WISE | |||
| E | 16.1 | 15.1 | 14.6 | 14.5 | 14.2 | 12.1 | 8.7 | WISE; non-member | |||
| F | 16.2 | 15.4 | 14.9 | 14.8 | 14.5 | 11.0 | 8.6 | 2MASS; non-member |
The IPHAS and narrow-band H magnitudes are used to single out stars with possible H emission. Figure 7 shows the H versus -band magnitude. Star A, the brightest among our CTTS candidates, is some mag brighter in H than a “normal” star, defined as a star following the trend between the H- and -band magnitudes for the majority of stars in the field. Subsequent HCT spectroscopic observations confirmed an emission spectrum for star A, as seen in Figure 8. On the basis of the NIR excess and the emission-line spectrum, we conclude that star A, located near the center of G144, should be a CTTS.
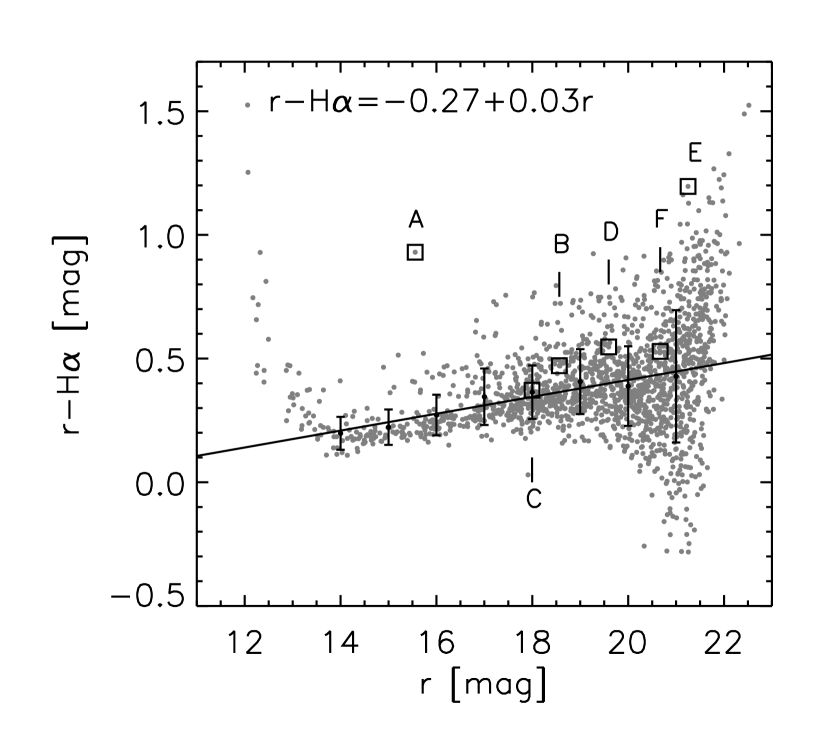
For other YSO candidates, star B, located near the nebulosity edge, has the most reddened NIR colors among our candidates, and is a CTTS candidate judging by both 2MASS and WISE colors. It may have weak H emission (see Figure 7), but, unfortunately, was too faint for our spectroscopic observations. Star B is likely a CTTS. Both stars C and D are both marginal candidates in terms of their PMs and WISE colors. Their 2MASS colors do not stand out, though star D, with possible H in emission, is much more reddened than star C. Both stars E and F are very faint, so have large uncertainties in their PM measurements. They are marginal cases in either 2MASS or WISE colors, and seem to have motions inconsistent with membership. Hence, stars E and F should be classified as field stars.

3.4 Extinction, Distance, and Age
The average interstellar extinction to the cluster was estimated by tracing each of the 23 PM candidates back to the MS locus along the reddening vector in the 2MASS color-color diagram (see Figure 5). An average extinction of mag was derived. Figure 9 plots the versus CMD for the Cam OB1 subgroups 1A and 1B, as well as for G144. In each case, a zero-age main-sequence (ZAMS) is shown with solar metallicity444Available from the Padova isochrone database http://stev.oapd.inaf.it/cgi-bin/cmd. at a distance of kpc with corresponding extinction and reddening.
The 1C subgroup has a well constrained age ( Myr) and distance ( kpc) because of the cluster NGC 1502 (Tapia et al., 1991; Paunzen et al., 2005). A possible abnormal interstellar reddening has been suggested, as diagnosed by the total-to-selective extinction, from 2.42 (Tapia et al., 1991) to 2.57 (Pandey et al., 2003), as compared to the average in the diffuse interstellar medium. A reduced value of is indicative of a smaller than typical average grain size, likely as the consequence of photoevaporation by OB stars in the region. The variation of has little effect on our analysis of the properties of G144.
The cluster G144 therefore is at the same distance as the Cam OB1 association which makes it physically a part of that association. The newly found OB stars in 1A (Figure 9, left panel) and 1B (Figure 9, right panel) considerably augment the OB star inventory in the region. For G144 (Figure 9, middle panel), most PM candidates are distributed along the ZAMS. YSO candidates such as stars A, B, and D are located above the MS, i.e., at ages of Myr and have NIR excess. The existence of CTTSs sets a stringent age limit for the cluster—no more than a couple of megayears.
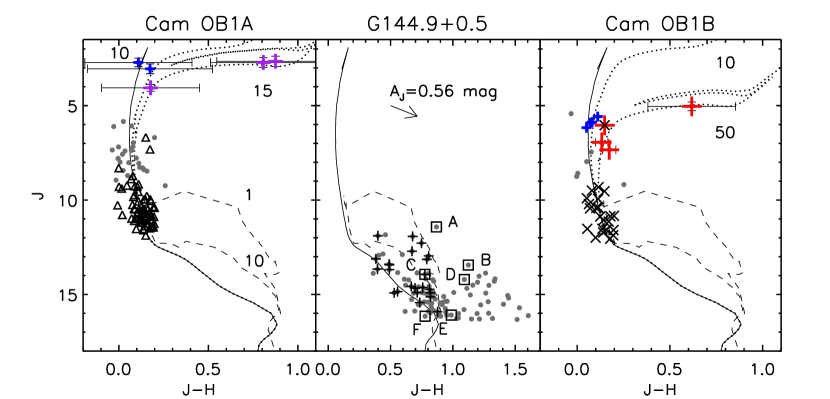
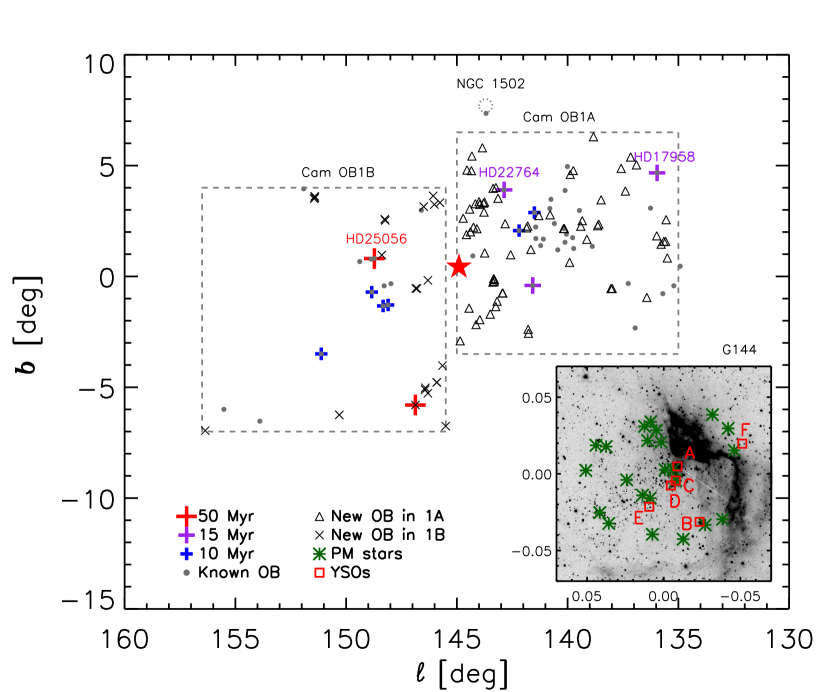
Figure 10 illustrates the positional distribution of the young stellar population in Cam OB1. Subgroup 1B is associated with a molecular cloud ring (Straižys & Laugalys, 2008). It is conceivably a remnant bubble created by a supernova, devoid of gas and dust, and the newly found OB stars in 1B, like the known sample, are distributed outside the ring. The OB stars in 1B are also collectively spread toward 1A. The cloud complex in 1A and 1B has a filamentary shape (see Figure 1 in Straižys & Laugalys, 2008), along which the majority of the young stars are densely populated.
It has been proposed that Cam OB1 has sustained star formation for the last 100 Myr, with a stellar age progressively younger toward the northern part of the complex (Lyder, 2001). A few evolved member candidates shed crucial light on the star formation history in the region. In Figure 9, one sees a handful of candidates in 1A along the 10–15 Myr post-MS isochrones. In particular, two very bright candidates, HD 22764 (spectral type of K4 Ib) and HD 17958 (spectral type of K3 Ib), could be as old as 15 Myr. Both are well within the spatial (see Figure 10) and PM (see Figure 3) groupings like other members. Thus the age spread in 1A should be secure.
In 1B, candidates considerably older. One candidate suggests an age as old as 50 Myr. This star, HD 25056 (spectral type of G0 Ib), has a marginal PM (near the boundary circle in Figure 3) and is relatively isolated in location (see Figure 10); its membership, and hence its isochrone age, is less secure. The subgroup 1B is at least up to 10–15 Myr old. It is also possible that, from the distribution of young stars, 1B formed as the consequence of the “collect-and-collapse” mechanism (Elmegreen & Lada, 1977; Deharveng et al., 2005; Zavagno et al., 2006) with which massive stars sweep ambient material via their photoionization pressure or supernova shocks, so dense clumps are collected in a shell collapse to form the next-generation stars. What we witness in G144 is the result of the most recent star birth in this cloud complex.
4 Conclusions
We used photometric, spectroscopic, and kinematic data to characterize the open cluster candidate G144 found in our OC search pipeline. The cluster is found to be a part of the Cam OB1 association. A total of 23 member candidates have been identified, some still in the pre-main sequence stage, which are distributed within an angular diameter of at a distance of 1 kpc, this corresponds to a linear scale of pc across. The cluster is no more than a couple of megayears old.
Moreover, we identified a total of 91 additional OB star candidates in subgroups 1A and 1B on the basis of the PMs of 43 known OB members. Cam OB1 is associated with a molecular cloud complex and is shown to have undergone sustained star formation in subgroups 1A and 1B (and also 1C which is not studied here) for at least the last 10–15 Myr. The open cluster G144 appears to highlight the latest episode of sequential star formation in the region.
References
- Bessell & Brett (1988) Bessell, M. S., & Brett, J. M. 1988, PASP, 100, 1134
- Bica et al. (2003) Bica, E., Dutra, C. M., Soares, J. & Barbuy, B. 2003, A&A, 404, 223
- Cutri et al. (2003) Cutri, R. M., Skrutskie, M. F., van Dyk, S., et al. 2003, yCat, 2246, 0
- Deharveng et al. (2005) Deharveng, L., Zavagno, A., & Caplan, J. 2005, A&A, 433, 565
- de Zeeuw et al. (1999) de Zeeuw, P. T., Hoogerwerf, R., de Bruijne, J. H. J., Brown, A. G. A., & Blaauw, A. 1999, AJ, 117, 354
- Dias et al. (2002) Dias, W. S., Alessi, B. S., Moitinho, A., & Lépine, J. R. D. 2002, A&A, 389, 871
- Drew et al. (2005) Drew, J. E., Greimel, R., Irwin, M. J., et al. 2005, MNRAS, 362, 753
- Dutra & Bica (2001) Dutra, C. M., & Bica, E. 2001, A&A, 376, 434
- Dutra et al. (2003) Dutra, C. M., Bica, E., Soares, J., & Burbuy, B. 2003, A&A, 400, 533
- Elmegreen & Lada (1977) Elmegreen, B. G., & Lada, C. J. 1977, ApJ, 214, 725
- Froebrich et al. (2007) Froebrich, D., Scholz, A., & Raftery, C. L. 2007, MNRAS, 374, 399
- Girardi et al. (2002) Girardi, L., Bertelli, G., Bressan, A., et al. 2002, A&A, 391, 195
- Glushkova et al. (2010) Glushkova, E. V., Koposov, S. E., Zolotukhin, I. Y., et al. 2010, AstL, 36, 75
- Haug (1970) Haug, U. 1970, A&AS, 1, 35
- Humphreys (1978) Humphreys, R. M. 1978, ApJS, 38, 309
- Koenig et al. (2012) Koenig, X. P., Leisawitz, D. T., Benford, D. J., et al. 2012, ApJ, 744, 130
- Koposov et al. (2008) Koposov, S., Belokurov, V., Evans, N. W., et al. 2008, ApJ, 686, 279
- Kronberger et al. (2006) Kronberger, M., Teutsch, P., Alessi, B., et al. 2006, A&A, 447, 921
- Lin et al. (2012) Lin, C. C., Chen, W. P., Panwar, N. 2012, in AIP Conf. Proc. 1543, First International Conference on Chemical Evolution of Star Forming Region and Origin of Life: Astrochem2012, ed. S. K. Chakrabarti, K. Acharyya, & A. Das (Melville, NY: AIP), 120
- Lyder (2001) Lyder, D. A. 2001, AJ, 122, 2634
- Meyer et al. (1997) Meyer, M. R., Calvet, N., & Hillenbrand, L. A. 1997, AJ, 114, 288
- Monet et al. (2003) Monet, D. G., Levine, S. E., Canzian, B., et al. 2003, AJ, 125, 984
- Morgan et al. (1953) Morgan, W. W., Whitford, A. E., & Code, A. D. 1953, ApJ, 118, 318
- Pandey et al. (2003) Pandey, A. K., Upadhyay, K., Nakada, Y., & Ogura, K. 2003, A&A, 397, 191
- Paunzen et al. (2005) Paunzen, E., Netopil, M., Iliev, I. K., et al. 2005, A&A, 443, 157
- Piskunov et al. (2006) Piskunov, A. E., Kharchenko, N. V., Röser, S., Schilbach, E. & Scholz, R.-D. 2006, A&A, 445, 545
- Rieke & Lebofsky (1985) Rieke, G. H., & Lebofsky, M. J. 1985, ApJ, 288, 618
- Röser et al. (2010) Röser, S., Demleitner, M., & Schilbach, E. 2010, AJ, 139, 2440
- Schmeja (2011) Schmeja, S. 2011, AN, 332, 172
- Siess et al. (2000) Siess, L., Dufour, E., & Forestini, M. 2000, A&A, 358, 593
- Straižys & Laugalys (2007a) Straižys, V., & Laugalys, V. 2007a, BaltA, 16, 167
- Straižys & Laugalys (2007b) Straižys, V., & Laugalys, V. 2007b, BaltA, 16, 327
- Straižys & Laugalys (2008) Straižys, V., & Laugalys, V. 2008, in Handbook of Star Forming Regions, Volume I. The Northern Sky, ed. B. Reipurth, (San Francisco, CA: ASP), 294
- Tapia et al. (1991) Tapia, M., Costero, R., Echevarria, J., & Roth, M. 1991, MNRAS, 253, 649
- Weitenbeck (1997) Weitenbeck, A. J. 1997, AJ, 114, 222
- Wright et al. (2010) Wright, E. L., Eisenhardt, P. R. M., Mainzer, A. K., et al. 2010, AJ, 140, 1868
- Zavagno et al. (2006) Zavagno, A., Deharveng, L., Comerón, F., et al. 2006, A&A, 446, 171