Using tf-idf as an edge weighting scheme in user-object bipartite networks
Abstract
Bipartite user-object networks are becoming increasingly popular in representing user interaction data in a web or e-commerce environment. They have certain characteristics and challenges that differentiates them from other bipartite networks. This paper analyzes the properties of five real world user-object networks. In all cases we found a heavy tail object degree distribution with popular objects connecting together a large part of the users causing significant edge inflation in the projected users network. We propose a novel edge weighting strategy based on tf-idf and show that the new scheme improves both the density and the quality of the community structure in the projections. The improvement is also noticed when comparing to partially random networks.
1 Introduction
Social networks are becoming increasingly popular for modeling interactions between nodes or individuals of the same kind (one-mode or unipartite) and there is a large amount of work recently focusing on various aspects of social networks. However some real-world networks have a more heterogeneous structure where two kinds of individuals (or items) interact with each other with ties formed between individuals of different types only. Bipartite networks (two-mode) are a natural fit for these sort of systems as they are represented as a graph with two disjoint sets of nodes and edges exists only between nodes from different sets. There are many examples of complex networks that have a bipartite structure, such as actor-movie networks, where actors are linked to movies they played in (Guillaume & Latapy, 2004), authoring or collaboration networks, where authors are linked to the paper they published (Newman, 2001a), human sexual networks, consisting of men an women (Liljeros et al., 2001) and the metabolic networks between chemical reactions and metabolites (Jeong et al., 2000). Even though there is a lot more focus on social networks in the scientific community, research on bipartite or two-mode networks has moved forward in the last couple of years.
User-object networks are emerging as a special class of bipartite networks with certain characteristics that are different than the relatively well studied author-paper and actor-movie networks. Users interact continuously with objects, based on their own selection and preference. This representation is appropriate for modeling activities in web and e-commerce environments. For example the social tagging, music listening activity or movie watching can be modelled as an user-object network. In certain cases these networks can be also referred as consumer-product networks where an edge links a consumer with a product when the former buys or views that particular product (Huang et al., 2007).
One particular characteristic of user-object networks is the presence of a significant number of highly popular objects reflected by the heavy tail distribution of the objects degree (Shang et al., 2010). The heavy tail is believed to be formed through preferential attachment (Barabâsi et al., 2002), where users tend to interact more with objects that are already popular. These popular objects have a significant effect on the properties of both bipartite and projected networks, causing significant link inflation in the latter. On the other side they are a poor indicator of users interests, while unpopular objects are the best at describing common tastes shared by users (Shang et al., 2010). In this paper we are proposing a method of (re)assigning weights to edges in a bipartite user-object network based on the popular tf-idf method that will reduce the effect of popular objects while taking into account user’s preferences. We validate the new method by showing that both density and community structure of the projected users network is improved compared to both the original projected network and the network generated partially in a random fashion.
The remainder of the paper is structured as follows. Next section reviews the state of the art literature on bipartite and user-object networks. In section 3 we provide a comprehensive analysis of user-object networks and their properties and challenges, including density and clustering. Section 4 proposes the new weighting scheme based on tf-idf. In section 5 we validate the proposed approach by comparing densities and modularities of the projected users network to the random case. Finally, we conclude the paper in section 6 by summarizing our findings and pointing out future research directions.
2 Related work
One popular approach when analyzing two-mode networks is to transform them into one-mode networks through a method known as projection and then use the methods available for social networks. Newman (2001a) and Barabâsi et al. (2002) study scientific collaboration networks between authors of scientific papers by projecting the authoring network (author-paper) to an unweighted co-authoring network (author-author). A tie is defined between two authors if they have at least one collaboration together, without taking into account the frequency of collaboration between the authors. In order to avoid the loss of information through unweighted projection, some authors proposed a weighting method. Ramasco & Morris (2006) and Li et al. (2007) use a simple mechanism to assign weights, based on the number of times those authors collaborated. Other papers propose a different approach to weighting. In Newman (2001b) the contribution of a co-authored article to the weight of an edge between two authors depends on the degree of the article. This is based on the assumption that a low degree article defines a stronger relationship between authors than a high degree one. Li et al. (2005) considers a saturating effect where the increase in strength of a relationship between two authors slows down when more articles are added, as they already know each other well after writing some papers together.
In order to avoid loss of information through projection (weighted or unweighted), several features and methods have been proposed for bipartite networks, most of them borrowed from social networks. Borgatti & Everett (1997) studies visualization techniques of bipartite networks and defines several properties for these type of networks like density and centrality. Latapy et al. (2008) uses several statistics to analyze two-mode data and proposes new bipartite properties like clustering coefficient and redundancy coefficient. Lind et al. (2005) and Zhang et al. (2008) redefine the clustering coefficient for bipartite networks by considering squares (4-cycles) instead of triangles, which are not possible in a two-mode configuration. Opsahl (2011) proposes a new measure of clustering based on the notion of triadic closure defined between three nodes of the same type. Several community detection methods have been proposed for bipartite networks (Fortunato, 2010). However most of these methods are not optimized for large networks on the scale seen in web or e-commerce environment. Therefore when detecting communities in bipartite networks a widely used approach is to project them on one of the node sets and apply scalable community detection methods from social networks on the projection.
The research work mentioned above focused either on specific networks like collaboration network or generally on bipartite networks. They didn’t consider user-object networks as a particular class of bipartite networks. On the other side, especially in a web or online environment user-object networks with their particularities are becoming increasingly popular in modeling the interaction between users (e.g. customers, listeners, watchers etc) and the online system (e.g. e-commerce, music, video etc). Huang et al. (2007) is analyzing the bipartite consumer-product graphs representing sales transactions in an e-commerce setting. They found a larger than expected average path length and tendency of customers to cluster according to their purchases. A new recommendation algorithm is proposed based on these findings. Grujic et al. (2009) uses a bipartite representation of interactions between users and web databases to study patterns of clustering based on users common interests. They found a power law degree distribution of objects and a disassortative mixing pattern with high degree (active) users interacting mostly with low degree (unpopular) objects and low degree (inactive) users interacting mostly with high degree objects (popular). The authors applied a spectral clustering method on the weighted projected network and found communities relevant to subjects of common interests.
Recently, Shang et al. (2010) did an empirical analysis of two web-based user-object networks collected from two large-scale web sites and found the same power law degree distribution for objects and disassortative mixing pattern. A new property is proposed called collaborative similarity capturing the diversity of tastes based on the collaborative selection. For the lower-degree objects the authors found a negative correlation between object collaborative similarity (how similar are the users interacting with a specific object) and the object degree. Therefore unpopular (low degree) objects are considered a good indicator for the users common interests, while popular objects are less relevant. Starting from this observation we propose a new weighting scheme for user-object bipartite networks that will increase the relevance of unpopular object in the network and decrease the importance of popular ones.
3 Characteristics of user-object networks
A user-object network can be represented as a graph , where is the users set, is the objects set and is the set of edges between users and objects. We denote by and the number of users and the number of objects, respectively. We denote by the number of links or edges in the bipartite network. We define () as the average degree of users (objects) and the density of the network as .
In user object networks interactions between the two types of nodes, and , are event-driven, occurring continuously, and often the same edge is reinforced multiple times. This reinforcement can be represented as a weight assigned to the edge between the two interacting nodes. On the other side, in most bipartite networks there is only one interaction between two nodes (an actor can only play once in a movie).
The behaviour of nodes is also particular. Users are active while objects are passive. This is similar to author-paper networks but different than other bipartite networks such as human sexual networks where both nodes are active (Shang et al., 2010).
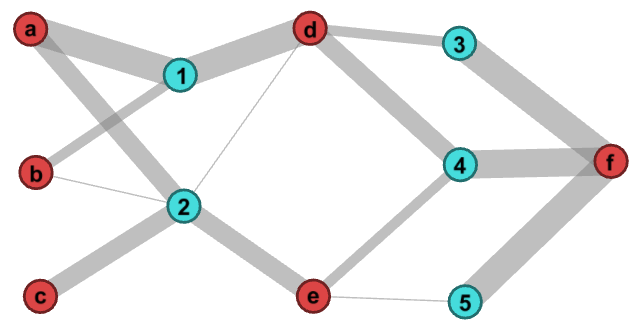
Figure 1 illustrates a small example of a weighted bipartite network where five users (blue nodes) are interacting with six objects (red nodes). Thickness of an edge shows how strong the interaction is between the user and the object (i.e. how often the user ‘touches‘ the object). The degree of an user , denoted by , represents the number of objects connected to that user. Similarly, the degree of an object , denoted by , is the number of users interacting with that object. In our example, user interacts with three objects , and (has a degree of three). Out of these, objects and are local as they are only connected to two users ( and ), while object reaches most of the network by being connected to four out of a total of five users. Therefore objects and are more relevant to particular interests of user than object .
3.1 Data
We are using five real-world data sets and look at the characteristics of the related user-object networks such as basic statistics, degree distributions and clustering. The first one is a subset of the Last.fm Million Song Dataset (Bertin-Mahieux et al., 2011), where users are connected to tags, with an edge defined between an user and a tag if that user assigned the tag to an artist.
The second dataset was extracted from Twitter and includes tweets related to US Politics, covering the period 01/01/2012 - 19/01/2012. This is a subset of a bigger dataset including the US Presidential Campaign and Elections during 2012. The users in the data are the Presidential candidates, governors, senators, political organisations, and journalists. The objects are the web domains included in their tweets. An edge is formed between an user and a domain if the domain was tweeted by that particular user.
The third dataset is a subset of a bigger database published by Audioscrobbler.com containing information about users and the music they listened. In the network representation, an user is connected to an artist with edges weighted based on how often they listen songs from that artist. The Movielens dataset includes ratings (from 1 to 5) of movies by 2000 users, represented as a network. For the purpose of this paper only edges with ratings 4 and 5 were considered (movies that users actually liked). Finally, the last dataset comes from the popular social bookmarking web site delicious.com and includes the network of 973 users and the tags they used for bookmarking.
| Data | ||||||
|---|---|---|---|---|---|---|
| Last.fm | 1,892 | 9,748 | 35,813 | 18 | 3 | 0.19% |
| 1,842 | 3,744 | 13,864 | 7 | 3 | 0.2% | |
| Audioscrobbler | 183 | 21,443 | 39,195 | 214 | 1 | 1% |
| Movielens | 2,000 | 3,336 | 192,922 | 96 | 57 | 2.9% |
| Delicious | 973 | 28,695 | 126,007 | 129 | 4 | 0.45% |
The basic statistics for these networks are presented in Table 1. All networks have relatively low density (they are sparse), between 0.19% and 2.9%. This is important because it allows for optimization of clustering and community detection algorithms. As we will see below this is not the case for the projections of these bipartite networks.
3.2 Projection
Due to the shortage in tools and notions available for two-mode networks a common approach is to transform such a network into its projection by using one of its sets of nodes as a base. For example one can project the network on the users (objects ) by setting a (weighted) edge between two users (objects) that have at least one object (user) in common. Based on the number of common objects (users), weights can be assigned to edges in the projected network. We define the users-projected network as and objects-projected network as . The number of edges is and , respectively. The density of the projected networks is and , respectively.
One of the unwanted effects of projection is an inflation of the number of links in the resulted network (Latapy et al., 2008), which can be noticed in random networks as well. Newman et al. (2001) have shown that projecting a random bipartite graph can result in very dense networks with high clustering coefficient. In the real world case these dense networks are limiting the computations that could be performed to extract properties and detect community structure.
| Data | ||||
|---|---|---|---|---|
| Last.fm | 686,536 | 322,226 | 38.3% | 0.6% |
| 446,892 | 88,044 | 26.3% | 1.2% | |
| Audioscrobbler | 10,453 | 11,253,485 | 62.7% | 4.9% |
| Movielens | 1,786,647 | 2,879,932 | 89.3% | 51.7% |
| Delicious | 395,835 | 7,378,472 | 83.7% | 1.8% |
For example, as shown in Table 2, the density is increasing when projecting the real world networks on both user-nodes and object-nodes. However, the inflation of links is considerably (up to 200 times) larger for the projection on user-nodes, while the projection on object-nodes has a density in most cases only several times higher than the original bipartite network. As we will see below this is caused by the small number of very popular objects, the tail of the power law distribution of object degrees.
3.3 Degree distributions

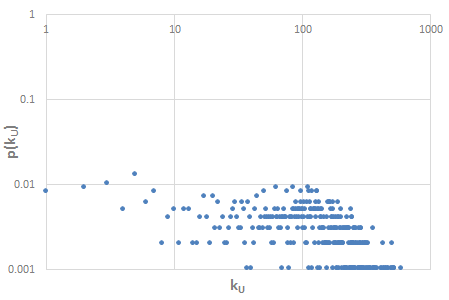
One of the most important structural property of networks is the degree distribution. In the case of bipartite networks and users-objects networks specifically, distributions of both types of nodes are considered. According to previous studies, users degree generally follow an exponential distribution (Latapy et al., 2008), or stretched exponential (Laherrere & Sornette, 1998) at most, as shown in Shang et al. (2010) or Grujic et al. (2009). On the other side, according to the same papers, the degree distribution of objects follow a heavy tail distribution (power law or similar). This has important consequences on the structure of the projected network and also on the process of clustering the user nodes. Other bipartite networks like author-paper or actor-movie doesn’t exhibit this property as there is an inherent constraint on how many authors can write a paper or how many actors can play in a movie.
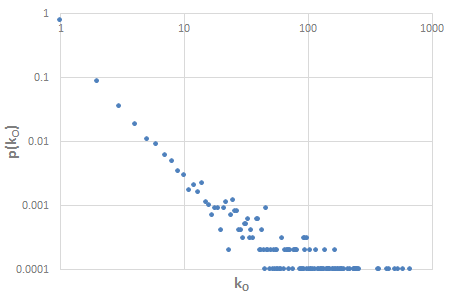
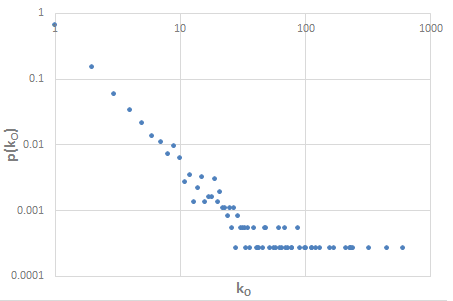
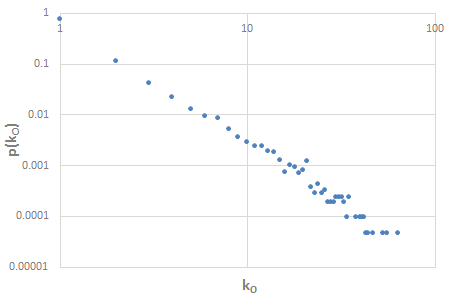
Degree distributions of our sample user-object networks are shown in figures 2 and 3. In order to find the closest model that fits the data, for each such empirical distribution we evaluate the goodness of fit of multiple distribution models by using loglikelihood ratios as described in Clauset et al. (2009). The best fit is found through comparing multiple models two by two: exponential, power law, log-normal and stretched exponential. In each comparison we calculate the loglikelihood ratio between two candidate distributions. This value will indicate which model is a better fit for the data. Also a p-value is calculated for each comparison showing how significant the result is.
| Data | Users | Objects | ||
|---|---|---|---|---|
| Best fit | Parameters | Best fit | Parameters | |
| Last.fm | exponential | lognormal | ||
| lognormal | powerlaw | |||
| Audioscr | exponential | lognormal | ||
| Movielens | lognormal | lognormal | ||
| Delicious | exponential | lognormal | ||
In table 3 we show the best distribution fit and the related parameters for each dataset. While degree distribution for users (active nodes) don’t expose a heavy tail in most cases (exponential), the degree distribution for objects (passive nodes) fits to one of the distribution models with a tail that is not exponentially bounded (power law or lognormal). Due to the number of high degree values (highly popular objects), a heavy tail with heterogeneous distribution of degrees has a significant impact on the structure of the projected network and consequently on the community structure.
3.4 Clustering and impact of highly popular objects
Clustering or community structure (Newman & Girvan, 2004) is another property of user-object or consumer-product networks. Users or consumers tend to cluster together based on the common interests represented by the common objects they are interacting with (Huang et al., 2007). This property sits at the core of the recommender systems based on collaborative filtering (Breese et al., 1998). However, detecting communities in bipartite networks is somehow challenging with few optimized options available at large scale (Fortunato, 2010).
A popular approach is to project the bipartite network on one of its node sets ( or ) and apply the community detection algorithm on the projected network. As seen above, the projection of user-object networks where degrees of objects follow a power law distribution is causing edge inflation in the resulted network by increasing significantly the density of edges (hundreds of times more). This affects the clustering in two ways. First, it ‘dilutes‘ the clusters and decreases the quality of the community structure because of a highly homogeneous distribution of edges among the nodes (Fortunato, 2010). Second, it causes a drop in performance of community detection algorithms, most of them optimized for sparse networks. For example, popular algorithms like Clauset et al. (2004), Raghavan et al. (2007) or Blondel et al. (2008) scale extremely well on sparse data but are much less efficient when networks are very dense (number of links are much larger than number of nodes ).
In our case, due to the heavy-tail distributions of objects, user-projections of all five real-world networks are extremely dense ranging from 26% to 89% (Table 2) causing difficulties such as those described above. For example, by looking at the most popular objects in Table 4 one can see that the highest degree node in each case connects together more than a third of users and in some cases even 50%.
| Tag | Degree | Users linked |
|---|---|---|
| rock | 673 | 35.5% |
| pop | 585 | 30.9% |
| alternative | 532 | 28.1% |
| Domain | Degree | Users linked |
|---|---|---|
| twitter.com | 611 | 33.2% |
| facebook.com | 451 | 24.5% |
| youtube.com | 324 | 17.6% |
| Artist | Degree | Users linked |
|---|---|---|
| Radiohead | 65 | 35.5% |
| Coldplay | 56 | 30.6% |
| The Beatles | 53 | 28.9% |
| Movie | Degree | Users linked |
|---|---|---|
| American Beauty | 1009 | 50.4% |
| Star Wars IV | 855 | 42.7% |
| Star Wars V | 841 | 42% |
| Tag | Degree | Users linked |
|---|---|---|
| design | 546 | 56.1% |
| video | 543 | 55.8% |
| 489 | 50.2% |
On the other side, these highly popular objects contain very little or very high level information about the particularities of the adjacent users and are not very meaningful for grouping users together.
For example, while Last.fm tags like ’rock’, ’pop’ or ’alternative’ might contain some high level information on the users groups, it doesn’t bring specific information about these. In the meantime, unpopular (degree 5) tags like ’symphonic rock’, ’david bowie’ or ’true norwegian black metal’ are showing narrow user interests. Also, highly popular tweeted domains like ’twitter.com’ or ’facebook.com’ are very broad with little clustering information, while unpopular domains like ’radioamerica.org’ or ’seacoastonline.com’ are much more specific. This is in line with Shang et al. (2010) who found that users connected to unpopular objects have much higher similarity to each other than the average. Therefore unpopular objects are considered a better indicator for users common interests than popular ones.
One simple way to handle this problem is to remove the objects with the highest degree, but this will result in loss of information overall, especially in cases when these objects are reinforced frequently by some users. The proposed method in section 4 will address this issue by trying to find a balance between how often an user interacts with an object and how popular an object is in the network.
4 Edge weighting using tf-idf
One of the most common methods used in information retrieval is the term frequency - inverse document frequency (or tf–idf), a weighing scheme for quantifying the importance of a term to a document in a collection (Salton & Buckley, 1988). The tf–idf weight is assigned to each term-document pair and is proportional to the relative frequency of the word in the document, adjusted by the proportion of that word over the entire collection. This method and variations of it are used by search engines as a central component for ranking the relevance of a document to a query, but also in other applications like text summarization and classification.
The tf–idf weight of a term for a document in a collection is defined as the product of the term frequency and inverse document frequency:
| (1) |
The term frequency in equation 1 can be the raw or relative frequency of the term in the document . The inverse document frequency (second part of the product) measures whether the term is common or rare across all documents in the collection and is calculated by taking the logarithm of the fraction of the size of the collection to the number of documents containing the term .
We propose a similar approach for (re)weighting a user-object bipartite network in order to reduce the impact of highly popular objects on projection and clustering. Let us replace the documents in the tf–idf scheme with users and terms with objects, and define a weighting scheme as below:
| (2) |
The new weight (2) of an edge between an user and an object can be recalculated as the product of the normalized object frequency and the logarithm of the inverse object frequency across all users. The former represents the number of object-user interactions (edge weight) with some normalization technique applied. Normalization is required to prevent a bias towards more active users. For example one can normalize the weight of an edge between an user and an object by taking the ratio of its value to the maximum weight of any given edge connected to that user (3).
| (3) |
The last part of the product in equation 2 is similar to the concept of inverse document frequency and measures whether the object is common or rare across all users. It is calculated by dividing the total number of users by the (unweighted) degree of the object (number of users interacting with the object), and taking the logarithm of this value.
The re-weighting scheme presented above assigns higher values to frequent interactions between users and objects offset by how popular an object is within the collection of users. Unpopular objects increases the weight of an interaction while very popular ones make the interaction less significant.
Once the new weights have been calculated, thresholding can be applied to filter out irrelevant edges. As we’ll see in section 5, this reduces significantly the edge inflation in the projected networks while increasing the quality of partitions resulted from community detection and improving the performance of the algorithms.
Figure 4 illustrates the network example from section 3 (figure 1) with the proposed tf-idf method applied. Weights are assigned to edges based on their initial value and transformed through equation 2. In our example they vary between 0.1 and 2.3. The thickness of an edge is proportional to the resulted weight after tfidf is applied. As illustrated in figure 4a, the lowest values are assigned to edges pointing at the highest degree object . This object is connected to four out of five users. The highest weights are assigned to edges connecting users to unpopular or local objects, for example and . The initial weight is also taken into consideration with higher weights assigned to edges having higher initial value. In our example, edge has higher tfidf weight than , even though both edges end in the same node .
After filtering out all edges with weights smaller than a threshold (in this case ), the resulted network has a simpler and more intuitive structure, containing only relevant edges (figure 4b). In the next section, we will validate the proposed approach and confirm this observation on large real-world networks.
5 Evaluation
To illustrate the proposed method for user-objects network we apply it to Davis’s Southern Women dataset (Davis et al., 1941) and the five real-world datasets presented in section 3. First we are going to analyse Davis’s data in more detail.
5.1 Southern women

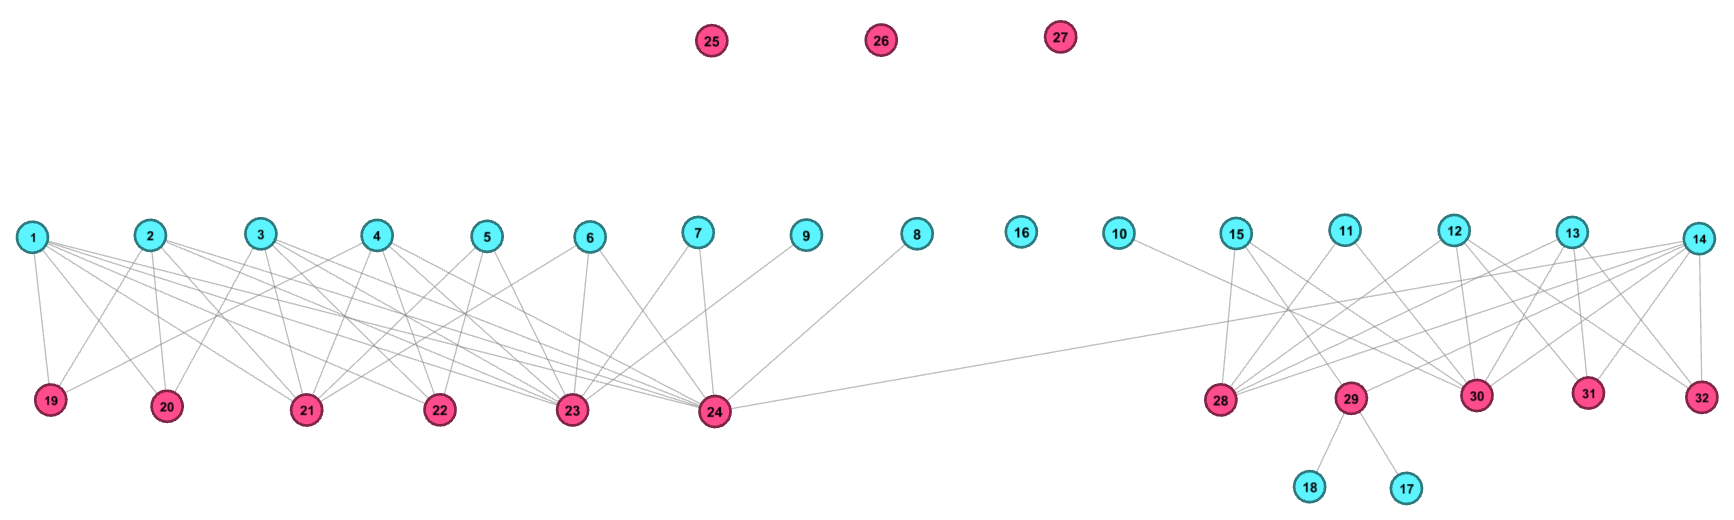
The Southern women data was collected by Davis et al. (1941) during the 1930s and describes the participation of 18 women in 14 social events. It can be represented as a bipartite network (figure 5) whose nodes are women (blue nodes) and social events (red nodes). Edges are participation of the women in the events.
This dataset and the related bipartite network was very well studied by social scientists. Based on the ethnographic information Davis divided the 18 women into two groups: women 1-9 in the first group, women 9-18 in the second. Later, Freeman (2003) analyzed the outcome of 21 different studies, which generally identified almost the same two groups, women 1-9 and 10-18. However in some of these studies women 8, 9 and 16 were often identified as either belonging to both groups or positioned at the periphery of a group.
We applied the proposed weighting scheme to the Southern women dataset and represented the resulted network in Figure 5a. As in the previous example, the thickness of an edge is proportional to the tfidf weight. From this figure it is easy to notice that edges connected to very popular events (25, 26 and 27), where most of women participated, were assigned lower weights than edges connected to local events (19-24 and 28-32). By applying a threshold and removing the lower weights, two core groups of women are emerging, as in Figure 5b: first group 1-9 and second 10-18. It can be easily noticed that women 8 and 9 have a weaker connection to the first group comparing to the other nodes in the group, while woman 16 remains isolated from both groups.
5.2 Experiments


Next we apply the following method to each of the real world datasets. We (re)assign the weights of edges based on the tf-idf formula as in equation 2 and define a range of thresholds . For each value a new network is generated by removing the edges with tfidf weights less than the threshold. Remaining nodes with no edges are removed as well. We project the resulted network on user-nodes () and apply the Louvain method for community detection (Blondel et al., 2008) in the projection. The modularity values of the resulted partition will show the quality of the community structure (Newman & Girvan, 2004).
In order to demonstrate that the proposed weighting scheme for user-object networks improves the quality of clustering in the projections while reducing significantly their density, for each threshold value we generate 100 similar networks with the same number of edges removed randomly. The resulted random networks will have the same size (nodes and edges) as the one resulted after applying the threshold, but instead of deleting edges with tf-idf weights smaller than a threshold we remove them at random. We apply the same community detection method on projections of each of these networks and compare the average modularity across all randomly generated networks (random modularity) with the value resulted from the network where a threshold was applied. If the random modularity is smaller than the real value then the proposed method improves quality of the community structure in the projected networks.
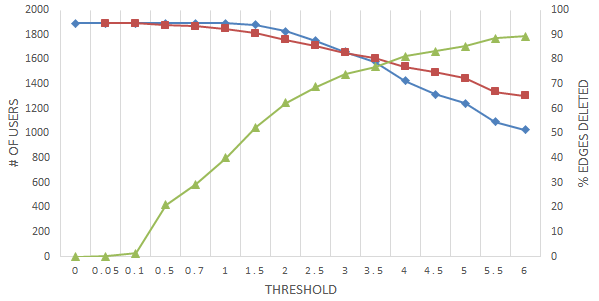
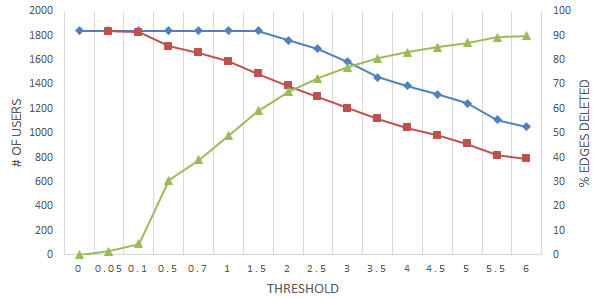
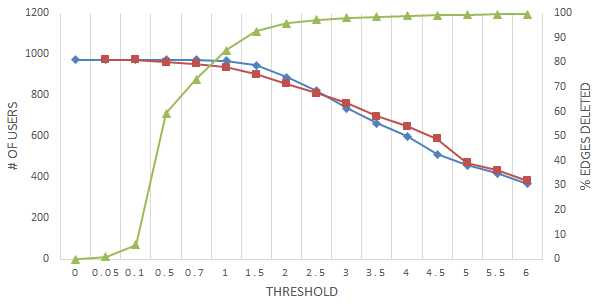
In figure 6 we represent the percentage of edges removed after applying each threshold value as above along with the number of users remaining in both real and random networks. The number of users for random networks was averaged for all 100 generated instances. It is quite obvious from this figure that up to a certain threshold value (which depends on the network) the number of user nodes remains (almost) the same after filtering is applied, even though a significant number of edges were removed. However, in most randomly generated networks the number of user nodes decrease at a steeper rate with the threshold. This observation is particularly visible in Twitter and Audioscrobbler networks where. after deleting 59% (threshold 1.5) and 97% (threshold 2) respectively of edges, the number of user nodes remains the same. In the meantime, in the random case in both networks there are around 20% less user nodes at the same threshold values. Also, the ratio of edges deleted by applying a threshold is much higher for Audioscrobbler and Delicious networks comparing to the other networks. For example, for these two networks 97%, respectively 96%, of edges are removed for a threshold value of 2, while for the other three networks only 11% (Movielens), 62% (Lastfm) and 67% (Twitter) of edges were removed. This points to a different distribution of tf-idf weights for various networks and this difference has to be considered when selecting the most appropriate range of thresholds.
By applying the proposed method and filtering out edges up to a threshold value we are preserving the same number of user nodes (assuming a limit for the threshold), while significantly reducing the number of edges. The resulted network will have a lower density and a more clear structure, reflecting users most important interests.
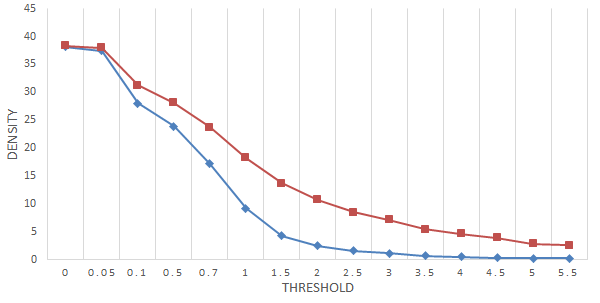
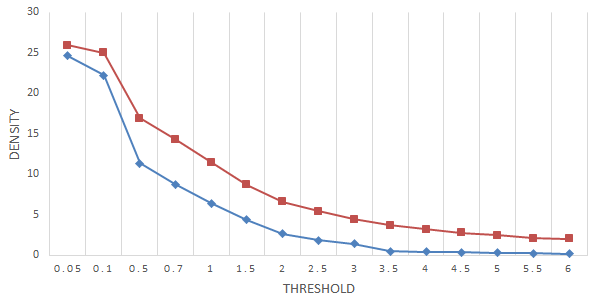
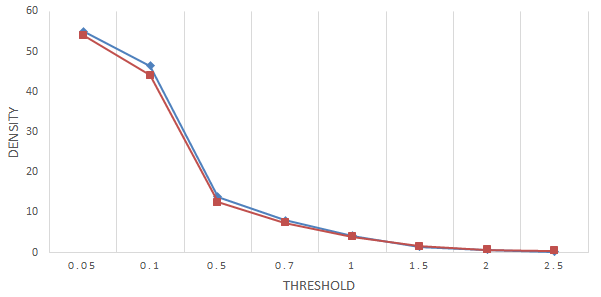
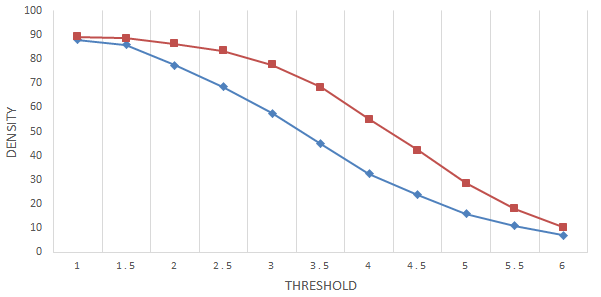
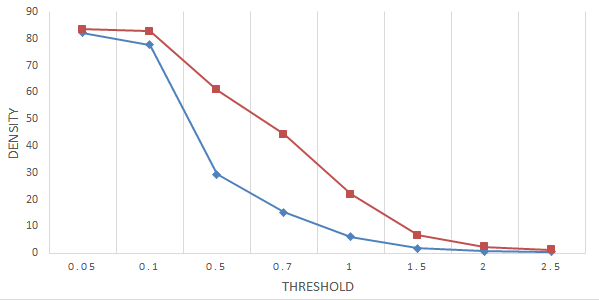
Next we calculate the density of the user-projected networks resulted by applying the tfidf weighting scheme with threshold filtering to the original network and projecting it on the user nodes (user-projected network). Both real and random (edges removed randomly) cases are considered for multiple values of the threshold between 0 and 6. As above, the random density is averaged for all 100 generated instances. As shown in figure 7, density in real networks is lower than in random networks, for all datasets. This difference is particularly visible in Lasfm, Twitter, Movielens and Delicious datasets, where, for some threshold values, density can be up to 60% less comparing to random. If we get the Twitter network for example and select a threshold of 1.5 (no user nodes are removed by filtering) the density of the user-projected network is 4.3, 82% less than the original projected network before filtering (24.6) and 50% less than the averaged density for random network (8.67).
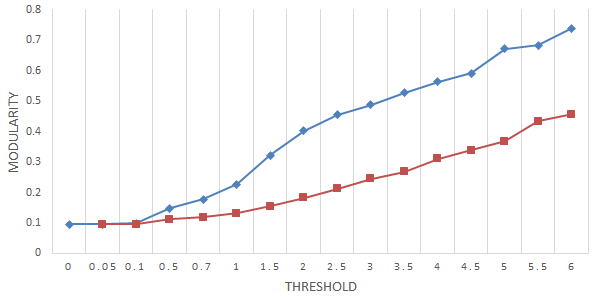
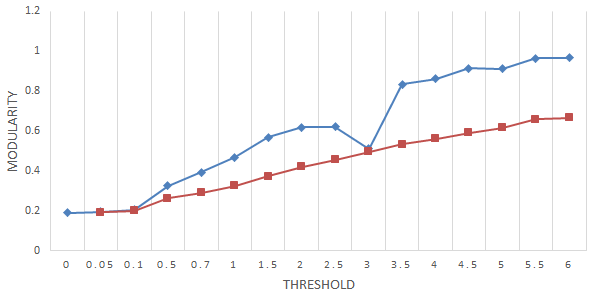
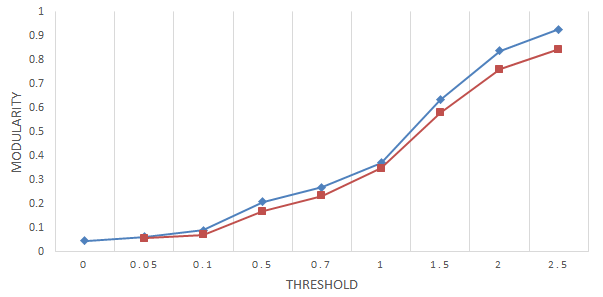
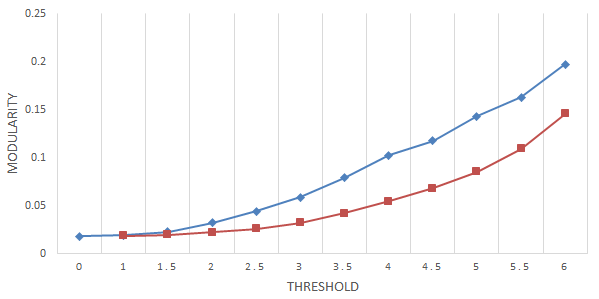
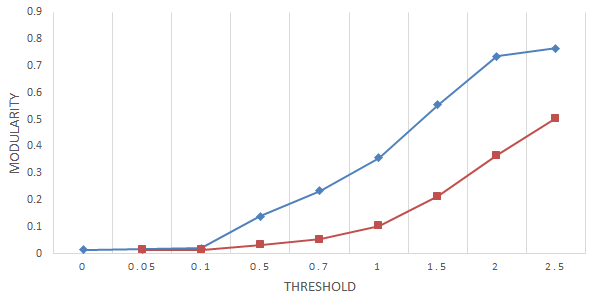
Finally, after applying the Louvain method for community detection on the user-projected networks, we calculate the modularity of the resulted partitions and compare the values for real and randomly generated networks (the latter averaged over the 100 random instances). These values, for multiple thresholds, are represented in figure 8. As mentioned earlier, thresholds have a bigger impact on Audioscrobbler and Delicious networks with a large part of edges removed (96-95%) for a value of 2 or higher. Therefore in these two cases we limit the threshold to 2.5.
It’s easy to notice that modularity is constantly increasing when higher threshold values are used and more edges are filtered out. Also, for all of our datasets the modularity values are higher in real networks comparing to random networks, with this difference being quite significant in most of the cases. For example, taking the same threshold value of 1.5 for Twitter dataset, the random modularity is 34% lower than the modularity for the real projected network. Similarly, in the Lastfm dataset random modularity is up to 54% lower (theshold 2) comparing to its value for the real network. The only exception is in Twitter case for the threshold value of 3 where the two modularities (real and random) are almost the same. However, we suspect this might be caused by the resolution limit in modularity and perhaps relative instability of the Louvain method (Fortunato & Barthelemy, 2007).
From above we saw that applying the proposed tfidf method and filtering out edges below a certain threshold significantly improves both the density of the bipartite and user-projected networks and the quality of the community structure of the user-projected network as measured by modularity. This improvement is also visibly better than filtering out edges randomly without using the tfidf weights. Therefore the resulted network has a simpler and more intuitive structure, containing only edges that are relevant in finding groups of similar users.
6 Conclusion
We analyzed the bipartite representation of interactions between users and objects in web or e-commerce systems and shown that due to their scale such user-object networks have certain characteristics and challenges differentiating them from other bipartite networks such as collaboration or actor-movie networks. We analyzed the structural properties of five real world user-object networks and found a heavy tail degree distribution for objects. This heterogeneity is responsible for hyperinflation of edges in the projected users network resulting in very high density and diluted community structure in these projections. Also, popular objects are connecting together a large number of users, but they contain little or high level information about users interests.
In order to diminish the impact of higher degree objects we are proposing a new weighting scheme based on the popular tf-idf method used in information retrieval and text mining. With tf-idf the weight of interactions between users and unpopular objects is amplified while popular objects will bring a lower contribution to the weight of an edge. Filtering can be applied to keep only the relevant edges with higher tf-idf weights, starting from a specific threshold. We used the proposed approach with five real world user-object networks and demonstrate a decrease in density of both original and projected networks. We apply the Louvain method (Blondel et al., 2008) to find communities in the projected users network and calculate the modularity of each partition. We find that the quality of the community structure as measured by modularity is significantly improved when compared to the projections of the original networks. This improvement is also observed with similar partially random networks where edges are filtered out randomly.
We proposed a simple and efficient method of assigning weights in a bipartite user-object network that will decrease the impact of popular objects and improve density and community structure. Current work can be extended to develop new network-based recommender systems. Data used by such systems has a natural bipartite structure where users are interacting with items in an online environment. Our approach can also be applied to current community detection methods for bipartite networks to improve both their scalability and the quality of results. Further on, due to their simplicity, tf-idf weights can be easily adapted to suit temporal networks that evolve over time. These evolving weighs can be monitored and analyzed to detect trends and patterns in user-object event data.
References
- Barabâsi et al. (2002) Barabâsi, A.L., Jeong, H., Néda, Z., Ravasz, E., Schubert, A. & Vicsek, T. (2002). Evolution of the social network of scientific collaborations. Physica A: Statistical Mechanics and its Applications, 311, 590–614.
- Bertin-Mahieux et al. (2011) Bertin-Mahieux, T., Ellis, D.P., Whitman, B. & Lamere, P. (2011). The million song dataset. In Proceedings of the 12th International Conference on Music Information Retrieval (ISMIR 2011).
- Blondel et al. (2008) Blondel, V.D., Guillaume, J.L., Lambiotte, R. & Lefebvre, E. (2008). Fast unfolding of communities in large networks. Journal of Statistical Mechanics: Theory and Experiment, 2008, P10008.
- Borgatti & Everett (1997) Borgatti, S.P. & Everett, M.G. (1997). Network analysis of 2-mode data. Social networks, 19, 243–269.
- Breese et al. (1998) Breese, J.S., Heckerman, D. & Kadie, C. (1998). Empirical analysis of predictive algorithms for collaborative filtering. In Proceedings of the Fourteenth conference on Uncertainty in artificial intelligence, 43–52, Morgan Kaufmann Publishers Inc.
- Clauset et al. (2004) Clauset, A., Newman, M.E. & Moore, C. (2004). Finding community structure in very large networks. Physical review E, 70, 066111.
- Clauset et al. (2009) Clauset, A., Shalizi, C.R. & Newman, M.E. (2009). Power-law distributions in empirical data. SIAM review, 51, 661–703.
- Davis et al. (1941) Davis, A., Gardner, B.B. & Gardner, M.R. (1941). Deep south. University of Chicago Press Chicago.
- Fortunato (2010) Fortunato, S. (2010). Community detection in graphs. Physics Reports, 486, 75–174.
- Fortunato & Barthelemy (2007) Fortunato, S. & Barthelemy, M. (2007). Resolution limit in community detection. Proceedings of the National Academy of Sciences, 104, 36–41.
- Freeman (2003) Freeman, L.C. (2003). Finding social groups: A meta-analysis of the southern women data. Dynamic social network modeling and analysis, 39–97.
- Grujic et al. (2009) Grujic, J., Mitrovic, M. & Tadic, B. (2009). Mixing patterns and communities on bipartite graphs on web-based social interactions. In Digital Signal Processing, 2009 16th International Conference on, 1–8, IEEE.
- Guillaume & Latapy (2004) Guillaume, J.L. & Latapy, M. (2004). Bipartite structure of all complex networks. Information processing letters, 90, 215–221.
- Huang et al. (2007) Huang, Z., Zeng, D.D. & Chen, H. (2007). Analyzing consumer-product graphs: Empirical findings and applications in recommender systems. Management Science, 53, 1146–1164.
- Jeong et al. (2000) Jeong, H., Tombor, B., Albert, R., Oltvai, Z.N. & Barabási, A.L. (2000). The large-scale organization of metabolic networks. Nature, 407, 651–654.
- Laherrere & Sornette (1998) Laherrere, J. & Sornette, D. (1998). Stretched exponential distributions in nature and economy: fat tails with characteristic scales. The European Physical Journal B-Condensed Matter and Complex Systems, 2, 525–539.
- Latapy et al. (2008) Latapy, M., Magnien, C. & Vecchio, N.D. (2008). Basic notions for the analysis of large two-mode networks. Social Networks, 30, 31–48.
- Li et al. (2005) Li, M., Fan, Y., Chen, J., Gao, L., Di, Z. & Wu, J. (2005). Weighted networks of scientific communication: the measurement and topological role of weight. Physica A: Statistical Mechanics and its Applications, 350, 643–656.
- Li et al. (2007) Li, M., Wu, J., Wang, D., Zhou, T., Di, Z. & Fan, Y. (2007). Evolving model of weighted networks inspired by scientific collaboration networks. Physica A: Statistical Mechanics and its Applications, 375, 355–364.
- Liljeros et al. (2001) Liljeros, F., Edling, C.R., Amaral, L.A.N., Stanley, H.E. & Åberg, Y. (2001). The web of human sexual contacts. Nature, 411, 907–908.
- Lind et al. (2005) Lind, P.G., Gonzalez, M.C. & Herrmann, H.J. (2005). Cycles and clustering in bipartite networks. Physical review E, 72, 056127.
- Newman (2001a) Newman, M.E. (2001a). Scientific collaboration networks. i. network construction and fundamental results. Physical review E, 64, 016131.
- Newman (2001b) Newman, M.E. (2001b). Scientific collaboration networks. ii. shortest paths, weighted networks, and centrality. Physical review E, 64, 016132.
- Newman & Girvan (2004) Newman, M.E. & Girvan, M. (2004). Finding and evaluating community structure in networks. Physical review E, 69, 026113.
- Newman et al. (2001) Newman, M.E., Strogatz, S.H. & Watts, D.J. (2001). Random graphs with arbitrary degree distributions and their applications. Physical Review E, 64, 026118.
- Opsahl (2011) Opsahl, T. (2011). Triadic closure in two-mode networks: Redefining the global and local clustering coefficients. Social Networks.
- Raghavan et al. (2007) Raghavan, U.N., Albert, R. & Kumara, S. (2007). Near linear time algorithm to detect community structures in large-scale networks. Physical Review E, 76, 036106.
- Ramasco & Morris (2006) Ramasco, J.J. & Morris, S.A. (2006). Social inertia in collaboration networks. Physical Review E, 73, 016122.
- Salton & Buckley (1988) Salton, G. & Buckley, C. (1988). Term-weighting approaches in automatic text retrieval. Information processing & management, 24, 513–523.
- Shang et al. (2010) Shang, M.S., L , L., Zhang, Y.C. & Zhou, T. (2010). Empirical analysis of web-based user-object bipartite networks. EPL (Europhysics Letters), 90, 48006.
- Zhang et al. (2008) Zhang, P., Wang, J., Li, X., Li, M., Di, Z. & Fan, Y. (2008). Clustering coefficient and community structure of bipartite networks. Physica A: Statistical Mechanics and its Applications, 387, 6869–6875.