The Synergy between Weak Lensing and Galaxy Redshift Surveys
Abstract
We study the complementarity of weak lensing (WL) and spectroscopic galaxy clustering (GC) surveys, by forecasting dark energy and modified gravity constraints for three upcoming survey combinations: SuMIRe (Subaru Measurement of Images and Redshifts, the combination of the Hyper Suprime-Cam lensing survey and the Prime Focus Spectrograph redshift survey), EUCLID and WFIRST. From the WL surveys, we take into account both the shear and clustering of the source galaxies and from the GC surveys, we use the three-dimensional clustering of spectroscopic galaxies, including redshift space distortions. A CMB prior is included in all cases. Focusing on the large-scale, two-point function information, we find strong synergy between the two probes. The dark energy figure of merit from WL+GC is up to a factor larger than from either probe alone. Considering modified gravity, if the growth factor is treated as a free function, it is very poorly constrained by WL or GC alone, but can be measured at the few percent level by the combination of the two. On the other hand, for cosmological constraints derived from (angular) power spectra and considering statistical errors only, it hardly matters whether the surveys overlap on the sky or not. For instance, the dark energy figure of merit for overlapping surveys is at most better than in the disjoint case. This modest gain can be traced to the fundamental fact that only a small fraction of the total number of modes sampled by the GC survey (or by the WL survey) contributes to the cross-correlations between WL and GC.
I Introduction
Weak gravitational lensing surveys and spectroscopic galaxy redshift surveys are among the most promising near-future probes of dark energy, modified gravity and other cosmological physics. Weak gravitational lensing, the subtle distortion of galaxy images by large-scale structure along the line of sight, directly measures metric perturbations. A measurement of cosmic shear, the large-scale correlations of the shear of galaxy images due to weak gravitational lensing, therefore constrains cosmology through its sensitivity to the power spectrum of these metric perturbations and through the dependence of the signal on the geometry of the universe. Moreover, as a bonus, lensing surveys contain cosmological information in the clustering of the lensing source galaxies. Encouraging results have already been obtained from existing cosmic shear data, see e.g. Massey et al. (2007a, b); Fu et al. (2008); Schrabback et al. (2009); Huff et al. (2011); Kilbinger et al. (2013); Heymans et al. (2013), even though so far only a modest fraction of the sky (a few hundred square degrees) has been used for these studies.
Spectroscopic galaxy surveys measure the three-dimensional matter distribution up to a galaxy bias factor, which can be modeled on large scales, and are also sensitive to the expansion history of the universe, as this determines the conversion from observed angular positions and redshifts to three-dimensional coordinate positions. Moreover, since a galaxy’s redshift is determined not just by its cosmic distance, but also by its peculiar velocity, the observed galaxy power spectrum or correlation function receives a modification depending on the statistics of the large-scale velocity field. These redshift space distortions make it possible to directly measure the growth rate of large-scale structure. As a cosmology probe, spectroscopic galaxy clustering surveys (see e.g. York et al. (2000); Colless et al. (2003); Jones et al. (2009); Parkinson et al. (2012); Dawson et al. (2013); Guzzo et al. (2013)), are already at a more mature level than weak lensing, with strong and robust cosmological constraints so far coming especially from measurements of the baryon acoustic oscillations scale Eisenstein et al. (2005); Cole et al. (2005); Beutler et al. (2011); Blake et al. (2011); Anderson et al. (2012).
For both types of surveys, large steps forward will be made within the next decade, thanks to a number of planned (or already ongoing) surveys that will vastly increase the sky area and redshift range probed. For weak lensing, these surveys include the Kilo Degree Survey (KiDS, de Jong et al. (2013)), Dark Energy Survey (DES, des ), the Subaru Hyper Suprime-Cam lensing survey (HSC, hsc ), LSST lss , EUCLID Laureijs et al. (2011) and WFIRST Spergel et al. (2013), and for galaxy clustering, they include HETDEX Hill et al. (2008), PFS Ellis et al. (2012), DESI Levi et al. (2013), EUCLID and WFIRST.
The imminent availability of high-quality galaxy clustering and weak lensing data begs the question how much more can be learned about dark energy and modified gravity when the two probes are combined. In this work, we will consider only the information in the two-point statistics of the observed fields (shear, source galaxy density and spectroscopic galaxy density) and restrict the analysis to large, quasi-linear scales. However, we note that invaluable additional information may be encoded in the data beyond the large-scale two-point function, and that several promising methods for extracting this information have been proposed, e.g. Yoo and Seljak (2012); Hikage et al. (2012a, b). Considering for simplicity two surveys covering an equal amount of sky (but not necessarily the same part), one can study two distinct scenarios.
On the one hand, if the survey areas are completely disjoint, one expects strong complementarity for two reasons. First of all, somewhat trivially, the combination of surveys covers twice as much sky, and therefore, heuristically, twice as many modes as any survey individually. Secondly, and more importantly, the two probes have distinct sensitivities to cosmological parameters so that combining them helps break degeneracies in cosmological parameter space and allows for constraints that are much stronger than expected solely based on the larger sky coverage (i.e. uncertainties smaller than can be achieved, where is the smallest of the two individual probe uncertainties).
On the other hand, one can consider the scenario where the two surveys overlap fully. A potential downside of this relative to the previous case is that this does not enlarge the total sky coverage so that the probed volume is smaller than in the case of disjoint surveys, although we will show that this is a small effect. On the positive side, since both surveys now probe the same three-dimensional density modes, there is information available in the cross-correlations between the two surveys. In the case of the the cross-correlations between the shear modes and the spectroscopic galaxy density modes, this signal is equivalent to galaxy-galaxy lensing, when the spectroscopic galaxies are at lower redshift than the lensing source galaxies. By measuring the same density modes using different probes, one is effectively applying a multi-tracer method McDonald and Seljak (2009), and it should in principle be possible to extract certain cosmological information without the limitation of sample variance. While not the focus of this article, there are large additional advantages of overlapping surveys: for instance, the imaging survey can provide target selection for the spectroscopic survey, and the fact that the two surveys are subject to different systematics allows for more robust measurements when they are combined, (e.g., see Hikage et al. (2012a, b) for such a method). These same-sky benefits are not explicitly included in our analysis of statistical uncertainties only.
While it is clear that in both of the above cases, the combination of weak lensing and galaxy clustering will improve cosmology constraints, two questions merit further study. (1) How strong exactly is this complementarity for upcoming surveys (how large a boost in constraining power can be expected)? and (2) how important is the overlap on the sky between the two surveys (i.e. what is the difference in expected constraints between the two scenarios discussed above)? These questions have been studied to some extent in the literature Guzik et al. (2010); Cai and Bernstein (2012); Gaztañaga et al. (2012); Kirk et al. (2013); Font-Ribera et al. (2013), but especially the answer to question (2) varies between groups. In this article, we study joint constraints from lensing and spectroscopic galaxy surveys for three combinations of upcoming surveys: Subaru Measurement of Images and Redshifts (SuMIRe), which is the combination of the HSC lensing survey and the PFS spectroscopic galaxy survey (both with the 8.2m Subaru telescope), EUCLID Laureijs et al. (2011), and WFIRST Spergel et al. (2013). The latter two are satellite surveys that will carry out both imaging and spectroscopic redshift programs.
Using the Fisher matrix formalism, we will focus our attention on forecasted constraints on the dark energy equation of state, quantified by a Figure of Merit, and on the growth factor of large-scale structure as a function of redshift, . We will compare joint constraints to constraints from the weak lensing and spectroscopic survey individually, always including a CMB prior from Planck, and marginalizing over cosmological (and galaxy bias) parameters, including the sum of neutrino masses. While all three surveys will have full overlap between the imaging and spectroscopic components, we will also study the hypothetical case of them being disjoint, in order to quantify the importance (or lack thereof) of the cross-correlations (in other words, the same-sky benefits) between the surveys.
The article is organized as follows. In section II, we will explain our forecast method, discussing the parameter space, and paying specific attention to our approach for combining the information from angular power spectra and three-dimensional galaxy power spectra. In section III, we briefly discuss the three survey combinations SuMIRe, EUCLID and WFIRST. We present forecasted constraints for the different survey scenarios in section IV, and will explain these results in more detail in section V. We conclude with discussion and a summary in section VI.
II Method
We use the Fisher matrix formalism (see, e.g., Tegmark et al. (1997)) to forecast cosmological constraints. Our study takes into account data from two types of surveys. On the one hand, we consider a sample of lensing source galaxies from a weak lensing survey (WL). We assume these galaxies have photometric redshifts (described by an unbiased Gaussian distribution with scatter ), which are used to divide the sample into tomographic redshift bins, defined by (photometric) redshift ranges . In each bin, we then use two fields: the lensing shear as a function of position on the sky, (although in practice we capture its information in terms of the convergence ), and the relative overdensity of the number of source galaxies, ( standing for photometric). The clustering of the source galaxies is biased relative to the underlying dark matter field so we model the galaxy bias as piecewise constant in redshift and introduce a free galaxy bias parameter for each bin, , giving the value of the bias in the (true) redshift range . For simplicity, we assume this bias is constant in redshift Since we consider only (quasi-)linear scales, we take the bias to be scale-independent.
On the other hand, we consider data from a spectroscopic galaxy redshift survey (GC). We divide this sample into redshift bins with bounds ,and consider the galaxy overdensity field, , in each bin. Since we assume the redshift in the spectroscopic sample to be measured with perfect accuracy, we have full access to three-dimensional galaxy clustering information in each redshift slice. As detailed below, to properly describe not only the information in the 3D power spectrum of the spectroscopic survey, but also the cross-correlations with the 2D and fields, we split the Fisher matrix into two parts. One part will be the usual Fisher matrix calculated for the 3D power spectrum in redshift space (including redshift space distortions, Alcock-Paczynski effect, etc.), while the other part will come from the angular auto- and cross-spectra with and , using the projected spectroscopic galaxy density as a function of position on the sky in each redshift bin. To avoid double counting -modes, we will remove the transverse modes already included in the 2D Fisher matrix from the 3D Fisher matrix. Just like for the photometric galaxy density, we introduce an independent, free galaxy bias parameter, , for each spectroscopic redshift bin (with label ).
To summarize, we consider three types of data: the shear and photometric galaxy overdensity from an imaging/lensing survey, and the galaxy overdensity from a spectroscopic survey. We will sometimes refer to the imaging survey and its data as WL (while it also contains galaxy clustering information because of the field, the main goal of these surveys is the weak lensing shear signal) and to the spectroscopic survey as GC. As described in the following, we use cross- and auto-correlations between these fields (and between the various redshift slices) to construct a Fisher matrix and to forecast expected cosmological constraints. In addition, all our results will have a Planck CMB prior included, where we neglect information from CMB lensing because we want all the late-universe clustering information to come from the lensing and galaxy clustering surveys of interest. We also neglect the correlation between CMB temperature anisotropies and large-scale structure due to the Integrated Sachs-Wolfe effect. This is justified because the signal-to-noise in this signal is low.
II.1 2D Fisher Matrix
The 2D Fisher matrix encapsulates the information contained in the angular auto- and cross-power spectra of the , and fields (or subsets thereof) in the different redshift bins. We refer to the literature for the relevant equations describing the 2D Fisher matrix, e.g. Cai and Bernstein (2012). To calculate the angular power spectra, , we employ the Limber approximation Limber (1954); Loverde and Afshordi (2008), which expresses a spectrum as the line-of-sight integral over the product of two kernels and the 3D matter power spectrum (for the and fields, the kernel contains a galaxy bias factor). We use the linear , as obtained from CAMB Lewis et al. (2000), for all spectra except the shear auto-spectra (, including cross-spectra between different tomographic bins of course), for which we use the non-linear matter spectrum obtained by applying the HaloFit Smith et al. (2003); Takahashi et al. (2012) prescription to the linear power spectrum. Using the non-linear signal for cosmic shear significantly increases the cosmological information (see, e.g., de Putter et al. (2013)) and is justified by the fact that shear directly measures the underlying matter field and will therefore be easier to model in the mildly non-linear regime than galaxy clustering, which would involve the additional complication of non-linear galaxy bias. We include modes up to . This is a common choice for cosmic shear forecasts, although we note that modeling non-linear clustering and baryonic effects to the required accuracy for this multiple range will be far from trivial. For galaxy clustering, we choose a more conservative cutoff, , where Mpc and is the comoving angular diameter distance to the central redshift of the -th bin. For both galaxy clustering and shear, we also apply a cutoff , because the largest angular scales may be contaminated by systematics. We will refer to the resulting Fisher matrix as , where the curly brackets will contain the set of observables included, chosen from and . All 2-point functions of the included fields will be used, both for the calculation of the signal and that of the covariance matrix. This means that when a set of fields, e.g. , and are included in a single Fisher matrix, , the fields are assumed to be measured on the same part of the sky and their covariances are included. Fisher matrices for two non-overlapping surveys can be obtained by summing together two separate Fisher matrices (see section II.3).
II.2 3D Fisher Matrix
For the Fisher matrix of the 3D spectroscopic galaxy power spectrum in redshift space, ( being the cosine of the angle between the wave vector and the line-of-sight direction), we follow the approach by Seo and Eisenstein (2007). The details of how we model are as in Ellis et al. (2012), except that we do not include the shot noise-like parameter . In particular, this means we apply an exponential damping in the Fisher matrix describing the effects of non-linear clustering and redshift space distortions, and that we assume the use of density field reconstruction Eisenstein et al. (2007) to ameliorate this damping. We include modes up to Mpc, but find our results to not be particularly sensitive to small variations in because the non-linear damping described above acts as a de facto cutoff. Finally, as mentioned above, we exclude transverse () modes from our Fisher matrix, where, for each bin in and , is chosen to equal the number of modes used in the 2D Fisher matrix. Specifically, this means that for a bin centered on and , we exclude a wedge around , where is the width in comoving distance of the redshift slice centered at . The same approach was followed in Cai and Bernstein (2012); Gaztañaga et al. (2012). We will refer to the resulting Fisher matrix as (the star indicates that transverse modes are left out).
II.3 Combining Surveys
The main survey combinations we will consider are the following (the CMB prior is implicit):
-
•
WL only:
As explained above, the WL survey includes the information in the clustering of the source galaxies, the field, in addition to lensing shear. To clarify the above notation, includes all cross- and auto-spectra of the types , and . We will also in some cases consider the case where the information in the clustering of source galaxies is neglected and only is used from the WL survey, i.e. replacing by . -
•
GC only:
Alternatively, this matrix could be calculated by replacing by , the 3D galaxy power spectrum without transverse modes removed. We have calculated this matrix as a consistency check, and find reasonable agreement between the two prescriptions, lending support to our method of separating transverse modes and non-transverse ones. Note that, while we refer to this case as GC for galaxy clustering, it refers to the information in the spectroscopic survey only and thus does not include the additional galaxy clustering information that would be available from the lensing source galaxies in an imaging survey. -
•
GC + WL (no overlap):
-
•
GC + WL (full overlap):
II.4 Parameters
We consider a base set of cosmological parameters, (the effect of the time-varying dark energy equation of state is implemented in CAMB using the parametrized post-Friedmann formalism Fang et al. (2008)). Note that this set includes the sum of neutrino masses, which is an unknown that needs to be marginalized over. Its fiducial value is eV. On top of these cosmological parameters, depending on which observables are taken into account, we include the photometric galaxy bias, and the spectroscopic galaxy bias parameters. Our dark energy constraints are calculated within this parameter space of a maximum of parameters. We will summarize such constraints in terms of the dark energy figure of merit (FOM, Albrecht et al. (2006)),
| (1) |
Note that, unlike in Albrecht et al. (2006), we do not marginalize over spatial curvature, , but do include . As an aside, we find that generally the forecasted FOM looks significantly stronger when is fixed: typically a factor larger than when it is properly marginalized over.
We will also study constraints on the linear growth rate of matter density perturbations,
| (2) |
where is the linear growth factor of matter perturbations (). We study these constraints in the modified gravity (MG) scenario where is allowed to deviate from its value in general relativity (GR), , with , Linder (2005). Given an amplitude of the linear power spectrum at , the amplitude of perturbations at () is computed based on our choice of . In other words, we force the amplitude of perturbations to be consistent with our growth factor parametrization. Moreover, for a given , the modified growth is taken into account to calculate the correct, corresponding primordial amplitude of perturbations, . This way, our treatment of CMB data is also consistent with .
To parametrize in the modified growth case, we introduce parameters, , describing a piecewise constant deviation from the GR value. We thus have one free parameter for each spectroscopic redshift bin, i.e. describes the growth factor in the redshift range for , and, in addition, is the growth factor in the range and the growth factor for (we assume that the growth history returns to that of GR well before so that the primary CMB anisotropies are not affected). The inclusion of free growth at redshifts beyond the range probed by galaxy clustering will have strong implications for the ability of WL or GC individually to constrain the low redshift growth history because the amplitude of matter fluctuations at the largest redshift probed by the spectroscopic survey is now no longer determined by the CMB measurement ( affects the translation of the amplitude of perturbations at CMB last scattering to that at low redshift). See, e.g., Hojjati et al. (2012) for a discussion of the effects of marginalizing over growth at high redshift. While we do not include this information in the present study, we do note that CMB lensing may help constrain , at least to some degree. When presenting our MG constraints on the growth factor, we marginalize over , (in modified gravity, the effective dark energy equation of state should be considered a parametrization of the expansion history) and the other parameters, so that a maximum of parameters are included in the Fisher matrix. We note that, if instead we were to fix when constraining growth, the constraints would be stronger, but only by (on the other hand, marginalizing over growth does strongly degrade the neutrino mass constraint).
III Surveys
We make predictions for the following three combinations of WL and GC surveys.
III.1 SuMIRe
The Subaru Measurement of Images and Redshifts (SuMIRe) combines the weak lensing/imaging data from the Hyper Suprime-Cam (HSC) survey and the spectroscopic data from the Prime Focus Spectrograph (PFS) cosmology survey. The survey specifications (and fiducial galaxy bias) we use can be found in our previous publication, de Putter et al. (2013). We choose the following binning,
-
•
:
-
•
:
III.2 EUCLID
The EUCLID satellite mission will provide both weak lensing and spectroscopic galaxy clustering data. Note that the EUCLID spectroscopic survey will be done using slit-less low-resolution spectroscopy, which does not need a pre-imaging survey to find the targets. We again follow the specifications outlined in de Putter et al. (2013). The binning choice is,
-
•
:
-
•
:
III.3 WFIRST
Finally, we consider the WFIRST satellite mission, which will also provide both weak lensing and galaxy clustering information. The WFIRST spectroscopic survey will use slit-less spectroscopy. Our assumed survey specifications mostly follow Spergel et al. (2013). Specifically, we assume both the lensing survey and the redshift survey will cover deg2. For the lensing survey, we assume an angular number density , and the same redshift distribution as we assumed for HSC (). We assume the source galaxies have galaxy bias and photometric redshift scatter (compared to for the previous two surveys). For the spectroscopic sample,, we assume a fiducial galaxy bias . We use the spectroscopic galaxy number density specified in Table 2-2 of Spergel et al. (2013). Finally, the binning choices are,
-
•
:
-
•
:
IV Results
IV.1 SuMIRe
IV.1.1 Dark Energy
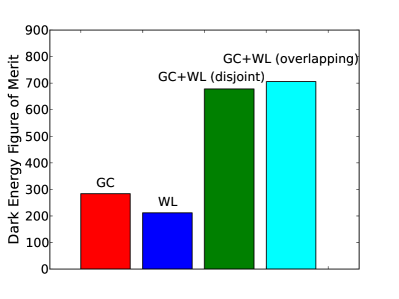
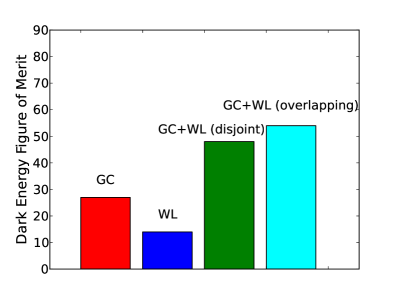
We consider first the dark energy figure of merit for the different survey combinations possible with HSC and PFS (SuMIRe). Figure 1 shows constraints for GC (PFS) only, WL (HSC) only and for GC + WL, with and without overlap (of course the actual surveys will overlap). The left panel shows the case where the clustering of lensing source galaxies is not included on the WL side. In this case, while both surveys individually (an implicit CMB prior is always included) deliver strong dark energy constraints, GC has significantly more constraining power. The two bars on the right (of the left panel) show that substantial improvements can be achieved by combining the two surveys, almost doubling the FOM compared to the case of GC alone. However, very little of this complementarity comes from the cross-correlations between the two sets of observables, and, accordingly, the difference in FOM between the overlapping and non-overlapping scenarios is not noteworthy. We will address the reasons why this is the case in Section V.
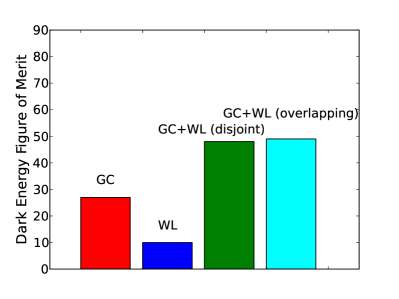
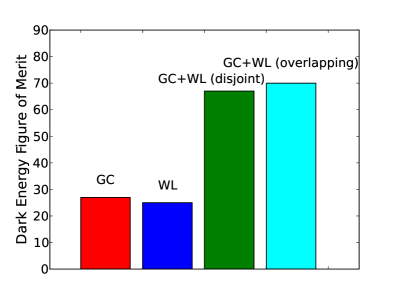
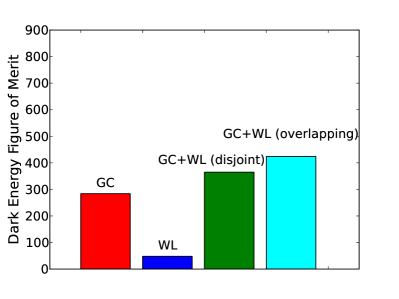
The right panel shows the case where all information from the imaging survey is used, i.e. both the shear and the clustering of source galaxies. With this included, WL alone is competitive with GC alone. There is again strong complementarity when the two probes are added, but the overlap still does not matter much.
The above of course does not take into account other benefits of the overlap between the two surveys. For example, in the case of SuMIRe, HSC imaging will provide an ideal multi-color catalog of galaxies to find targets for the follow-up spectroscopic PFS survey, which is extremely important. Moreover, if the photometric redshifts of the imaging survey cannot be properly calibrated using a deep spectroscopic training/validation sample, the cross-correlations with the GC survey can be used to improve the photo- calibration and thus make WL a stronger probe of dark energy, see, e.g., Newman (2008); Matthews and Newman (2010); Schulz (2010); Matthews and Newman (2012); McQuinn and White (2013); de Putter et al. (2013).
IV.1.2 Growth Factor
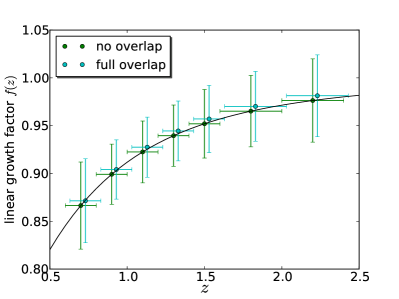
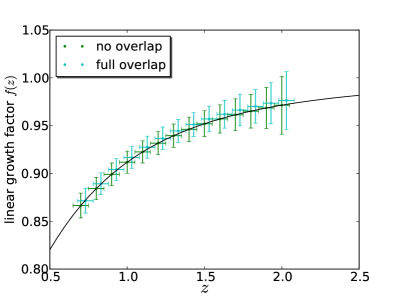
We next turn to constraints on the growth history, , in a modified gravity scenario, considering the bounds on the growth parameter in each spectroscopic redshift bin. As discussed previously, we marginalize over the growth factor at redshift both below and above the redshift range where galaxies are observed by PFS. This has important implications. In particular, marginalization over the growth parameter, , at implies that, even though the CMB measures both cosmological parameters and the amplitude of perturbations in the early universe, the CMB does not determine the amplitude of perturbations at redshifts where we observe large-scale structure (GC or WL). Schematically, GC measures the combinations and (where labels the redshift bin). With now unknown despite the CMB prior, both galaxy bias and the growth factor remain unconstrained. Since WL, through its dependence on the amplitude of matter perturbations, , is only sensitive to a degenerate combination of growth factor parameters (i.e. an integral over redshift of ), lensing alone (+CMB) yields rather poor growth factor constraints whether is left free or not, although constraints are better with this parameter fixed.
When the two probes are combined, the degeneracy discussed above is broken, and very strong () constraints can be obtained in all bins. Figure 2 shows these constraints both for the case of overlapping and disjoint surveys. The horizontal bars indicate the bin widths. While these constraints are strong, and will provide a strong test of general relativity, it again does not matter whether the surveys overlap or not.
IV.2 EUCLID
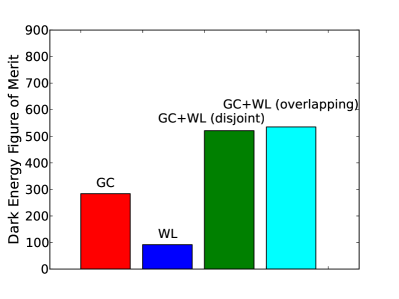
IV.2.1 Dark Energy
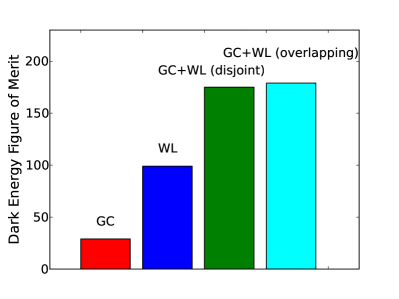
Figure 3 shows the forecasted dark energy constraints for EUCLID (cf. Figure 1). Focusing on the right panel, where the WL part of the survey includes information from the clustering of lensing source galaxies (see the left panel for the case where this information is neglected), we see that WL and GC surveys on their own give comparable constraints, as was the case for SuMIRe. We do wish to note, however, that the comparison between the two is strongly dependent on the treatment of non-linear scales for each probe. As a reminder, for GC, we apply a non-linear cutoff, ensuring that little information is included from the non-linear regime. WL shear, on the other hand, includes modes up to , and uses the information in the (HaloFit) non-linear matter power spectrum. It thus probes rather far into the non-linear regime, unlike GC. In both cases, we have tried to follow the more or less standard choices adopted in the literature, to ease comparison.
Considering the synergy between the weak lensing and galaxy clustering components, the picture is qualitatively the same as for SuMIRe: combining WL with GC strongly improves dark energy constraints compared to the individual surveys, but little is gained from overlap in sky coverage.
IV.2.2 Growth Factor
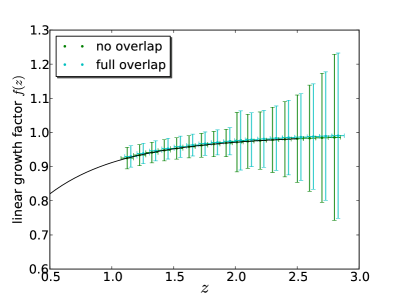
The growth factor constraints are shown in Figure 4 (cf. Figure 2). While constraints from any probe individually are again poor (), combining them, the growth factor can be measured to in each spectroscopic galaxy bin. Whether or not the surveys overlap again has little relevance.
IV.3 WFIRST
Finally, we show both the dark energy and growth factor results for WFIRST in Figure 5. In all cases, the lensing survey is assumed to use both the shear information and the clustering of source galaxies. Comparing the dark energy results (left panel) to SuMIRe (which has similar sky coverage), we find that the WFIRST spectroscopic survey looks comparable to PFS (SuMIRe). Comparing the results from the imaging survey component of WFIRST and SuMIRe, on the other hand, we find that the WFIRST lensing survey is significantly stronger than HSC. This is mainly explained by the large number density of the WFIRST source galaxies, vs. for HSC. In addition, we have assumed slightly better photometric redshifts for WFIRST ( vs. for SuMIRe and EUCLID). The joint dark energy constraints from WFIRST are much stronger than for SuMIRe, mainly because of the much more powerful imaging survey.
Considering next the growth factor constraints (right panel, Figure 5), the WL and GC individually are again unable to place meaningful constraints (and are therefore not shown in the figure), but for the combination of the two, we find relative uncertainties in the range (from low to high redshift). The joint constraints are thus comparable to those from SuMIRe at the low redshift end, but significantly weaker towards the highest redshifts. To explain this, we first note that the bounds are mainly driven by the spectroscopic survey, while the main role of the lensing survey is to help break degeneracies between and . While both spectroscopic surveys cover a deep, and equally broad redshift range ( for PFS and for WFIRST), the number density of galaxies in WFIRST drops to at , while the PFS galaxy density is at all redshifts. This mostly explains the degradation of constraints at the high redshift end of WFIRST. However, at all redshift, the difference in redshift bin width between the two surveys also has the effect of making WFIRST appear weaker. For SuMIRe, we used bins with width , while here we use , thus halving the volume available per bin and weakening the constraints within bins (but giving a larger number of independent measurements). If we had used equal bin widths, the WFIRST constraints would thus be stronger than those from SuMIRe at low redshift. At the high redshift end, the number density is the dominant effect however.
In conclusion, considering both the dark energy and growth factor constraints, we again find strong complementarity between weak lensing (plus source clustering) and spectroscopic galaxy clustering. However, as for the other surveys, the role of the overlap between surveys is very limited.
IV.4 Uncertainty in Photometric Redshift Distribution
We have seen in the previous subsections that, based on joint cosmological constraints only, overlap between surveys does not bring large advantages compared to surveys covering disjoint regions of the sky. One scenario in which cross-correlations between the two types of surveys can be very advantageous is when the photometric redshift distribution of the weak lensing survey has not been calibrated perfectly a priori Newman (2008); Matthews and Newman (2010); Schulz (2010); Matthews and Newman (2012); McQuinn and White (2013), for example because the training sample of spectroscopic galaxies is insufficiently large or complete. It has been shown in de Putter et al. (2013) that in this case the cross-correlations between the number densities of lensing source galaxies and spectroscopic galaxies (i.e. the spectra) can help calibrate the photo- distribution and thus strongly improve the cosmology constraints from weak lensing alone (in this case, the cosmological information in the spectroscopic galaxy clustering was not used). Therefore, if we repeat the analysis of the previous sections, but this time allowing for uncertainty in the photo- distribution, we might expect larger benefits from having the two surveys overlap.
To model the photometric redshift distribution, we follow the approach of de Putter et al. (2013) and treat the distribution as a Gaussian. We thus ignore the possibility of outliers in the distribution. For the bias and scatter, we assume, as before, a fiducial and . To model uncertainty in these quantities, we describe both functions by a spline with 11 nodes evenly spaced in redshift in the range . We assume the distribution is calibrated (e.g. using a deep, matching spectroscopic sample) at the level , where and are the values at the spline nodes. We then allow the data to self-calibrate the photo- parameters. As stated above, specifically the spectra are very useful for this. Unlike in de Putter et al. (2013), we still use the full cosmology information present in the spectroscopic galaxy sample. The analysis is thus the same as in previous sections, except with the 22 photo- parameters added.
We show results for the dark energy figure of merit in Figure 6. As expected, allowing for photo- distribution uncertainty leaves the spectroscopic galaxy clustering constraints unchanged, significantly weakens the FOM from weak lensing only, and weakens the joint constraints to a lesser extent. The FOM is lowered less when surveys overlap than when they do not, because overlapping surveys allow self-calibration using cross-correlations. However, the difference is still not spectacular: overlapping surveys give a larger FOM for SuMIRe and a larger FOM for EUCLID. Finally, we note that we did not apply a prior to the bias of the lensing source galaxies here, and that this could improve the photo- calibration somewhat and therefore the gains obtained from overlapping surveys.
V why does overlap not matter?
We have shown so far for all surveys we considered that there is strong complementarity between weak lensing (including clustering of source galaxies) and spectroscopic galaxy clustering in the sense that combining the two leads to large improvements in cosmological constraints. However, the role of overlap between surveys has proven to be limited. This is somewhat surprising given some of the literature on this topic Cai and Bernstein (2012); Gaztañaga et al. (2012); Kirk et al. (2013). To understand the lack of importance of overlap better, let us consider in more detail the difference between the overlapping and disjoint survey scenarios. In overlapping surveys, on the one hand, one can exploit the additional information present in the cross-spectra (i.e. and ). On the other hand, one measures a smaller number of independent modes when the surveys overlap (disjoint surveys offer twice the sky coverage). This loss of information is also quantified by the cross-spectra. For instance, the covariance between the spectra and is given by . One could thus imagine that our results are explained by the two above mentioned effects cancelling out. However, we find that this is not the case, and that instead, both effects are small individually. The real reason for overlap not making a difference is thus that the cross-spectra between probes contribute very little compared to the auto-spectra.
The main reason for this is that the effective number of 3D density modes probed by the cross-correlations is very small compared to the number of modes probed by either the lensing auto-spectra or the galaxy clustering auto-spectra (see Fig. 5 of Font-Ribera et al. (2013)). Heuristically, (spectroscopic) galaxy clustering probes a three-dimensional sphere in -space with radius given by Mpc, while shear probes mainly transverse modes in -space, but with a much larger non-linear cutoff, so that the numbers of modes in the two probes are within the same order of magnitude. The cross-spectra, however, probe only the overlapping region between the two volumes in -space, i.e. only transverse modes with a low cutoff Mpc. This volume thus contains a much smaller number of modes. We make this argument more quantitative below.
Consider SuMIRe for example. Ignoring for now the lost information due to shot noise, with our default choices of Mpc and (three tomographic bins with) , the total number of spectroscopic galaxy and shear modes explicitly included are (where is the survey volume) and respectively (this is a rough estimate and the true number of available shear modes is determined by the redshift width of the shear kernels rather than the number of tomographic bins). The number of overlapping modes is less straightforward to quantify. We cross-correlate transverse -modes with the and modes (with ). The number of shear (and also source density) modes is no larger than . This gives shear modes. Since this is smaller than the number of transverse -modes, the number of independent modes probed by cross-correlations cannot be larger than this, . This is merely of and of .
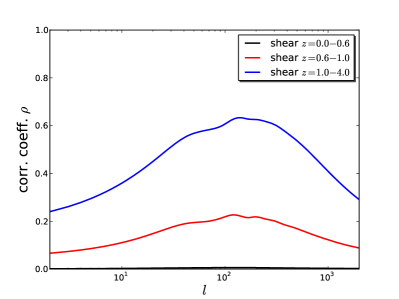
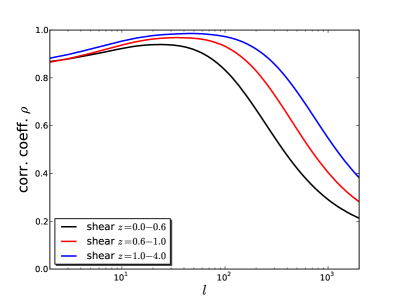
On top of this, it needs to be taken into account that the correlation between the shear modes and the spectroscopic modes is not optimal. Figure 7 (left panel) shows the effective correlation coefficient of each shear mode, as a function of multipole, with the full set of transverse spectroscopic galaxy density modes. We do not include shot noise or any non-linear cutoff in this plot. For a given shear mode, if the set of -modes probed all the 3D density modes contributing to that shear mode, the correlation would be optimal, . Instead, we see that is significantly smaller than unity. The main reason for this is the lack of overlap in redshift between the shear kernel and the spectroscopic galaxy distribution. The mean source redshift is so that the typical shear kernel peaks halfway between and . However, SuMIRe only includes galaxies at , thus missing a large fraction of the lensing kernel. The right panel of figure 7 shows how the correlation coefficient increases when spectroscopic galaxies are added at . This is in fact a very realistic scenario to consider, as spectroscopic galaxy clustering information from SDSS and BOSS can be included at . Now the correlation is much stronger although still not identically equal to one. However, while imposing full redshift overlap (by adding galaxies at ) strengthens the cross-correlation signal, we have checked that even after the galaxies have been added, the effect of survey overlap on dark energy and modified gravity constraints is negligible, thus confirming that the dominant reason for the lack of complementarity is the number of modes probed by the cross-correlations.
The counting of modes presented above does not include the effect of shot noise, which strongly reduces the effective number of modes accessible at small angular scales. As an alternative proxy for the effective number of modes we therefore consider
| (3) |
where is the diagonal Fisher matrix element corresponding to the amplitude . Thus, is simply the signal to noise of detecting the amplitude of the signal, including all modes up to the cutoff. In the case of a single angular power spectrum (i.e. a single redshift bin), this becomes
| (4) |
(the expression for a 3D power spectrum is very similar). If is an auto-power spectrum (as opposed to a cross-spectrum), in the absence of shot-noise, we have , so that
| (5) |
which is exactly the total number of modes. The presence of shot noise increases the variance and thus reduces . In the case of cross-correlations, also takes into account the reduced information due to the two fields not being optimally correlated. In the case of no shot noise, we for example have for the effective number of modes probed by ,
| (6) |
A correlation coefficient causes a reduction in the effective number of modes.
Using the above definition of , we find for the spectroscopic survey alone, for the imaging survey (combining the and modes), while the cross-correlations (i.e. and ) gives , which is a factor ten smaller than the number of modes probed by lensing and a factor twenty below the number probed by galaxy clustering.
In conclusion, given the limited effective number of modes available in the cross-spectra, it is not surprising that the overlap between surveys does not significantly affect the forecasted cosmology constraints. We find qualitatively similar mode counting results for the other surveys.
VI Conclusions and Discussion
VI.1 Summary of Results
We have studied dark energy and modified gravity constraints that can be obtained from the combination of weak lensing and spectroscopic galaxy redshift data that will be available from the SuMIRe, EUCLID and WFIRST surveys. For the weak lensing components of these surveys, we considered galaxy shear in tomographic bins, and the overdensity of lensing source galaxies. We assumed the lensing source galaxies have tomographic redshifts. For the spectroscopic galaxy clustering components of the surveys, we considered the three-dimensional, redshift-space overdensity field of the galaxies. Using the Fisher matrix formalism, we have quantified the information encoded in all available two-point functions of these observables, on large (linear and quasi-linear) scales. We always included a prior from Planck CMB data and marginalized over cosmological (and galaxy bias) parameters, including neutrino mass.
In all cases, we have found strong complementarity between the two probes. The dark energy figure of merit is up to a factor of larger when the probes are combined than for the strongest of the individual probes, and all three surveys promise strong constraints on the dark energy equation of state. Even more dramatically, treating the growth parameter, , as a free function (i.e. allowing for deviations from general relativity), we find that the combination of a weak lensing with a galaxy clustering survey can constrain at the few percent level, while each survey individually has negligible constraining power.
While all three combinations of surveys studied here have full sky overlap of the weak lensing and spectroscopic components, we have also studied how the forecasted constraints depend on survey overlap. We have done this by comparing forecasts for the fully overlapping case to the case where the surveys are described by the exact same specifications, except that the imaging and spectroscopic components now cover disjoint regions of the sky. We have found for all three survey combinations that the difference in constraining power between these two scenarios is small (typically differences in uncertainties and figures of merit). Following Font-Ribera et al. (2013) (see their Appendix B for a clear, qualitative explanation), we attribute this to the small number of three-dimensional density modes probed by the cross-correlations between the survey observables, as compared to the number of modes probed by the auto-correlations within each survey. We have shown, that the number of modes probed by the cross-correlations depends on the method used to do the calculation, but is no more than of the smallest number of modes probed by each survey individually. Moreover, we found that for the surveys under consideration in this work, the limited redshift overlap between the spectroscopic redshift distribution and lensing kernels weakens the cross-correlations between these observables. However, while enhancing the redshift coverage of the spectroscopic survey by adding galaxies at low redshift improves the level of correlation between the surveys, we have checked that the same-sky benefit is small even in that case.
Finally, we have included the possibility of uncertainty in the parameters describing the photo- distributions, following the methodology described in de Putter et al. (2013). In this case, it is known that cross-correlations of the lensing source galaxies with a spectroscopic sample can help calibrate the photo- distribution. Thus, one might expect larger same-sky benefits in this case. We found, however, that this is not a large effect. The boost in dark energy figure of merit due to covering the same sky area is at most , when photo- scatter and bias are treated as free parameters.
VI.2 Comparison with Literature
It is worth commenting on the current status in the literature of the question of same-sky benefits, i.e. the question of how much better (if at all) dark energy and/or modified gravity constraints from overlapping survey are compared to those from disjoint surveys. There are a number of groups that have recently addressed this issue, or are in the process of doing so, but results vary strongly. To crudely summarize, Cai and Bernstein (2012) find only modest same-sky benefits for realistic survey galaxy number densities and Font-Ribera et al. (2013) also finds results consistent with ours. On the other hand, Gaztañaga et al. (2012) found enormous increases in figure of merit (up to a factor of 100, although not the same figure of merit as considered here), and, more recently, Kirk et al. (2013) also found large same-sky improvement factors (a factor for dark energy in their abstract). In addition, several groups Song (2013); Gaztanaga (2013) are working on new results, and thus add to the variety of answers.
While a comparison between the various groups is not easy because of different choices of survey properties, it is unlikely that survey specifications can explain why some groups find large () improvement factors, while others find only modest improvement factors, if any. An interesting work to compare with is the one by Kirk et al. (2013), first of all, because it is public (available on the arXiv) and, secondly, because it presents such different results compared to ours. The major difference between Kirk et al. (2013) on the one hand and the present article (and also Cai and Bernstein (2012); Gaztañaga et al. (2012); Font-Ribera et al. (2013)) on the other hand, is the forecast method. While we consider the three-dimensional power spectrum of spectroscopic galaxies, Kirk et al. (2013) treat the spectroscopic galaxy density purely in terms of angular power and cross-spectra. While a large number of spectroscopic redshift bins is used, , this still implies a bin width , corresponding to a comoving distance Mpc (at ), over which line-of-sight clustering information is lost. On the upside, this approach allows the use of a single, consistent method to describe all data and their covariances, and no Limber approximation is used to compute the angular spectra.
We have tried to reproduce the same-sky benefits of Kirk et al. (2013) by emulating their survey assumptions as much as possible given the information provided in the article. Moreover, to mimic their treatment of the galaxy clustering information, we have performed calculations either using angular spectra in 40 bins (however, still using the Limber approximation) or by using a three-dimensional power spectrum, but with a line-of-sight degradation factor smoothing out information on scales smaller than that of the bin width. While neither of these methods matches exactly the approach of Kirk et al. (2013) (because we are not set up to do a forecast based on exact angular power spectra, i.e. without assuming the Limber approximation), one would expect to be able to at least approximately reproduce their results. Unfortunately, even with these changes, we cannot reach improvement factors for the dark energy figure of merit better than , while Kirk et al. (2013) find factors of for their case of scale-independent galaxy bias (although we are not sure whether this result includes the CMB prior or not).
We have also checked that the lack of same-sky benefits in our forecasts is not driven by our perhaps optimistic assumptions about modeling of galaxy clustering in the non-linear regime, Mpc (although, we remind the reader that we always exponentially suppress information at scales Mpc to take into account bulk flows Seo and Eisenstein (2007)). To this end, we have repeated our analysis for SuMIRe with Mpc. While the resulting dark energy and growth constraints are significantly weaker than for Mpc, the results remain the same qualitatively: combining the two surveys strongly improves constraints, but it hardly matters whether the surveys overlap or not.
While we are very confident in our results, it is important to resolve/explain the differences between groups and for the community to converge on a single answer to and understanding of the question of same-sky benefits, as this is an important consideration when designing future surveys. There has been some effort to resolve the differences as part of a MS-DESI working group, but clearly more work needs to be done to reach a resolution.
VI.3 Other Sources of Synergy
Although throughout this paper we have focused on the large-scale galaxy clustering information up to to avoid uncertainties inherent in non-linear processes such as galaxy formation, several groups Cacciato et al. (2013); Reddick et al. (2013); Hikage et al. (2012a, b); Hikage and Yamamoto (2013) have proposed promising methods for using the small-scale clustering signal, where the signal-to-noise ratio is much higher, in order to infer the connection of galaxies to dark matter halos. In particular, Cacciato et al. (2013); Hikage et al. (2012b) showed that the cross-correlations of spectroscopic galaxies with shapes of background galaxies, or with the positions of photometric galaxies at similar redshifts to the spectroscopic galaxies, are useful to constrain the galaxy-halo connection and then improve the cosmological interpretation of the large-scale clustering signal. The small-scale clustering information might thus offer a further promising synergy of imaging and spectroscopic galaxies, beyond what we discussed in this paper, if our understanding of galaxy formation at small scales is improved, or a robust, empirical method to calibrate these uncertainties is developed. These methods can only be applied if the imaging and spectroscopic surveys overlap on the sky.
Other types of synergy between overlapping surveys not studied in this work are the fact that the imaging survey can be used to create a target catalog for the spectroscopic survey, and the fact that the combination of the two data sets will be robust against systematics that affect only weak lensing, or only galaxy clustering.
VII acknowledgments
Part of the research described in this paper was carried out at the Jet Propulsion Laboratory, California Institute of Technology, under a contract with the National Aeronautics and Space Administration. This work is supported by NASA ATP grant 11-ATP-090. MT was supported by World Premier International Research Center Initiative (WPI Initiative), MEXT, Japan, by the FIRST program “Subaru Measurements of Images and Redshifts (SuMIRe)”, CSTP, Japan, and by Grant-in-Aid for Scientific Research from the JSPS Promotion of Science (23340061). We also acknowledge the input of Sudeep Das, who wrote an early version of the Fisher matrix code which some of the code we used for this work builds on.
References
- Massey et al. (2007a) R. Massey, J. Rhodes, A. Leauthaud, P. Capak, R. Ellis, A. Koekemoer, A. Réfrégier, N. Scoville, J. E. Taylor, J. Albert, et al., Astrophys.J.Supp. 172, 239 (2007a), eprint arXiv:astro-ph/0701480.
- Massey et al. (2007b) R. Massey, J. Rhodes, R. Ellis, N. Scoville, A. Leauthaud, A. Finoguenov, P. Capak, D. Bacon, H. Aussel, J. Kneib, et al., Nature 445, 286 (2007b), eprint arXiv:astro-ph/0701594.
- Fu et al. (2008) L. Fu, E. Semboloni, H. Hoekstra, M. Kilbinger, L. van Waerbeke, I. Tereno, Y. Mellier, C. Heymans, J. Coupon, K. Benabed, et al., Astronomy & Astrophysics 479, 9 (2008), eprint arXiv:0712.0884.
- Schrabback et al. (2009) T. Schrabback, J. Hartlap, B. Joachimi, M. Kilbinger, P. Simon, K. Benabed, M. Bradač, T. Eifler, T. Erben, C. D. Fassnacht, et al., ArXiv e-prints (2009), eprint arXiv:0911.0053.
- Huff et al. (2011) E. M. Huff, T. Eifler, C. M. Hirata, R. Mandelbaum, D. Schlegel, and U. Seljak, ArXiv e-prints (2011), eprint 1112.3143.
- Kilbinger et al. (2013) M. Kilbinger, L. Fu, C. Heymans, F. Simpson, J. Benjamin, T. Erben, J. Harnois-Déraps, H. Hoekstra, H. Hildebrandt, T. D. Kitching, et al., Mon. Not. R. Astron. Soc. 430, 2200 (2013), eprint 1212.3338.
- Heymans et al. (2013) C. Heymans, E. Grocutt, A. Heavens, M. Kilbinger, T. D. Kitching, F. Simpson, J. Benjamin, T. Erben, H. Hildebrandt, H. Hoekstra, et al., ArXiv e-prints (2013), eprint 1303.1808.
- York et al. (2000) D. G. York, J. Adelman, J. E. Anderson, Jr., S. F. Anderson, J. Annis, N. A. Bahcall, J. A. Bakken, R. Barkhouser, S. Bastian, E. Berman, et al., Astronomical Journal 120, 1579 (2000), eprint arXiv:astro-ph/0006396.
- Colless et al. (2003) M. Colless, B. A. Peterson, C. Jackson, J. A. Peacock, S. Cole, P. Norberg, I. K. Baldry, C. M. Baugh, J. Bland-Hawthorn, T. Bridges, et al., ArXiv Astrophysics e-prints (2003), eprint arXiv:astro-ph/0306581.
- Jones et al. (2009) D. H. Jones, M. A. Read, W. Saunders, M. Colless, T. Jarrett, Q. A. Parker, A. P. Fairall, T. Mauch, E. M. Sadler, F. G. Watson, et al., Mon. Not. R. Astron. Soc. 399, 683 (2009), eprint 0903.5451.
- Parkinson et al. (2012) D. Parkinson, S. Riemer-Sørensen, C. Blake, G. B. Poole, T. M. Davis, S. Brough, M. Colless, C. Contreras, W. Couch, S. Croom, et al., Phys. Rev. D 86, 103518 (2012), eprint 1210.2130.
- Dawson et al. (2013) K. S. Dawson, D. J. Schlegel, C. P. Ahn, S. F. Anderson, É. Aubourg, S. Bailey, R. H. Barkhouser, J. E. Bautista, A. Beifiori, A. A. Berlind, et al., Astronomical Journal 145, 10 (2013), eprint 1208.0022.
- Guzzo et al. (2013) L. Guzzo, M. Scodeggio, B. Garilli, B. R. Granett, U. Abbas, C. Adami, S. Arnouts, J. Bel, M. Bolzonella, D. Bottini, et al., ArXiv e-prints (2013), eprint 1303.2623.
- Eisenstein et al. (2005) D. J. Eisenstein, I. Zehavi, D. W. Hogg, R. Scoccimarro, M. R. Blanton, R. C. Nichol, R. Scranton, H.-J. Seo, M. Tegmark, Z. Zheng, et al., Astrophys. J. 633, 560 (2005), eprint arXiv:astro-ph/0501171.
- Cole et al. (2005) S. Cole, W. J. Percival, J. A. Peacock, P. Norberg, C. M. Baugh, C. S. Frenk, I. Baldry, J. Bland-Hawthorn, T. Bridges, R. Cannon, et al., Mon. Not. R. Astron. Soc. 362, 505 (2005), eprint arXiv:astro-ph/0501174.
- Beutler et al. (2011) F. Beutler, C. Blake, M. Colless, D. H. Jones, L. Staveley-Smith, L. Campbell, Q. Parker, W. Saunders, and F. Watson, Mon. Not. R. Astron. Soc. 416, 3017 (2011), eprint 1106.3366.
- Blake et al. (2011) C. Blake, E. A. Kazin, F. Beutler, T. M. Davis, D. Parkinson, S. Brough, M. Colless, C. Contreras, W. Couch, S. Croom, et al., Mon. Not. R. Astron. Soc. 418, 1707 (2011), eprint 1108.2635.
- Anderson et al. (2012) L. Anderson, E. Aubourg, S. Bailey, D. Bizyaev, M. Blanton, A. S. Bolton, J. Brinkmann, J. R. Brownstein, A. Burden, A. J. Cuesta, et al., Mon. Not. R. Astron. Soc. 427, 3435 (2012), eprint 1203.6594.
- de Jong et al. (2013) J. T. A. de Jong, G. A. Verdoes Kleijn, K. H. Kuijken, and E. A. Valentijn, Experimental Astronomy 35, 25 (2013), eprint 1206.1254.
- (20) http://www.darkenergysurvey.org/
- (21) http://www.naoj.org/Projects/HSC/index.html
- (22) http://www.lsst.org/
- Laureijs et al. (2011) R. Laureijs, J. Amiaux, S. Arduini, J. . Auguères, J. Brinchmann, R. Cole, M. Cropper, C. Dabin, L. Duvet, A. Ealet, et al., ArXiv e-prints (2011), eprint 1110.3193.
- Spergel et al. (2013) D. Spergel, N. Gehrels, J. Breckinridge, M. Donahue, A. Dressler, B. S. Gaudi, T. Greene, O. Guyon, C. Hirata, J. Kalirai, et al., ArXiv e-prints (2013), eprint 1305.5422.
- Hill et al. (2008) G. J. Hill, K. Gebhardt, E. Komatsu, N. Drory, P. J. MacQueen, J. Adams, G. A. Blanc, R. Koehler, M. Rafal, M. M. Roth, et al., in Panoramic Views of Galaxy Formation and Evolution, edited by T. Kodama, T. Yamada, and K. Aoki (2008), vol. 399 of Astronomical Society of the Pacific Conference Series, p. 115, eprint 0806.0183.
- Ellis et al. (2012) R. Ellis, M. Takada, H. Aihara, N. Arimoto, K. Bundy, M. Chiba, J. Cohen, O. Dore, J. E. Greene, J. Gunn, et al., ArXiv e-prints (2012), eprint 1206.0737.
- Levi et al. (2013) M. Levi, C. Bebek, T. Beers, R. Blum, R. Cahn, D. Eisenstein, B. Flaugher, K. Honscheid, R. Kron, O. Lahav, et al., ArXiv e-prints (2013), eprint 1308.0847.
- Yoo and Seljak (2012) J. Yoo and U. Seljak, Phys. Rev. D 86, 083504 (2012), eprint 1207.2471.
- Hikage et al. (2012a) C. Hikage, M. Takada, and D. N. Spergel, Mon. Not. R. Astron. Soc. 419, 3457 (2012a), eprint 1106.1640.
- Hikage et al. (2012b) C. Hikage, R. Mandelbaum, M. Takada, and D. N. Spergel, ArXiv e-prints (2012b), eprint 1211.1009.
- McDonald and Seljak (2009) P. McDonald and U. Seljak, JCAP 10, 007 (2009), eprint 0810.0323.
- Guzik et al. (2010) J. Guzik, B. Jain, and M. Takada, Phys. Rev. D 81, 023503 (2010), eprint 0906.2221.
- Cai and Bernstein (2012) Y.-C. Cai and G. Bernstein, Mon. Not. R. Astron. Soc. 422, 1045 (2012), eprint 1112.4478.
- Gaztañaga et al. (2012) E. Gaztañaga, M. Eriksen, M. Crocce, F. J. Castander, P. Fosalba, P. Marti, R. Miquel, and A. Cabré, Mon. Not. R. Astron. Soc. 422, 2904 (2012), eprint 1109.4852.
- Kirk et al. (2013) D. Kirk, O. Lahav, S. Bridle, S. Jouvel, F. B. Abdalla, and J. A. Frieman, ArXiv e-prints (2013), eprint 1307.8062.
- Font-Ribera et al. (2013) A. Font-Ribera, P. McDonald, N. Mostek, B. A. Reid, H.-J. Seo, and A. Slosar, ArXiv e-prints (2013), eprint 1308.4164.
- Tegmark et al. (1997) M. Tegmark, A. Taylor, and A. Heavens, Astrophys.J. 480, 22 (1997).
- Limber (1954) D. N. Limber, Astrophys. J. 119, 655 (1954).
- Loverde and Afshordi (2008) M. Loverde and N. Afshordi, Phys. Rev. D 78, 123506 (2008), eprint 0809.5112.
- Lewis et al. (2000) A. Lewis, A. Challinor, and A. Lasenby, Astrophys.J. 538, 473 (2000), eprint arXiv:astro-ph/9911177.
- Smith et al. (2003) R. E. Smith, J. A. Peacock, A. Jenkins, S. D. M. White, C. S. Frenk, F. R. Pearce, P. A. Thomas, G. Efstathiou, and H. M. P. Couchman, Mon. Not. R. Astron. Soc. 341, 1311 (2003), eprint arXiv:astro-ph/0207664.
- Takahashi et al. (2012) R. Takahashi, M. Sato, T. Nishimichi, A. Taruya, and M. Oguri, Astrophys. J. 761, 152 (2012), eprint 1208.2701.
- de Putter et al. (2013) R. de Putter, O. Doré, and S. Das, ArXiv e-prints (2013), eprint 1306.0534.
- Seo and Eisenstein (2007) H.-J. Seo and D. J. Eisenstein, Astrophys. J. 665, 14 (2007), eprint arXiv:astro-ph/0701079.
- Eisenstein et al. (2007) D. J. Eisenstein, H.-J. Seo, E. Sirko, and D. N. Spergel, Astrophys. J. 664, 675 (2007), eprint arXiv:astro-ph/0604362.
- Fang et al. (2008) W. Fang, W. Hu, and A. Lewis, Phys. Rev. D 78, 087303 (2008), eprint 0808.3125.
- Albrecht et al. (2006) A. Albrecht, G. Bernstein, R. Cahn, W. L. Freedman, J. Hewitt, W. Hu, J. Huth, M. Kamionkowski, E. W. Kolb, L. Knox, et al., ArXiv Astrophysics e-prints (2006), eprint arXiv:astro-ph/0609591.
- Linder (2005) E. V. Linder, Phys. Rev. D 72, 043529 (2005), eprint arXiv:astro-ph/0507263.
- Hojjati et al. (2012) A. Hojjati, G.-B. Zhao, L. Pogosian, A. Silvestri, R. Crittenden, and K. Koyama, Phys. Rev. D 85, 043508 (2012), eprint 1111.3960.
- Newman (2008) J. A. Newman, Astrophys. J. 684, 88 (2008), eprint 0805.1409.
- Matthews and Newman (2010) D. J. Matthews and J. A. Newman, Astrophys. J. 721, 456 (2010), eprint 1003.0687.
- Schulz (2010) A. E. Schulz, Astrophys. J. 724, 1305 (2010), eprint 0910.3683.
- Matthews and Newman (2012) D. J. Matthews and J. A. Newman, Astrophys. J. 745, 180 (2012), eprint 1109.2121.
- McQuinn and White (2013) M. McQuinn and M. White, ArXiv e-prints (2013), eprint 1302.0857.
- Song (2013) Y.-S. Song (2013).
- Gaztanaga (2013) E. Gaztanaga (2013).
- Cacciato et al. (2013) M. Cacciato, F. C. van den Bosch, S. More, H. Mo, and X. Yang, Mon. Not. R. Astron. Soc. 430, 767 (2013), eprint 1207.0503.
- Reddick et al. (2013) R. Reddick, J. Tinker, R. Wechsler, and Y. Lu, ArXiv e-prints (2013), eprint 1306.4686.
- Hikage and Yamamoto (2013) C. Hikage and K. Yamamoto, JCAP 8, 019 (2013), eprint 1303.3380.