Multi-Wavelength Studies of Spectacular Ram Pressure Stripping of a Galaxy. II. Star Formation in the Tail
Abstract
With multiband photometric data in public archives, we detected four intracluster star-forming regions in the Virgo cluster. Two of them were at a projected distance of 35 kpc away from NGC 4388, and the other two were 66 kpc away. Our new spectroscopic observation revealed that their recession velocities were comparable to the ram-pressure-stripped tail of NGC 4388 and confirmed their association. The stellar mass of the star-forming regions ranged from - except for that of the faintest one which would be M⊙. The metallicity was comparable to the solar abundance, and the age of the stars was years. Their young stellar age meant that the star formation should have started after the gas was stripped from NGC 4388. This implied in situ condensation of the stripped gas. We also found that two star-forming regions lay near the leading edge of a filamentary dark cloud. The extinction of the filament was smaller than that derived from the Balmer decrement of the star-forming regions. It implied that the dust in the filament would be locally dense around the star-forming regions.
1 Introduction
In a cluster of galaxies, the galactic interstellar medium can be transferred into intergalactic space by various processes (Boselli & Gavazzi, 2006, and references therein). The fate of the gas is, however, still not totally understood. Some of the gas would be cooled to form stars in intergalactic space; some would accrete back to the parent galaxy or to other galaxies in the cluster and some would be heated to become hot plasma in the cluster.
If the gas is heated to K, it would be observed in X-ray. Actually, such X-ray tails associated with galaxies have been reported by many studies (e.g., Iwasawa et al., 2003; Wang et al., 2004; Machacek et al., 2005; Sun&Vikhlinin, 2005; Sun et al., 2006; Fujita et al., 2006; Machacek et al., 2006; Sun et al., 2007, 2010; Weżgowiec et al., 2011; Gu et al., 2013). The gas in the ionization-recombination balance phase would be observed in H. Galaxies’ H “tails” have also been reported by many studies (e.g., Gavazzi et al., 2000, 2001; Yoshida et al., 2002; Sun et al., 2007; Yagi et al., 2007; Kenney et al., 2008; Sun et al., 2010; Smith et al., 2010; Yagi et al., 2010; Fossati et al., 2012). If the gas remains cool, it would observed in radio waves as HI tails (e.g., Oosterloo & van Gorkom, 2005; Chung et al., 2007; Vollmer&Huchtmeier, 2007), or molecular clouds (e.g., Vollmer et al., 2008, 2012). Several studies have presented models and and simulations of the evolution of the gas in galaxies (e.g., Roediger et al., 2006; Roediger&Brüggen, 2007, 2008; Kepferer et al., 2008; Tonnesen&Bryan, 2012).
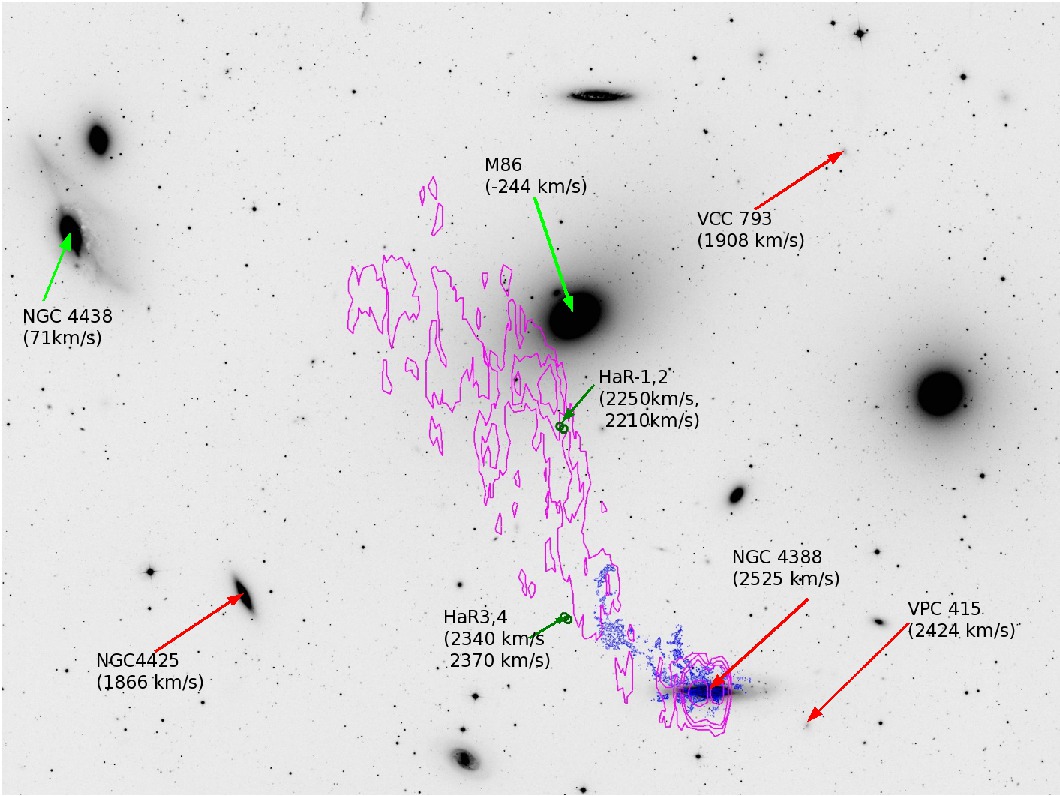
Note that the coexistence of the X-ray, H and HI phase in a tail is rare (Roediger, 2009; Sun et al., 2010). NGC 4388 in the Virgo cluster is one of the rare samples. From deep H imaging, Yoshida et al. (2002) discovered a very extended ionized region near the galaxy. The region was spectroscopically observed with the Faint Object Camera and Spectrograph (Kashikawa et al., 2002, FOCAS) at the Subaru Telescope (Yoshida et al., 2004). Yoshida et al. (2004) confirmed that the region had a recession velocity comparable to that of NGC 4388. They also argued that the H tail would have been made by ram-pressure stripping (Gunn & Gott, 1972; Fujita & Nagashima, 1999). Oosterloo & van Gorkom (2005) observed the region in HI 21cm with the Westerbork Synthesis Radio Telescope and found that the HI tail extends far distant to kpc from NGC 4388. Kenney et al. (2008) discovered another group of H clouds between NGC 4438 to the east and M86 to the west. The clouds have 0 heliocentric recession velocity. Some part of the NGC 4438-M86 H clouds overlap the extended gas of NGC 4388, but the difference of the heliocentric recession velocity enables us to distinguish them. And recently, the association of an X-ray gas to the tail near NGC 4388 was reported by Weżgowiec et al. (2011).
The origin of the tail of NGC 4388 was discussed in several studies. Vollmer (2009) assumed that NGC 4388 is about 150 Myr after the closest approach to the cluster center, i.e. M87, and calculated the tangential velocities and the line-of-sight distance. They also mentioned the possibility that the tail was formed by the ram pressure from the intracluster medium (ICM) of the M86 group.
In the first paper of this series (Gu et al., 2013, hereafter paper I), we reported that the HI gas accompanies the hot X-ray gas even 100 kpc away from NGC 4388, and NGC 4388 and its HI tail lie in front of M86 system. We compared the effect of the ICM of the M86 group and that of the Virgo cluster (M87), and concluded that the tail would have been made by ram-pressure stripping of ICM of the Virgo cluster.
In this paper, we report the identification of four intracluster/intergalactic star-forming regions in the Virgo cluster, which are associated with the HI tail of NGC 4388. Intergalactic star formation in stripped gas from a galaxy was reported by several authors (Owen et al., 2006; Sun et al., 2007; Cortese et al., 2007; Yoshida et al., 2008; Sun et al., 2010; Sivanandam et al., 2010; Smith et al., 2010; Hester et al., 2010; Fumagalli et al., 2011; Abramson et al., 2011; Fossati et al., 2012; Yoshida et al., 2012; Arrigoni Battaia et al., 2012; Boissier et al., 2012; Ohyama & Hota, 2013). Besides those in the tails, isolated star-forming regions in the Virgo cluster were also reported (Gerhard et al., 2002; Arnabildi et al., 2003; Cortese et al., 2003, 2004). Kronberger et al. (2008) and Kapferer et al. (2009) simulated the ram-pressure stripping of a galaxy and the star formation in the tail. Kronberger et al. (2008) showed that a significant fraction of stars would be formed in the tail, and Kapferer et al. (2009) predicted that young stars would be detectable throughout the whole tail up to 400 kpc. Yamagami&Fujita (2011) showed that molecular clouds should be formed in the tail. The study in this paper would be directly compared with these model predictions.
The structure of this paper is as follows; In Section 2 and Appendix A, we described the data we used, which includes a new spectroscopic observation. The spectroscopic data were analysed in Section 3, and physical parameters of four H emitting regions were derived. The nature of the regions was discussed in Section 4, and summarized in Section 5. We adopt the distance to NGC 4388 and its tail as 16.7 Mpc (Yoshida et al., 2002). The distance modulus is m-M=31.11, and one arcsec corresponds to 81.0 pc. The magnitude system is AB-system (Oke & Gunn, 1983) unless otherwise noted.
2 Data
2.1 Imaging data
For detailed analysis of the H counterpart along the NGC 4388 tail, we retrieved data obtained with the Subaru Prime Focus Camera (Suprime-Cam Miyazaki et al., 2002) around the HI tail in N-A-L659 filter (Yoshida et al., 2002; Okamura et al., 2002; Hayashino et al., 2003, NA659 hereafter) and R (W-C-RC)-band filter. The center wavelength of NA659 was 6600Å and the full width at half maximum (FWHM) was 100Å, which corresponds to H in recession velocity of =17002300 km s-1. The NA659 imaging dataset was the same as that used in Yoshida et al. (2002), but we reprocessed it from the raw data for this paper. Recently, the region was observed much deeper in R-band. We used the data for the continuum subtraction. Also, V (W-J-V), i (W-S-I+), and N-A-L503 (Yoshida et al., 2002; Okamura et al., 2002; Hayashino et al., 2003, NA503 hereafter) were available. The center wavelength of NA503 was 5020Å and FWHM was 100Å. NA503 covered [OIII]4959 and [OIII]5007 at recession velocity =36803020, and =7803000 km s-1, and did not cover H in the Virgo cluster. The detail of the Suprime-Cam data reduction is given in Appendix A. In the Appendix, the data in other wavelength are also described.
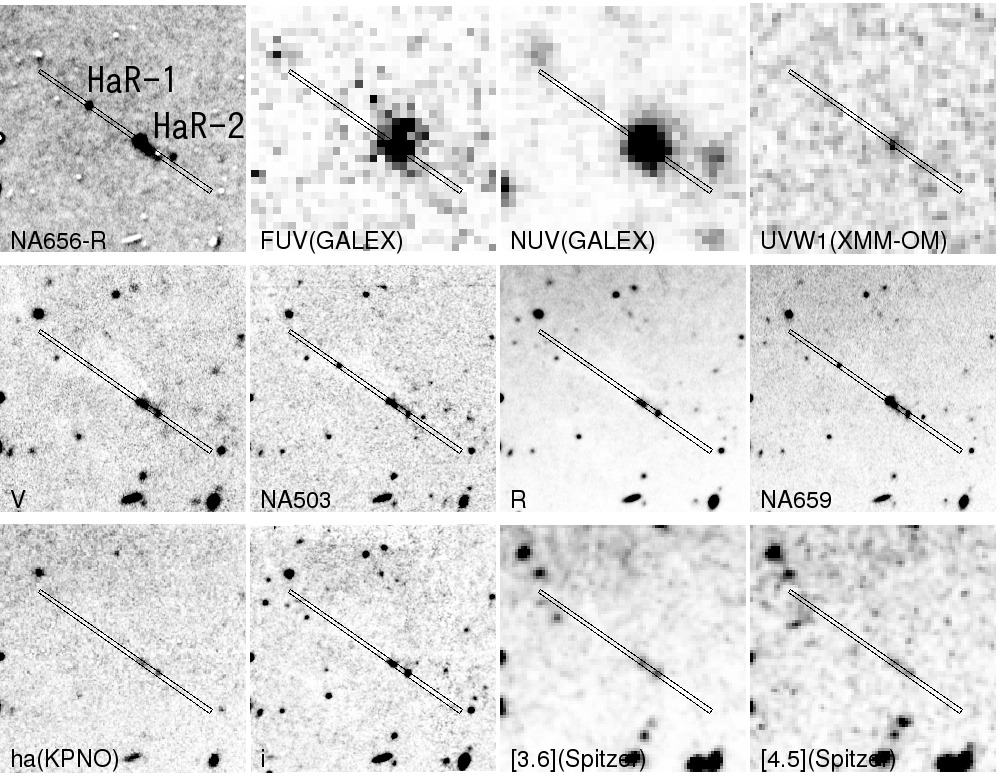
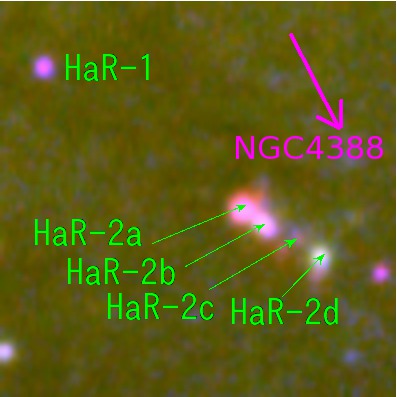
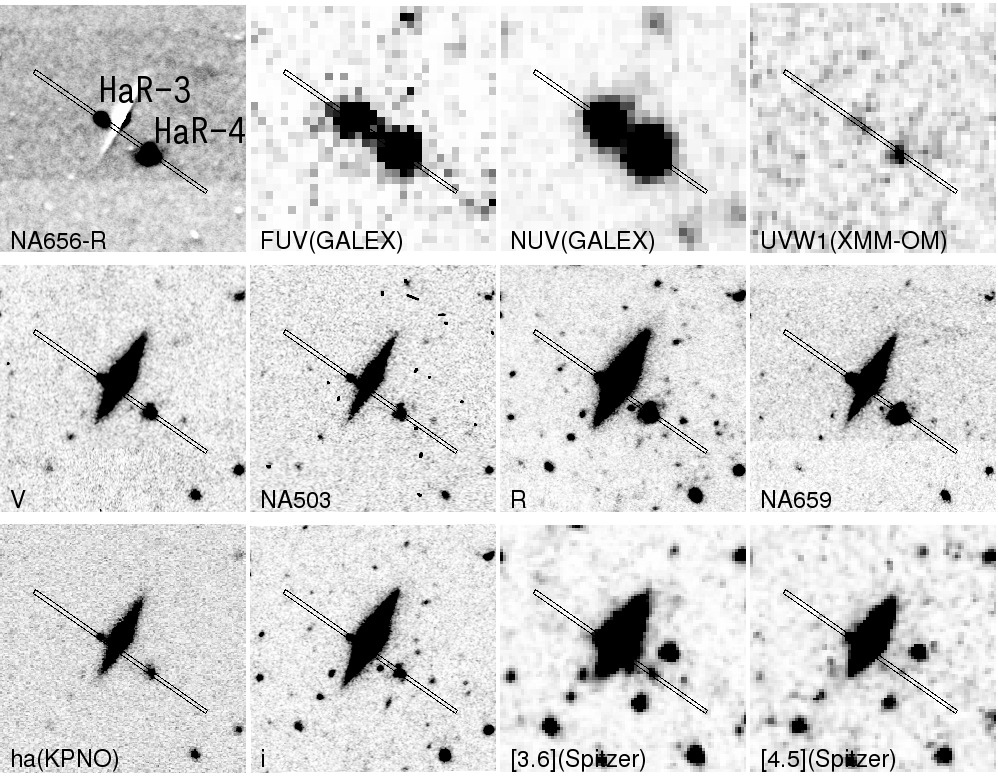
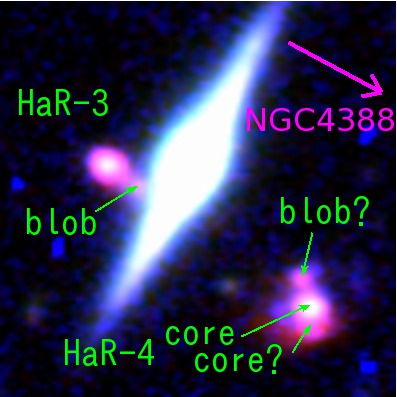
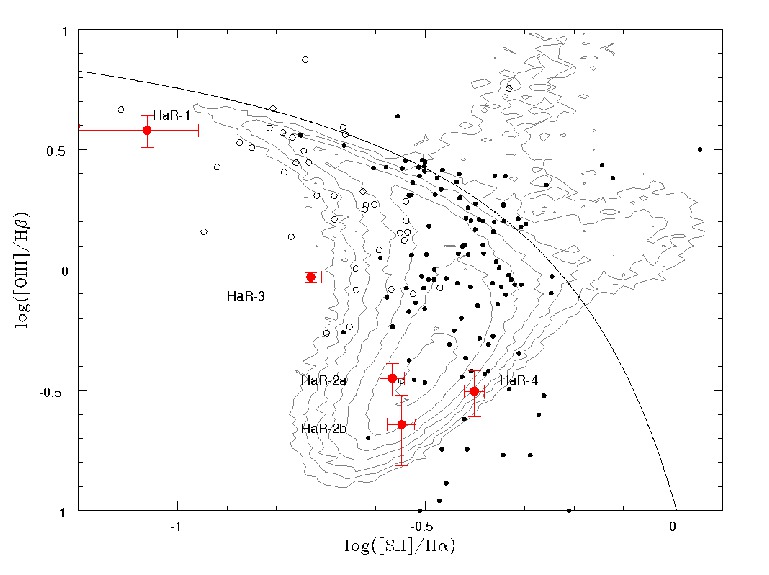
From eye inspection, we selected two fields for spectroscopic observation. We call the four clumps of the H emitting regions HaR-1, 2, 3, and 4 from the north to the south (Figure 1). Their appearances are shown in Figures 2 and 3, and coordinates are given in Table 1. HaR-2 consists of several sub-clumps. We call them HaR-2a, 2b, 2c and 2d, from the north to the south, respectively. Their multiband magnitudes are given in Tables 2 and 3. It should be noted that there are other H emitting regions around the tail. The sampling of the H emitting region in this study was not a complete selection.
2.2 Spectroscopic data
2.2.1 FOCAS Observation and data reduction
We carried out a longslit spectroscopy at the two fields (HaR-1,2 and HaR-3,4) on 2013-03-03(UT) with the Faint Object Camera and Spectrograph (Kashikawa et al., 2002, FOCAS) attached to the Subaru Telescope. We used the longslit of 0.8 arcsec width, and 300B grism without order-cutting filters. The dispersion was 1.38 Å pixel-1. The pixel scale of the FOCAS data was 0.207 arcsec along the slit.
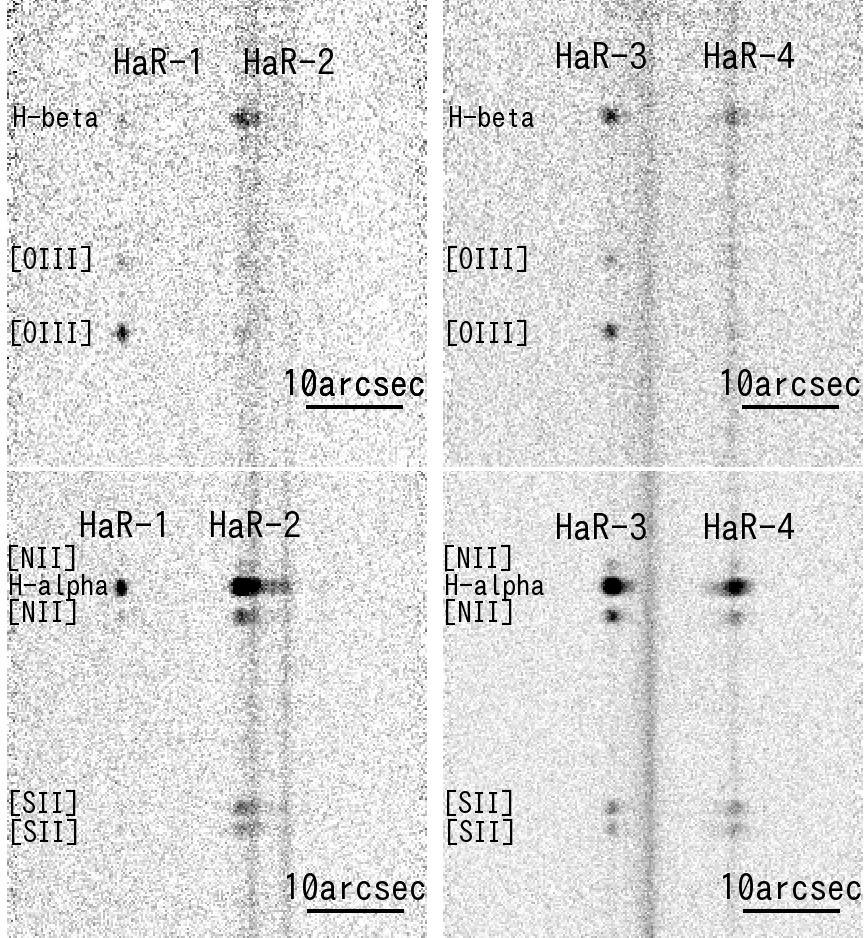
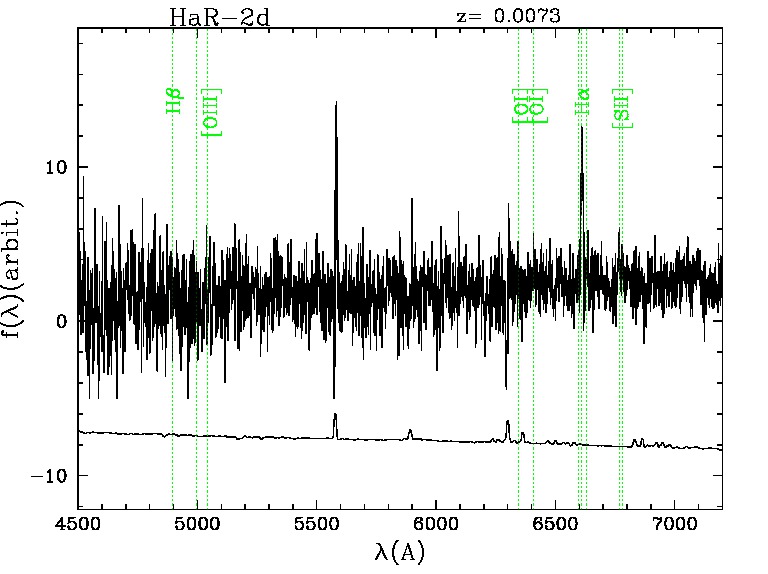
The data reduction was done in a standard manner: overscan was subtracted and flat-fielded. Cosmic rays are removed by python implementation of LA Cosmic package (van Dokkum, 2001)111http://obswww.unige.ch/~tewes/cosmics_dot_py/. The wavelength was calibrated using the sky emissions and the Thorium-Argon comparison lamp obtained during the observation. The measured instrumental profile was 9 Å in FWHM. Then, the sky emissions and the absorption features of sky background (mainly moonlights) are subtracted. The 2D spectra around H and H are shown in Figure 4.
Feige 67 was observed with longslit of 2.0 arcsec width as a spectrophotometric standard. The calibrated spectrum was obtained from calspec in STSci222ftp://ftp.stsci.edu/cdbs/current_calspec/. The atmospheric dispersion corrector (ADC) at Cassegrain focus was not available in the observation, and wavelength-dependent positional shift of the target across the slit should occur. In our observation condition, the differential atmospheric dispersion was negligible for HaR-3,4, while 13% loss of flux may exist in the worst case for HaR-1,2. We therefore regard H/H of HaR-1 and 2 as possibly having suffered 13% systematic error.
2.2.2 Spatial distribution and apertures
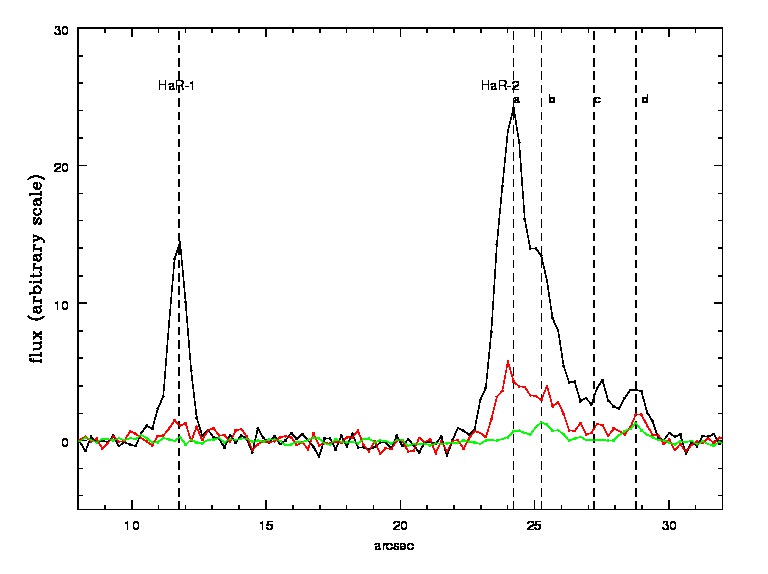
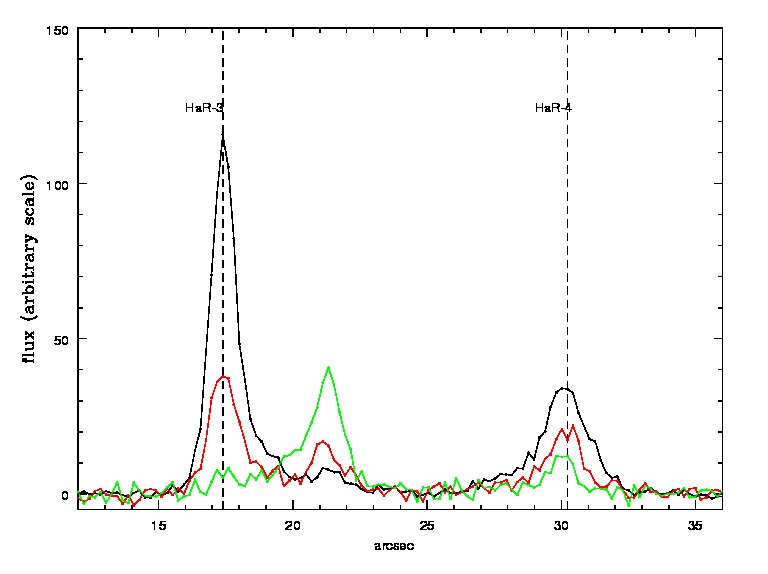
The spatial distribution of flux around H, [NII]6584, and continuum is shown in Figure 5. H and [NII] are not net emission line but include continuum flux. In HaR-1 and 4, H, [NII], and continuum profiles are similar. In HaR-3, the continuum shows a small gradient, which would be a contamination from the neighboring galaxy at the position x 21.
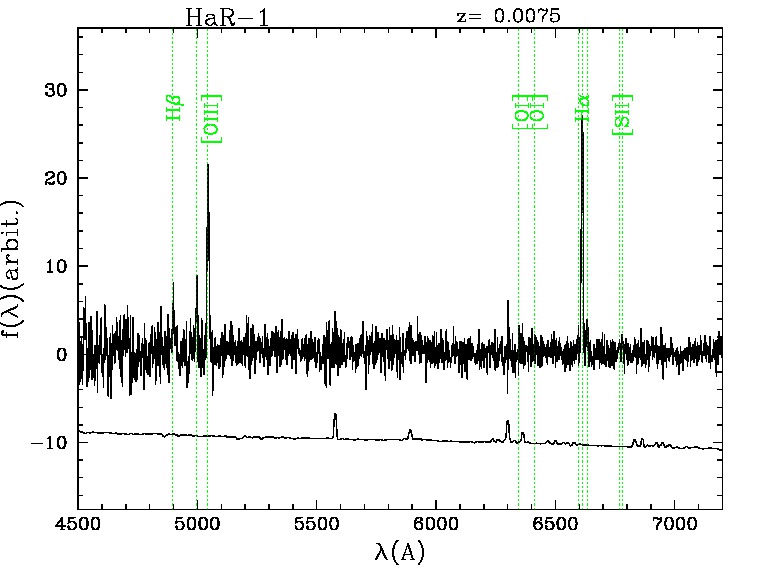
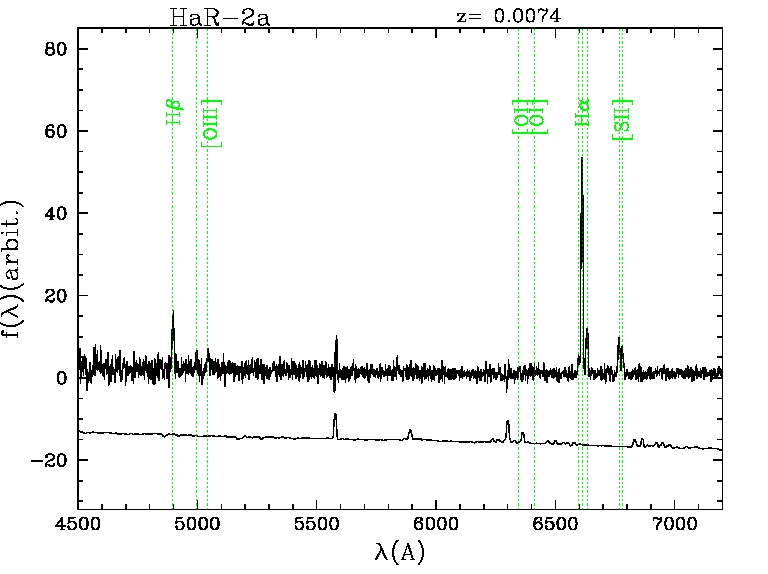
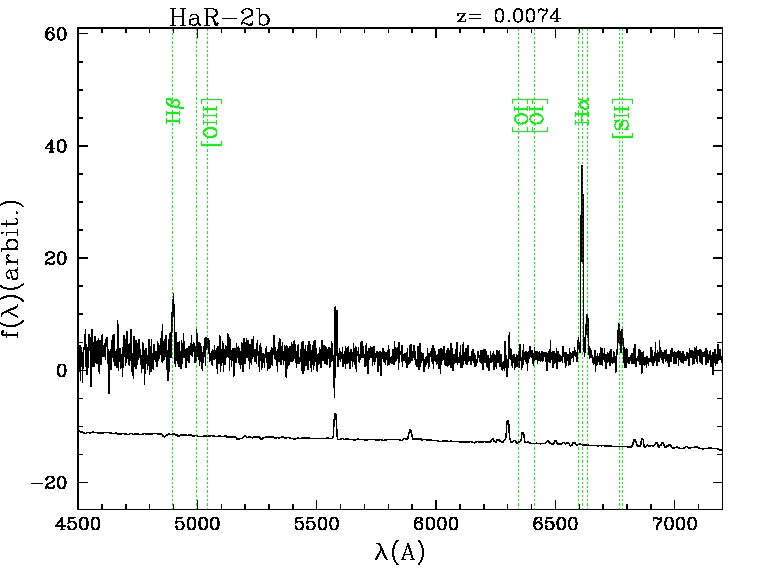
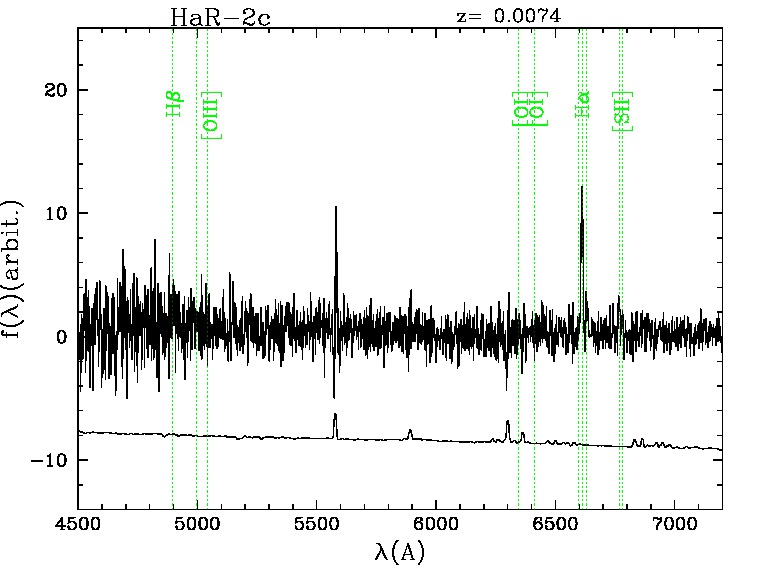
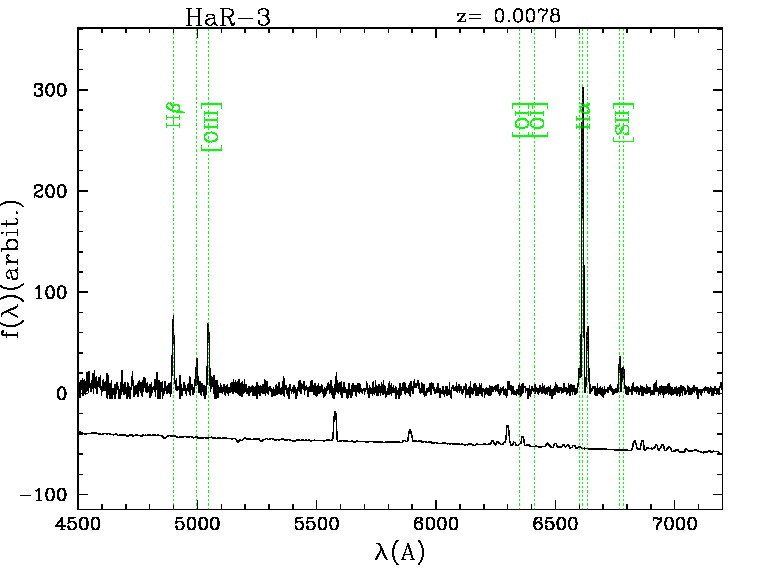
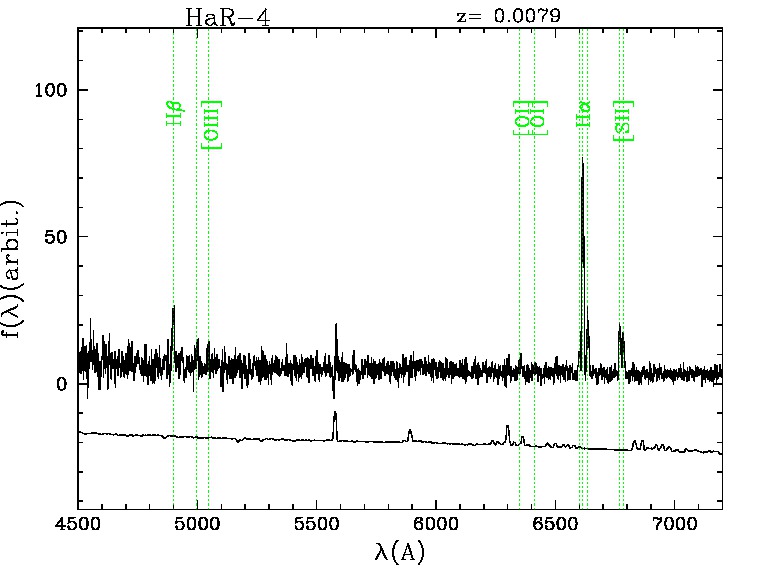
In HaR-2, the spatial profile was rather complicated. At x24, H, and [NII] has a peak, while the continuum does not. At x25, the continuum has a peak, and H and [NII] shows a bump. Around x27, H and [NII] shows a small peak, but the continuum was 0. Then a second peak of the continuum was seen at the position in the slit x29, where H and [NII] are not so strong as in the other part. We therefore divide the aperture of HaR-2 into four which correspond to the clumps in Figure 2 bottom. Then spectra were extracted for the H peaks with a Gaussian weight along the slit. The spectra are shown in Figure 6. In the Figure, the wavelength dependence of the instrumental and atmospheric throughput is corrected, except for the possible slit loss. The neighboring galaxy between HaR-3 and 4 was found to be a background star-forming galaxy at z=0.118.
2.2.3 Measurement of the line strengths
The strength of H, [NII]6584, [SII]6717,6731, [OIII]5007, and H are measured by Gaussian fitting. In , H, [NII], and [SII] are fitted by a multivariate least-square fitting. We assume that the background continuum is constant in the fitting region, the redshift is the same for the lines, and the FWHM of the lines is the same (dominated by instrumental profile). The strength of [NII]6548 was fixed to be 1/3 of [NII]6584. The estimated redshifts are shown in Table 4. In , H and [OIII]5007 are measured in the same way. [OIII]4959 was assumed to be 1/3 of [OIII]5007. At HaR-2c and HaR-2d, the lines are too weak and we could not fit well.
Since the seeing size was comparable to the slit width, and the slit width was narrower than the spatial extent of the HaRs, the flux value from the spectra has little physical meaning, but the flux ratios are meaningful. The ratios are shown in Table 5. The error of each parameter was estimated by a residual bootstrap method of 1000 realization, except for H/H. The error of H/H was estimated from the error of H flux and that of H flux by the residual bootstrapping, assuming that their errors were independent. For HaR-1 and HaR-2, 13% error due to possible differential atmospheric dispersion effect was also included.
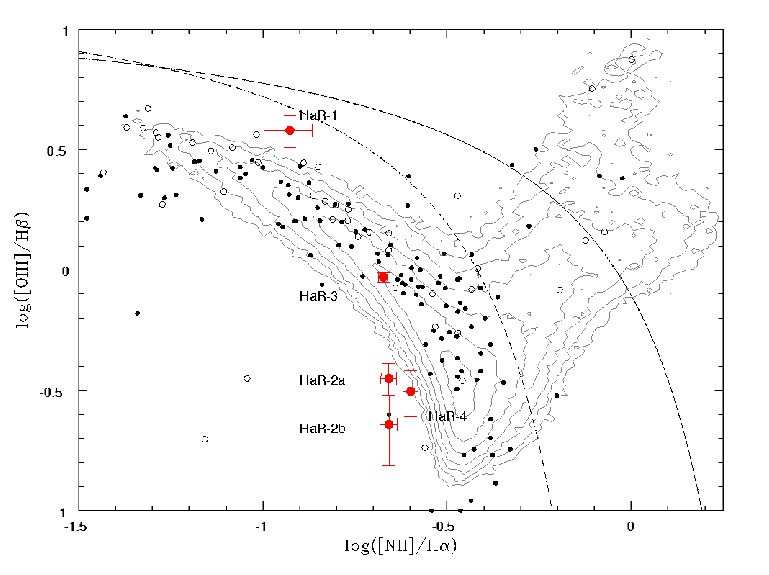
In Figure 7, diagnostic line ratio plots are shown. All the regions have a line ratio similar to an HII region. Moreover, [OI]6300 was not detected in any of the regions, possible contribution of shock as seen in H knots in Yoshida et al. (2004) are negligible in our targets. Note that [OI]6300 of the HaRs are not affected by the atmospheric [OI]6300 or [OI]6363, because of the redshift.
3 Results
3.1 Redshift and position
The HaRs have large (2000 km s-1) recession velocity. The recession velocity of NGC 4388 is also large; 2524 km s-1 (Lu et al., 1993), and that of the HI tail is 2000 – 2550 km s-1 (Oosterloo & van Gorkom, 2005). As the recession velocity of the Virgo cluster is 1079 km s-1 (Ebeling et al., 1998), the peculiar velocity of NGC 4388 and its tail is km s-1. In the 4836 arcmin region shown in Figure 1, the number of galaxies which have recession velocity larger than 1500 km s-1 in NASA/IPAC Extragalactic Database(NED) is seven. Two of them, AGC 226080 and VCC 956, have HI redshift only. As the beam of the HI observation is large enough (3.33.8 arcmin; Giovanelli et al., 2007) to include the HI tail of NGC 4388, the high velocity would be a measurement of the tail by an accidental overlap. The recession velocity of VCC896 is uncertain, since it is inconsistent among Conselice, Gallagher&Wyse (2001), Sloan Digital Sky Survey Data Release 7 (SDSS2 DR7; Abazajian et al., 2009)333http://cas.sdss.org/dr7/en/ and SDSS3 DR9 (Ahn et al., 2012)444http://skyserver.sdss3.org/dr9/. The rest four have optical spectroscopic redshift and consistent among literatures. We marked the four in Figure 1. The HaRs are very likely to be associated with the HI tail of NGC 4388, because of the large resession velocity and their position; HaR-1 and HaR-2 overlap the HI, and HaR-3 and HaR-4 lie near the contour edge (Figure 1), and their nearest galaxy with large recession velocity is NGC 4388.
3.2 Size and morphology
HaR-1 is a point source, and was only recognized in narrowband. It is marginally detected in NUV, and in optical broadbands which include strong emissions. Since the seeing size in the NA659 was about 0.75 arcsec, which corresponds to 60 pc, the size of HaR-1 would be smaller than 60 pc.
HaR-2 shows a blobby and elongated appearance. The size was 530 210 pc. HaR-2ab and HaR-2d were recognized separately in optical and infrared images, while they were merged in UV image due to the 6 arcsec resolution of Galaxy Evolution Explorer (GALEX),
HaR-3 had a slightly elongated shape toward HaR-4 and showed a sign of a tail with a blob. The tail was contaminated by the light from the neighboring background galaxy, and the length of the tail was uncertain. The size of HaR-3 including the tail was 300 180 pc.
HaR-4 showed a possible multi-core or elongated core surrounded by a blob and extended plume (Figure 3). The size including the plume was 380 360 pc. It is interesting that HaR-3 had an H tail toward NGC 4388. In HaR-2ab and HaR-4, tail/plume was on the far side of NGC 4388. The distance between HaR-3 and HaR-4 is 13 arcsec (1 kpc), and the difference of the recession velocity of HaR-3 and 4 is 30km s-1. Even if the mass of HaR-3 and 4 are M⊙, they would not be bound gravitationally.
3.3 Internal extinction and H luminosity
Internal extinction was estimated from the Balmer decrement H/H in our FOCAS spectra. We adopted the formula by Calzetti et al. (1994),
| (1) |
The estimated internal extinction is shown in Table 6.
In our observation, the seeing size was comparable to the slit width. We therefore did not try the absolute spectrophotometric calibration from the spectra only. Instead, the spectra were used to convert NA659 magnitude to the total flux of H. The extinction corrected H luminosity are given in Table 6.
3.4 Metallicity
Kewley&Dopita (2002) presented model curves to estimate oxygen abundance (log(O/H)+12) using several combinations of emission lines with various values of the ionization parameter (). We can use [NII]/[SII], [NII]/H, and [NII]/[OIII] to estimate the metallicity. [NII]/[OIII] was corrected for the internal extinction using H/H, and other two ratios were not corrected. was also estimated from the curves.
From the fitting, the metallicity of the regions was estimated as log(O/H)+128.6–8.7. It was comparable to the solar abundance (Grevesse et al., 2010). Yoshida et al. (2004) reported that the metallicity of H-emitting filaments near NGC 4388 was almost at the solar value. Their ionization parameters correspond to log(U)=-2.6, -3.5, -3.2 and -3.5, for HaR-1, 2a, 3, and 4, respectively, where is the ratio of the ionization photon density to the electron density. Since log(U) decreases with age of the HII region, relatively high value of HaR-1 implies that HaR-1 would be younger.
3.5 Electron density
From the Figure 5.8 of Osterbrock&Ferland (2006), O’Dell et al. (2013) derived the formula to estimate the electron density ()
| (2) |
which was applicable in 0.65[SII]6716/[SII]67311.3. In this study, the error of [SII]6717/[SII]6731 was large, and all except HaR-1 was consistent with cm-3. HaR-1 may have a higher electron density cm-3.
3.6 Mass and Age estimation
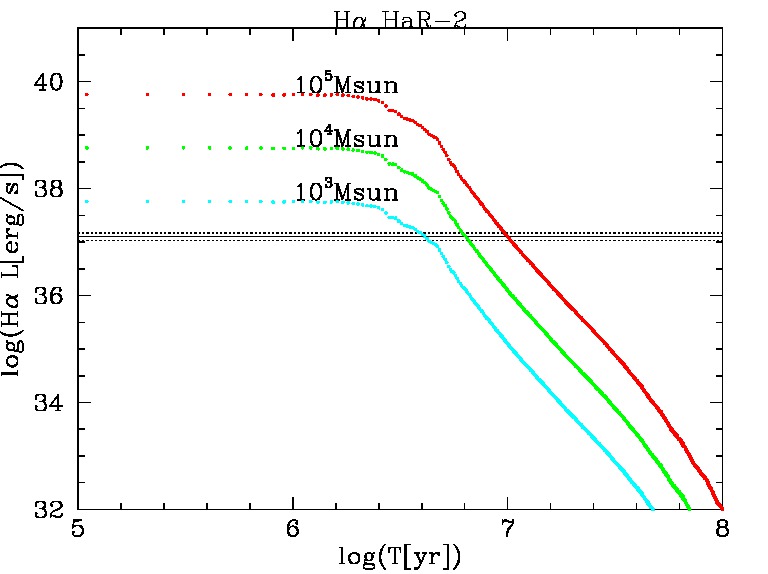
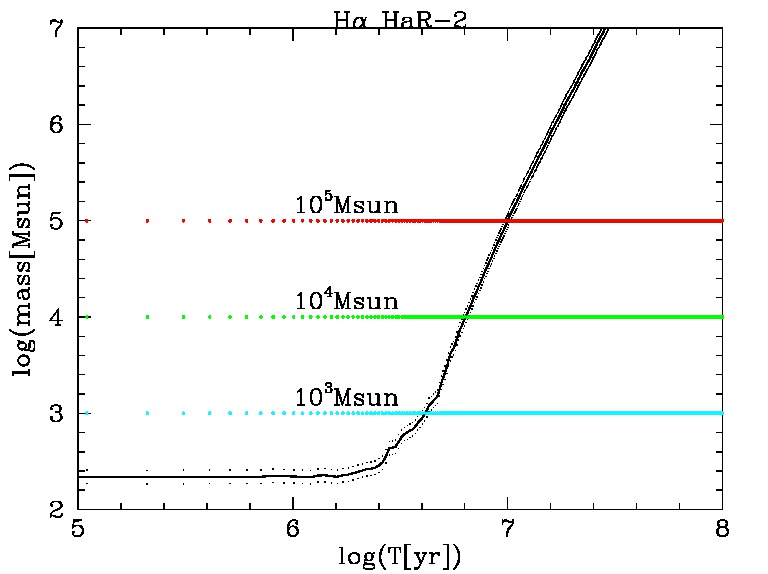
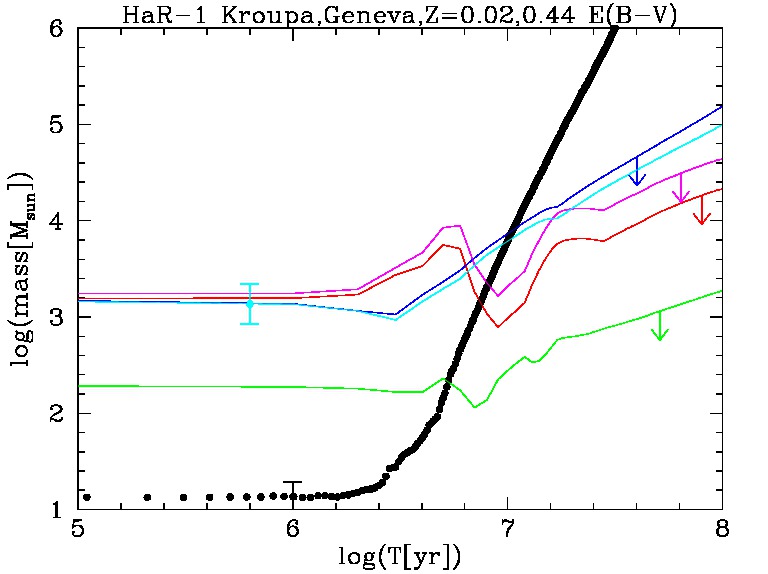
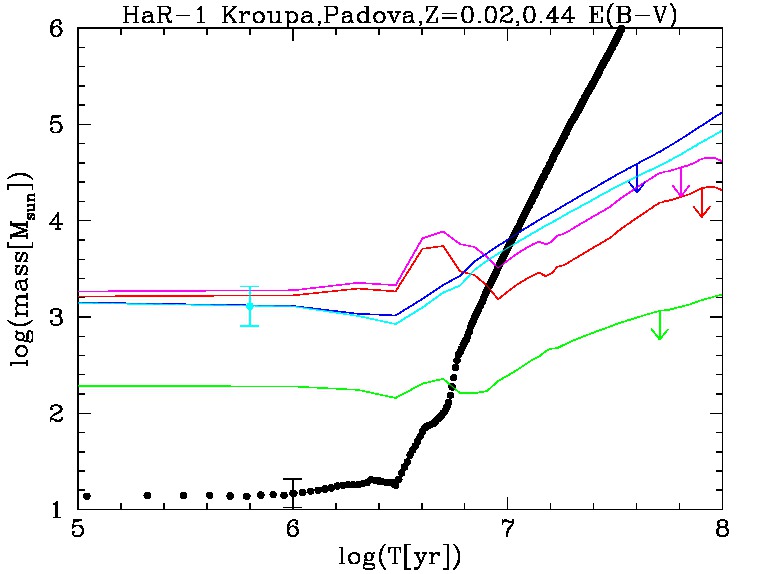
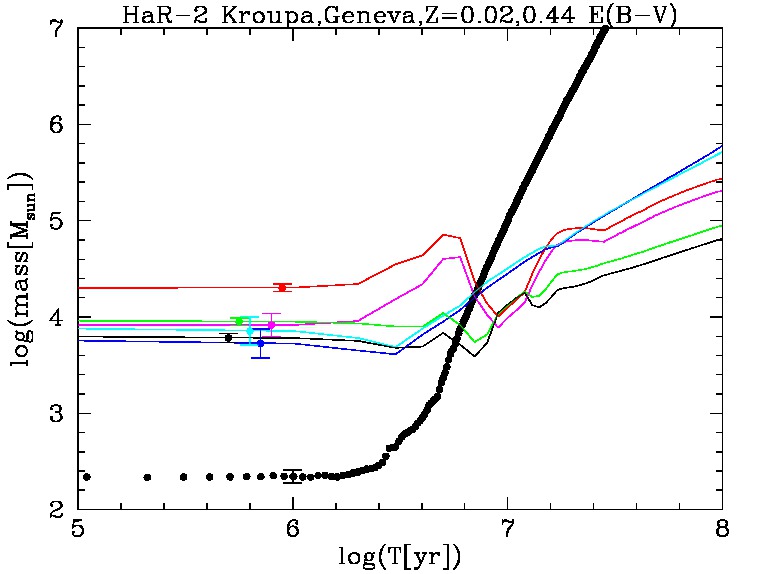
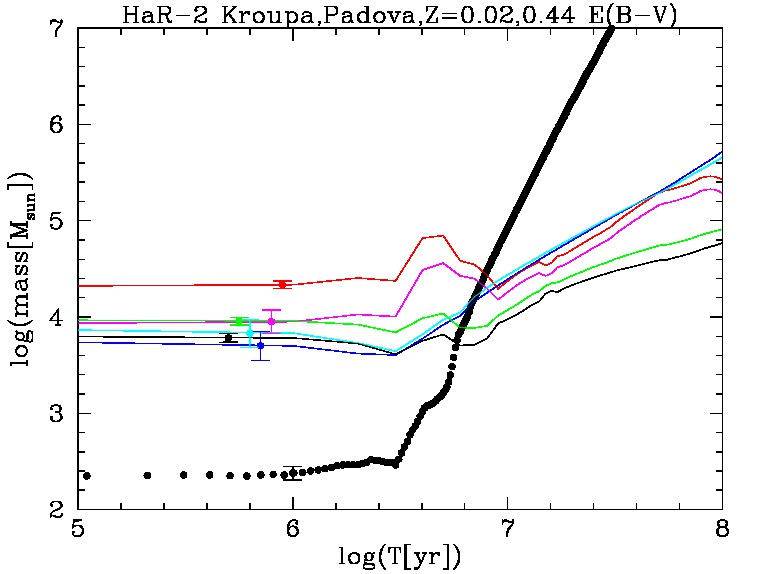
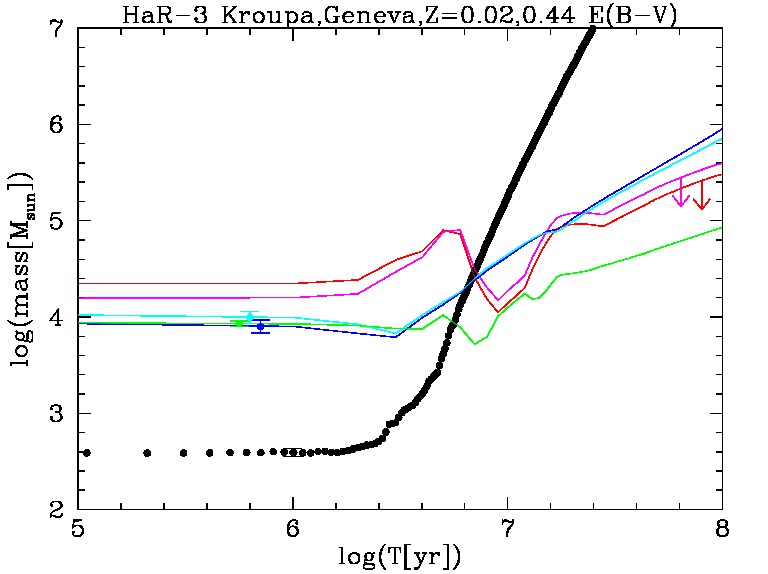
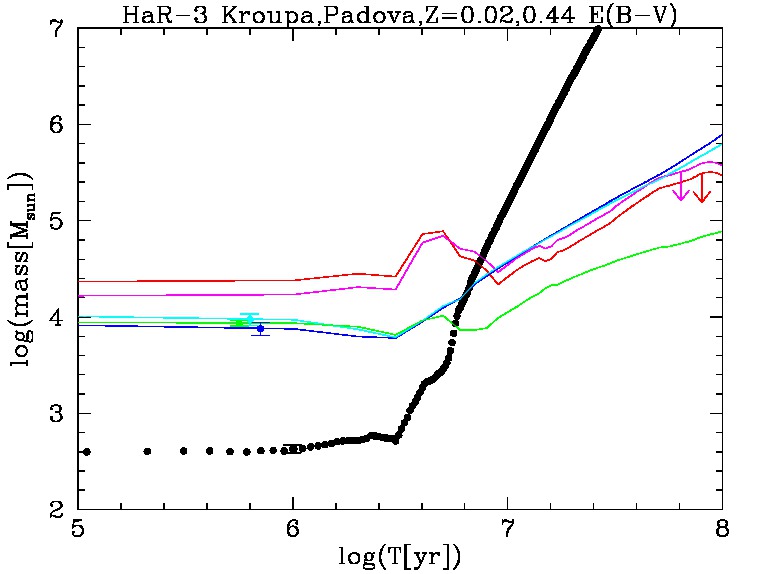
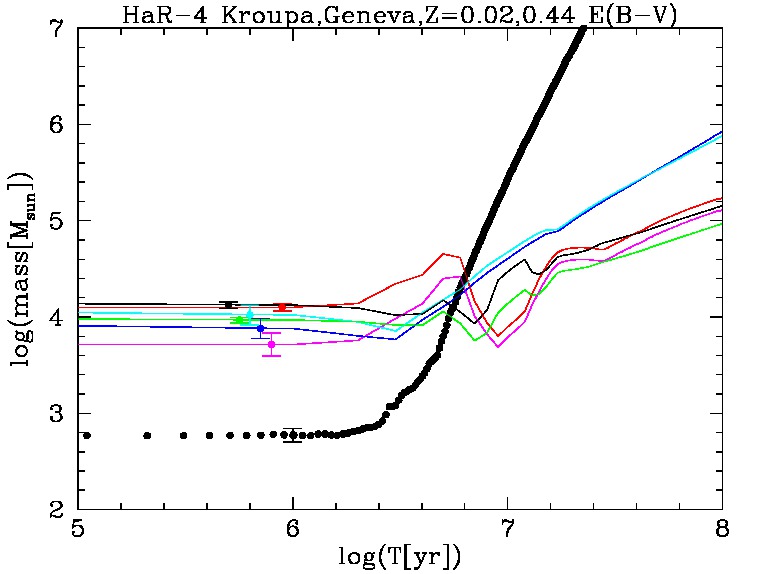
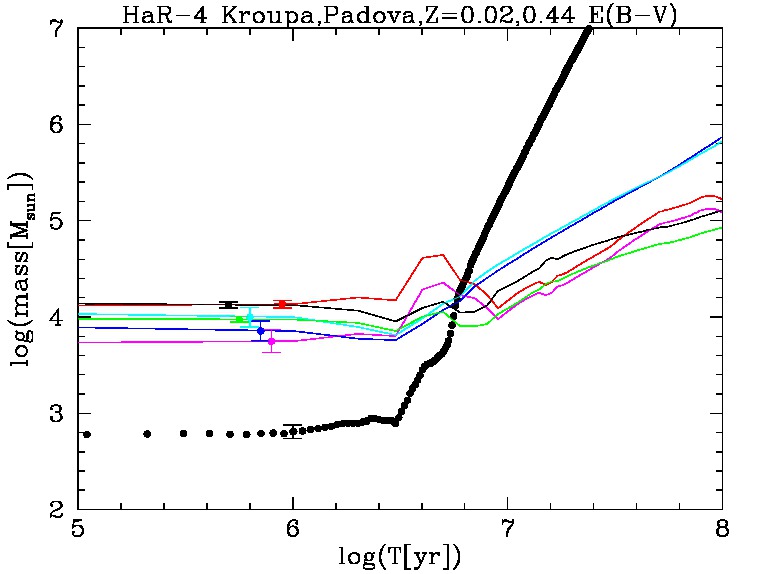
We calculated model magnitudes and H flux at different age and compared them with the observation. The detail of the model is given Appendix B. We plotted the model age versus the model mass to reproduce the observation in Figure 8. The abscissa is the logarithmic age from the burst. The ordinate is the required stellar mass of the HaR to reproduce the observed magnitude/luminosity at each age. Because the time evolution of the H luminosity, UV, optical and MIR magnitudes are different, the crossing point of the tracks will indicate the stellar mass and the age.
H, IR, and UV were comparable around log(T)=6.8 and log(mass)=4.3 in Geneva model for HaR-2, HaR-3, and HaR-4, while i has an offset by 0.4 dex, which corresponds to 1 magnitude and a factor of 2.5. Though the consistency in the Padova model was not as good as that of the Geneva model, the best-fit mass and age were comparable.
The disagreement of the estimated mass and age among the data might be explained partly by the difference in aperture sizes. As UV resolution was worse, it required the largest aperture (r=6 arcsec), and may include contaminants, which made the observed luminosity larger and shifted the lines in Figure 8 upward. However, IR had a smaller aperture (r=3 arcsec) than UV, and H is based on NA659 photometry, which was aperture photometry of 2.5 Kron radius (). The 2.5 was 20.3 arcsec in the data, and therefore it was the smallest aperture, because of the best seeing. Suprime-Cam i-band and Kitt Peak National Observatory (KPNO) mosaic ha-band were also measured in an aperture of 2.5 radius, which was 2–3 arcsec. Nevertheless, H, UV, and IR showed a good agreement, while i-band and KPNO ha-band showed an offset in HaR-2 and HaR-3. As the i-band magnitude of Suprime-Cam was comparable to SDSS photometry for HaR-4, which was based on Petrosian radius, and the KPNO photometry of ha-band showed a similar trend, the disagreement would not be caused by photometric error.
The disagreement also could come from model uncertainties and adopted assumptions, such as initial mass function (IMF), instantaneous star formation, and/or dust extinction model. A possible model is to divide the region into several sub-regions and to assume different extinctions. For example, if some part has a large extinction, UV is suppressed and optical and IR fluxes could be larger relative to UV and H. In fact, HaR-2 consisted of sub-clumps with various extinctions. Though we can consider various star-formation histories and models, it is beyond the scope of this study. We do not go further to tune the star-formation histories and the models.
In Figure 8, HaR-1 shows large disagreement of the mass and the age among the data. Since HaR-1 would have a smaller mass, which was expected from fainter i-band magnitude, it may have suffered a stochastic effect on IMF (e.g., Koda et al., 2012).
As shown in Table 4, HaR-1 and 2 are 66 kpc and HaR-3 and 4 are 35 kpc away from NGC 4388. Oosterloo & van Gorkom (2005) and Vollmer (2009) assumed that the age of the HI cloud is 200 Myr, and estimated the projected velocity of NGC 4388 to the cloud was 500 km s-1 If we adopt the value as the relative velocity of HaRs to NGC 4388, it should take 130 Myr (HaR-1 and 2) and 70 Myr (HaR-3 and 4) to reach the distance. Since the time-scales are longer than the stellar age estimated above, it suggests that the star formation in HaRs began after the gas left the host galaxy. This is consistent with the prediction by Yamagami&Fujita (2011).
4 Discussion
4.1 Comparison with previous studies
Table 7 summarizes the literature concerning a stripped tail in nearby clusters of galaxies. Since the environment and physical condition of the tails (the ambient gas temperature and density, the relative velocity, the density of the tail, etc) shows a variety. we cannot compare them directly. We can at least say that HaR-1 and 2 are the most distant star-forming regions in the table, and HaR-1 may be the least massive region. Also, we can say that M⊙ and yr star-forming regions in a stripped tail are not peculiar objects.
The age of the regions in Fumagalli et al. (2011) is substantially larger than the others probably because a different model of the star-formation history was adopted. The mass estimation is not affected by the different star-formation history. The detection of the star-forming regions was based on H and/or UV emissions, and therefore the sampling should be biased to the younger age.
4.2 Comparison with HI distribution and recession velocity
The detailed heliocentric velocity distributions of HI 555Provided by Dr. J. van Gorkom. The beam of the data was elongated from north to south: 77 arcsec in declination and 24.5 arcsec in right ascension. showed that the intensity of the HI at the HaR-1,2 field had a wide peak around the recession velocity 2240 km s-1 (intensity-weighted mean) with width 150 km s-1. HaR-1 and 2 are just on the peak. This means that the star-forming regions had only small peculiar velocity relative to the ambient HI cloud along the line of sight. Meanwhile, HI at HaR-3,4 field showed no significant peak. Since the star formation in stripped tail is thought to occur in the highest-density regions (Kapferer et al., 2009), it is puzzling that the HI flux at HaR-3,4 field was low.
As we reported in paper I, the tail of NGC 4388 is accompanied by a relatively cool X-ray gas, and the distribution of X-ray emission showed a marginal enhancement at the downstream of HaR-3,4. The HI gas around HaR-3 and 4 might already have evaporated, except for the densest region. Another possibility is that such dense clouds are less affected by ram pressure, and left behind the HI gas (Yamagami&Fujita, 2011).
4.3 Positional offset of H and stars, and dark cloud around HaR-1 and HaR-2
The 2D spectrum and the slit profile of HaR-2 (Figures 4,5) shows that the H-strong region (HaR-2a) appears left to the continuum regions (HaR-2b). They resemble the fireballs found in the ram-pressure stripped tail in RB199 in the Coma cluster (Yoshida et al., 2008, 2012).
If the gas cloud (HaR-2a, 2c) is now free from the ram pressure, the gas and stars would move similarly. On the other hand, because the ram pressure affects differently the stars and the gas, it would cause a differential movement between the gas and the stars. The positional shift between the gas and the stars implies that ram-pressure deceleration is still working here, 66 kpc away from the host galaxy. Another possible explanation for the offset is that the gas has been consumed from the leading edge of the cloud, and the star formation is propagated to the following regions.
In HaR-4, a plume also existed on the other side of the parent galaxy. In HaR-3, however, the tail appeared on the side of the parent galaxy. The direction was coincident to HaR-4. The projected distance between HaR-3 and HaR-4 was about 1.0 kpc and the difference of the recession velocity was 30 km s-1. If their mass is M☉, the velocity difference is so large that they cannot be gravitationally bound. If HaR-3 and HaR-4 had experienced an encounter in the past, it means that such a small-scale motion existed in the tail.
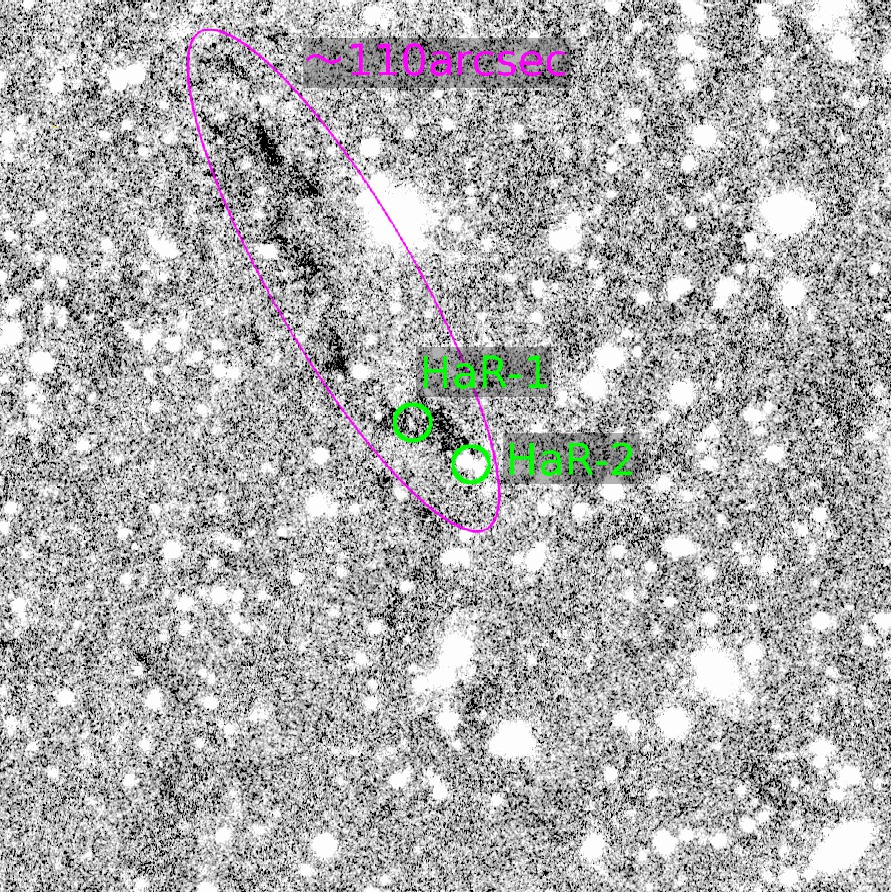
Illuminated by the stars of the M86 envelope, a dark filamentary cloud was recognized around HaR-1 and HaR-2. A high contrast image in V-band is shown as Figure 9. In optical bands of Figure 2, the cloud was also recognized. The dark cloud shows an elongated and twisting shape. The length was 110 arcsec (7 kpc) and the width was 7 arcsec (600 pc) around HaR-2.
It is uncertain whether the dark cloud is associated with the NGC 4388 tail, an accidental overlap of a dark cloud of M86, or even if it is another dark cloud. However, as such filaments of the dark cloud are only recognized along the HI tail of NGC 4388, it is likely that the dark cloud is associated with the NGC 4388 HI tail. These filaments of the dark cloud do not show any H emitting regions except that with HaR-1 and HaR-2. As there are only few star-forming regions along the tail, it is unlikely that the dusts were created in the tail, and the origin of the dusts should be NGC 4388. It implies that the dusts were affected by the ram-pressure. The ram-pressure stripping of dusts from disk of galaxies in the Virgo cluster was suggested by several authors; NGC 4402 by Crowl et al. (2005), NGC 4438 by Cortese et al. (2010b), and NGC 4330 by Abramson et al. (2011). Cortese et al. (2010a) studied HI-deficient galaxies in the Virgo cluster, and found that dust is stripped in the cluster environment as well as gas. Yoshida et al. (2012) demonstrated the coincidence of the ram-pressure stripping of HI, H and the dust in IC 4040. The elongated and twisting shape of the dark cloud downstream of HaR-1 and HaR-2 may also be explained as a result of the ram pressure which is still effective around the regions.
In paper I, we showed evidence that M86 is more distant than the NGC 4388 tail. The total extinction of the cloud was estimated by assuming that the background M86 light was smooth. The estimated extinction at a region between HaR-1 and HaR-2 was 15% and 10% in V-band and in R-band, respectively. It corresponds to . As the estimated from the Balmer decrement in HaR-1 is much larger as = 0.59, it is suggested that the dust in the dark filament would be locally dense around the star-forming regions.
4.4 Star formation in the clouds
Based on the argument by Yamagami&Fujita (2011), we discuss the star formation in the molecular clouds that later shine as the observed H emitting regions. Elmegreen& Efremov (1997) derived the relation between the mass of a cloud and the star-formation efficiency when the cloud is under pressure . We estimate in paper I that the ram-pressure on NGC 4388 and the clouds should be . In section 3.6, we found that the total mass of stars in each H emitting region is –. Assuming that , the mass of the molecular cloud before the stars were born is because (lower part of Figure 4 in Elmegreen& Efremov 1997). For this mass and pressure, the time-scale of star formation in the cloud is yr (upper part of Figure 4 in Elmegreen& Efremov 1997; they referred to the time-scale as ’disruption time’), which is consistent with the age of the stars in the regions ( yr).
Yamagami&Fujita (2011) also discussed the disruption of the clouds by Kelvin-Helmholtz (KH) instability via interaction with the ambient ICM. The relation among , and the cloud radius before star formation starts is given by
| (3) |
(Elmegreen, 1989). For and we estimated, the cloud radius was pc. The time-scale of the development of KH instability is
| (4) |
where is the density inside the cloud, and is the relative velocity between the cloud and the ICM (Murray et al., 1993). We estimate in paper I that , and thus we obtain yr. Since , the cloud could marginally produce the stars before KH instability develops. This may indicate that no magnetic fields are required to protect the cloud from the development of KH instability (Yamagami&Fujita, 2011).
4.5 Nature of HaR-1
From the H luminosity, the H ionizing photon emission rate of HaR-1 was 1047.41 s-1. Assuming case-B recombination, the logarithm of the total hydrogen ionizing photon emission rate was . According to Sternberg et al (2003), a single B0V dwarf is enough to produce the photon rate, and other stars such as B giants and O dwarfs would make too much H.
However, a single B0V star is insufficient to reproduce the observed NUV magnitude. The absolute V magnitude of B0V star is -4 (e.g.; Wegner, 2006). The NUV-V color of B0V was calculated with empirical spectral energy distributions (SEDs) by Pickles (1998) as -1.0 mag. The absolute NUV magnitude is therefore . Meanwhile, the absolute magnitudes of HaR-1 converted from observed NUV magnitudes and the internal extinction correction was -8.80.7 mag. The observed UV magnitudes were mag brighter.
The UV-optical color was also inconsistent with the following models. We calculated the color of various SEDs, and found that the bluest stars are O9V–B0V (NUV-i-1.7). The observed lower limit of NUV-i color of HaR-1 was , and if we correct the internal extinction of , the color is . The model SEDs, internal extinction estimated from the Balmer decrement, the extinction law, and the factor of 0.44 were therefore inconsistent with the observed color.
5 Summary
In the HI tail of NGC 4388 in the Virgo cluster, we identified four star-forming systems at a projected distance of 35 kpc and 66 kpc away from the parent galaxy.
Main results are as follows:
-
1.
The line ratios show typical HII regions of solar metallicity, with recession velocity comparable to that of HI tail, which supports the idea that they are associated with the tail.
-
2.
The H luminosity and multiband photometry are fit with a burst model (STARBURST99), and we obtained reasonable solutions within 0.3 dex. From the fitting, the mass is 104-4.5 M⊙ and the age is years, except for the faintest one (HaR-1). The faintest one would have mass smaller than M⊙, and was not fitted well, possibly because of the stochastic effect.
-
3.
Their young age and large projected distance means that they were formed after they were removed from the parent galaxy. This supports the theoretical prediction by Yamagami&Fujita (2011). The estimated age and mass, and the ram-pressure estimated in paper I suggested that a magnetic field to protect the cloud from Kelvin-Helmholz instability (Yamagami&Fujita, 2011) may not be necessary for the clouds.
-
4.
One of the regions at 66 kpc away from NGC 4388 (HaR-2) shows an offset of H emission from stars (fireball feature). This implies that ram-pressure is still effective here.
-
5.
Two of the regions (HaR-3,4) exist out of HI distribution. Evaporation of the HI and/or the different deceleration by ram-pressure between the HI gas and the condensed region may explain the result.
-
6.
Two of the regions (HaR-1,2) lay at a leading edge of a filamentary dark cloud. The cloud would have been stripped from NGC 4388 by the ram-pressure. The extinction of the dark cloud is smaller than the internal extinction of the regions. The dust in the dark cloud would be locally dense around the star-forming regions.
As the spectroscopic observation of this study was not a complete sampling of the H emitting regions along the tail, we did not investigate the global features in the tail such as total star-formation rate. A future complete survey of the candidates of the star-forming region will quantitatively set the constraints on the star-formation models in the tail.
References
- Abazajian et al. (2009) Abazajian, K. N. et al. 2009, ApJS, 182, 543
- Abramson et al. (2011) Abramson, A. 2011, AJ, 141, 164
- Ahn et al. (2012) Ahn, et al. 2012, ApJS, 203, 21
- Arnabildi et al. (2003) Arnaboldi, M. et al. 2003, AJ, 125, 514
- Arrigoni Battaia et al. (2012) Arrigoni Battaia, F. et al. 2012, A&A, 543, A112
- Bertin & Arnouts (1996) Bertin, E., Arnouts, S. 1996, A&AS, 317, 393
- Blanton & Roweis (2007) Blanton, M.R., Roweis, S. 2007, AJ, 133, 734
- Boissier et al. (2012) Boissier, S. et al. 2012, A&A, 545A, 142
- Boselli & Gavazzi (2006) Boselli, A., Gavazzi, G. 2006, PASP, 118, 517
- Calzetti et al. (2000) Calzetti, D. et al. 2000, ApJ, 533, 682
- Calzetti et al. (1994) Calzetti, D., Kinney, A.L., Storchi-Bergmann, T. 1994, ApJ, 429, 582
- Chung et al. (2007) Chung, A., van Gorkom, J.H., Kenney, J.D.P., Vollmer, B. 2007, ApJ, 659, L115
- Ciddor (1996) Ciddor, P.E. 1996, Applied Optics, 35, 1566
- Conselice, Gallagher&Wyse (2001) Conselice, C.J., Gallagher, J.S. III, Wyse, R.F.G. 2001, ApJ, 559, 791
- Cortese et al. (2003) Cortese, L. et al. 2003, A&A, 401, 471
- Cortese et al. (2004) Cortese, L., Gavazzi, G., Boselli, A., Iglesias-Paramo, J. 2004, A&A, 416, 119
- Cortese et al. (2007) Cortese, L. et al. 2007, MNRAS, 376, 157
- Cortese et al. (2010a) Cortese, L. et al. 2010a, A&A, 518, L49
- Cortese et al. (2010b) Cortese, L. et al. 2010b, A&A, 518, L63
- Crowl et al. (2005) Crowl, H.H., Kenney, J.D.P., van Gorkom, J.H., Vollmer, B. AJ, 130, 65
- Ebeling et al. (1998) Ebeling, H. et al. 1998, MNRAS, 301, 881
- Elmegreen (1989) Elmegreen, B. G. 1989, ApJ, 338, 178
- Elmegreen& Efremov (1997) Elmegreen, B. G., & Efremov, Y. N. 1997, ApJ, 480, 235
- Fossati et al. (2012) Fossati, M., Gavazzi, G., Boselli, A., Fumagalli, M. 2012, A&A, 544, A128
- Fujita & Nagashima (1999) Fujita, Y., Nagashima, M. 1999, ApJ, 516, 619
- Fujita et al. (2006) Fujita, Y., Sarazin, C.L., Sivakoff, G.R. 2006, PASJ, 58, 131
- Fumagalli et al. (2011) Fumagalli, M., Gavazzi, G., Scaramella, S., Franzetti, P. 2011, A&A, 528, A46
- Gavazzi et al. (2000) Gavazzi, G., et al. 2000, A&A, 361, 1
- Gavazzi et al. (2001) Gavazzi, G., et al. 2001, ApJ, 563, L23
- Gerhard et al. (2002) Gerhard, O., Arnaboldi, M., Freeman, K.C., Okamura, S. 2002, ApJ, 580, L121
- Grevesse et al. (2010) Grevesse, N., Asplund, M., Sauval, A.J., Scott, P. 2010, Ap&SS, 328, 179
- Giovanelli et al. (2007) Giovanelli, R. et al. 2007, AJ, 133, 2569
- Gu et al. (2013) Gu, L. et al. 2013, submitted to ApJL (paper I; arXiv:1308.5760)
- Gunn & Gott (1972) Gunn, J.E., Gott, J.R. III ApJ, 176, 1
- Hayashino et al. (2003) Hayashino, T. et al. 2003, PNAOJ, 7, 33
- Hester et al. (2010) Hester, J.A. 2010, ApJ, 716, L14
- Iwasawa et al. (2003) Iwasawa, K., Wilson, A.S, Fabian, A.C., Young, A.J. 2003, MNRAS, 345, 369
- Jansen et al. (2000) Jansen, R.A., Fabricant, D., Franx, M., Caldwell, N. 2000, ApJS, 126, 331
- Kauffmann et al. (2003) Kauffmann, G. et al. 2003, MNRAS, 346, 1055
- Kashikawa et al. (2002) Kashikawa, N. et al. 2002, PASJ, 54, 819
- Kapferer et al. (2009) Kapferer, W., Sluka, C., Schindler, S., Ferrari, C., Ziegler, B. 2009, A&A, 499, 87
- Kenney et al. (2008) Kenney, J.D.P., Tal, T., Crowl, H.H., Feldmeier, J., Jacoby, G.H. 2008, ApJ, 687, L69
- Kepferer et al. (2008) Kapferer, W. et al. 2008, A&A, 499, 87
- Kewley et al. (2001) Kewley, L.J,, Dopita, M.A., Sutherland, R.S., Heisler, C.A., Trevena, J. 2001, ApJ, 556, 121
- Kewley&Dopita (2002) Kewley, L.J., Dopita, M.A. 2002, ApJS, 142, 35
- Koda et al. (2012) Koda, J., et al. 2012, ApJ, 749, 20
- Kong et al. (2002) Kong, X., Cheng, F.Z., Weiss, A., Charlot, S. 2002, A&A, 396, 503
- Kronberger et al. (2008) Kronberger, T. et al. 2008, A&A, 481, 337
- Kroupa (2001) Kroupa, P. 2001, MNRAS, 322, 231
- Kuntz et al. (2008) Kuntz, K.D., Harrus, I., McGlynn, T.A., Mushotzky, R.F., Snowden, S.L. 2008, PASP, 120, 740
- Lasker et al. (2008) Lasker B. et al. 2008, AJ, 136, 735
- Leitherer et al. (1999) Leitherer, C., et al. 1999, ApJS, 123, 3
- Leitherer et al. (2010) Leitherer, C., et al. 2010, ApJS, 189, 309
- Lu et al. (1993) Lu, N.Y. et al. 1993, ApJS, 88, 383
- Machacek et al. (2005) Machacek, M. et al. 2005, ApJ, 630, 280
- Machacek et al. (2006) Machacek, M. et al. 2006, ApJ, 644, 145
- Mink (2002) Mink, D.J. 2002, in ASP Conf. Proc. 281. ADASS XI, eds. D.A. Bohlender, D. Durand, & T.H. Handley (San Francisco: ASP), 169
- Miyazaki et al. (2002) Miyazaki, S., et al. 2002, PASJ, 54, 833
- Morrissey et al. (2005) Morrissey, P. et al. 2005, ApJ, 619, L7
- Morrissey et al. (2007) Morrissey, P. et al. 2007, ApJS, 173, 682
- Murray et al. (1993) Murray, S. D., White, S. D. M., Blondin, J. M., Lin, D. N. C. 1993, ApJ, 407, 588
- O’Dell et al. (2013) O’Dell, C.R., Ferland, G.J., Henney, W.J. Peimbert, M. 2013, AJ, 145, 93
- Osterbrock&Ferland (2006) Osterbrock, D.E., Ferland, G.J. 2006, “Astrophysics of gaseous nebulae and active galactic nuclei, 2nd. ed.” (Sausalito, CA: University Science Books)
- Ohyama & Hota (2013) Ohyama, Y., Hota, A. 2013, ApJ, 767, L29
- Okamura et al. (2002) Okamura, S. et al. 2002, PASJ, 54, 883
- Oke & Gunn (1983) Oke, J.B., Gunn, J.R. 1983, ApJ, 266, 713
- Oosterloo & van Gorkom (2005) Oosterloo, T., van Gorkom, J. 2005, A&A, 437, L19
- Owen et al. (2006) Owen, F.N. et al. 2006, AJ, 131, 1974
- Pickles (1998) Pickles, A. 1998, PASP, 110, 863
- Roediger et al. (2006) Roediger, E., Brüggen, M., Hoeft, M. 2006, MNRAS, 371, 609
- Roediger&Brüggen (2007) Roediger, E., Brüggen,, M. 2007, MNRAS, 380, 1399
- Roediger&Brüggen (2008) Roediger, E., Brüggen, M. 2008, MNRAS, 388, 486
- Roediger (2009) Roediger, E. 2009, Astronomische Nachrichten, 330, 888
- Salpeter (1955) Salpeter, E.E. 1955, ApJ, 121, 161
- Schlegel et al. (1998) Schlegel, D., Finkbeiner, D.P., and Davis, M. 1998, ApJ, 500, 525
- Schlalfy&Finkbeiner (2011) Schlafly, E.F., Finkbeiner, D.P. 2011, ApJ, 737, 103
- Sivanandam et al. (2010) Sivanandam, S, Rieke, M.J., Rieke, G.H. 2010, ApJ, 711, 147
- Smith et al. (2010) Smith, R.J. et al. 2010, MNRAS, 408, 1471
- Sternberg et al (2003) Sternberg, A., Hoffmann, T.L., Pauldrach, A.W.A 2003, ApJ, 599, 1333
- Sun&Vikhlinin (2005) Sun, M., Vikhlinin, A. 2005, ApJ, 621, 718
- Sun et al. (2006) Sun, M., Jones, C., Forman, W., Nulsen, P.E.J., Donahue, M., Voit, G.M. 2006, ApJ, 637, L81
- Sun et al. (2007) Sun, M., Donahue, M., Voit, G.M. 2007 ApJ, 671, 190
- Sun et al. (2010) Sun, M. et al. 2010, ApJ, 708, 946
- Tonnesen&Bryan (2012) Tonnesen, S., Bryan, G.L. 2012, MNRAS, 422, 1609
- van Dokkum (2001) van Dokkum, P.G. 2001, PASP, 113, 1420
- Vazquez&Leitherer (2005) Vazquez, V.A., Leitherer, C.2005, ApJ, 621, 695
- Vollmer&Huchtmeier (2007) Vollmer, B., Huchtmeier, W. 2007, A&A, 462, 93
- Vollmer et al. (2008) Vollmer, B., Braine, J., Pappalardo, C., Hily-Blant, P. 2008, A&A, 491, 455
- Vollmer (2009) Vollmer, B. 2009, A&A, 502, 427
- Vollmer et al. (2012) Vollmer, B. et al. 2012, A&A, 537, A143
- Wang et al. (2004) Wang, Q.D., Owen, F., Ledlow, M. 2004, ApJ, 611, 821
- Weżgowiec et al. (2011) Weżgowiec, M. et al. 2011, A&A, 531, A44
- Wegner (2006) Wegner, W. 2006, MNRAS, 371, 185
- Wyder et al. (2007) Wyder, T.K. et al. ApJS, 173, 293
- Yagi et al. (2007) Yagi, M., et al. 2007, ApJ, 660, 1209
- Yagi et al. (2010) Yagi, M., et al. 2010, AJ, 140, 1814
- Yagi (2012) Yagi, M. 2012, PASP, 124, 1347
- Yagi et al. (2013) Yagi, M., et al. 2013, PASJ, 65, 22
- Yamagami&Fujita (2011) Yamagami, T., Fujita, Y. 2011, PASJ, 63, 1165
- Yoshida et al. (2002) Yoshida, M., et al. 2002, ApJ, 567, 118
- Yoshida et al. (2004) Yoshida, M., et al. 2004, AJ, 127, 90
- Yoshida et al. (2008) Yoshida, M., et al. 2008, ApJ, 688, 918
- Yoshida et al. (2012) Yoshida, M., et al. 2012, ApJ, 479, 43
| name | RA(J2000) | Dec(J2000) |
|---|---|---|
| HaR-1 | 12:26:14.63 | +12:51:46.4 |
| HaR-2a | 12:26:13.94 | +12:51:39.2 |
| HaR-2b | 12:26:13.87 | +12:51:38.6 |
| HaR-2c | 12:26:13.77 | +12:51:37.9 |
| HaR-2d | 12:26:13.68 | +12:51:36.8 |
| HaR-3 | 12:26:13.80 | +12:43:07.6 |
| HaR-4 | 12:26:13.09 | +12:43:00.4 |
| name | FUV | NUV | V | R | i | 3.6m | 4.5m |
|---|---|---|---|---|---|---|---|
| HaR-1 | 24.4aaNo object shape, but has a positive flux in an aperture | 24.7 0.2 | 26.43bb1 sigma limiting magnitude | 25.730.09 | 26.3bb1 sigma limiting magnitude | 24.3bb1 sigma limiting magnitude | 24.1bb1 sigma limiting magnitude |
| HaR-2ab | …ccNot resolved | …ccNot resolved | 22.760.04 | 22.590.04 | 22.720.04 | 22.10.1 | 23.00.3 |
| HaR-2d | …ccNot resolved | …ccNot resolved | 22.860.06 | 22.680.04 | 22.520.04 | 22.20.2 | 23.30.4 |
| HaR-2 | 21.88 0.09 | 21.85 0.04 | 22.060.07 | 21.880.04 | 21.860.05 | 21.5 | 22.4 |
| HaR-3 | 21.80 0.09 | 21.86 0.04 | 22.310.05dd arcsec aperture photometry | 21.910.04dd arcsec aperture photometry | 22.000.06dd arcsec aperture photometry | 21.4eetwice of semicircular aperture flux | 21.7eetwice of semicircular aperture flux |
| HaR-4 | 21.24 0.07 | 21.18 0.03 | 21.530.04 | 21.080.04 | 21.760.04 | 22.00.1 | 22.90.3 |
| name | NA503 | NA659 | ha | ha4 |
|---|---|---|---|---|
| HaR-1 | 24.140.05 | 23.510.05 | …aaNon-detection | 23.220.06 |
| HaR-2a | 23.740.05 | …bbNot resolved | 23.860.14 | …bbNot resolved |
| HaR-2b | 23.480.06 | …bbNot resolved | 23.250.10 | …bbNot resolved |
| HaR-2ab | … | 21.060.04 | 22.760.08 | 21.090.02 |
| HaR-2c | 24.340.10 | …aaNon-detection | …aaNon-detection | …aaNon-detection |
| HaR-2d | 23.830.07 | 22.450.04 | 23.520.10 | 21.890.05 |
| HaR-2 | 22.010.05 | 20.800.04 | 22.320.07 | 20.670.02 |
| HaR-3 | 22.200.04 | 20.190.04 | …ccHeavily blended with background galaxy | 20.190.01 |
| HaR-4 | 21.720.04 | 19.870.04 | 21.390.04 | 19.800.01 |
| name | z | v [km s-1] | d[kpc] |
|---|---|---|---|
| HaR-1 | 0.00749 | 2.25 | 67.1 |
| HaR-2a | 0.00737 | 2.21 | 66.2 |
| HaR-2b | 0.00737 | 2.21 | 66.1 |
| HaR-2c | 0.00736 | 2.21 | 66.0 |
| HaR-2d | 0.00731 | 2.19 | 65.9 |
| HaR-3 | 0.00780 | 2.34 | 35.9 |
| HaR-4 | 0.00789 | 2.37 | 34.9 |
| name | [NII]6584/H | [SII]6717,6731/H | [SII]6717/[SII]6731 | [OIII]5007/H | H/H |
|---|---|---|---|---|---|
| HaR-1 | 0.120.02 | 0.090.02 | 0.880.49 | 3.790.57 | 5.40.8aaincluding 13% error due to possible differential atmospheric dispersion effect |
| HaR-2a | 0.220.01 | 0.270.02 | 1.450.17 | 0.350.05 | 4.00.3aaincluding 13% error due to possible differential atmospheric dispersion effect |
| HaR-2b | 0.220.01 | 0.280.02 | 1.340.17 | 0.230.07 | 3.70.4aaincluding 13% error due to possible differential atmospheric dispersion effect |
| HaR-2c | 0.220.04 | 0.350.05 | 2.390.92 | 0.070.25 | 6.13.0aaincluding 13% error due to possible differential atmospheric dispersion effect |
| HaR-2d | 0.170.06 | 0.370.08 | 1.560.67 | …bb[OIII] and H non-detection | 4.4a,ca,cfootnotemark: |
| HaR-3 | 0.220.01 | 0.190.01 | 1.440.14 | 0.930.04 | 4.40.2 |
| HaR-4 | 0.250.01 | 0.400.02 | 1.290.11 | 0.310.07 | 3.70.3 |
| name | m(NA659) | E(B-V) | log(f(H) [ergs s-1 cm-2]) | log(L(H) [ergs s-1]) |
|---|---|---|---|---|
| HaR-1 | 23.510.05 | 0.59 | -16.63 | 35.89 |
| HaR-2a | 21.060.04aaHaR-2a magnitude and flux includes HaR-2b and part of 2c region. | 0.310.07 | -15.450.07 | 37.070.07 |
| HaR-2b | … | 0.23 | … | … |
| HaR-2c | … | 0.3 | … | … |
| HaR-2d | 22.450.04bbHaR-2d magnitude and flux includes part of 2c region. | 0.4 | -16.53 | 35.99 |
| HaR-2 | … | … | … | 37.10 |
| HaR-3 | 20.190.04 | 0.400.04 | -15.17 | 37.35 |
| HaR-4 | 19.870.04 | 0.23 | -14.99 | 37.53 |
| cluster | galaxy | proj. dist.[kpc] | log(mass[M⊙]) | log(age[yr]) | reference |
| Abell 3627 | 137-001 | 0–40 | … | … | Sun et al. (2010) |
| Coma | RB199 | 23–35 | 5.8–7.1 | 8 | Yoshida et al. (2008) |
| IC 4040 | 1.1–48 | … | 8 | Yoshida et al. (2012) | |
| NGC 4848 | 22–35 | … | … | Fossati et al. (2012) | |
| Virgo | IC 3418 | 10–17 | 4.5–5.6 | 8.2–9.1 | Fumagalli et al. (2011) |
| 14 | 4 | 6.8(/7.2/7.3) | Ohyama & Hota (2013) | ||
| NGC 4330 | 9 | 3.3–6.3 | –8.5 | Abramson et al. (2011) | |
| VCC 1249 | 5–12 | 3.8–4.3 | 6.6–7.3 | Arrigoni Battaia et al. (2012) | |
| NGC 4388 | 66 | this study (HaR-1) | |||
| 35,66 | 4–4.5 | 6.7–6.9 | this study (HaR-2,3,4) |
Appendix A Detail of Photometric Data
A.1 Suprime-Cam
The Suprime-Cam data used in the study are summarized in Table 8. The data are retrieved from SMOKA999http://smoka.nao.ac.jp/.
The data were reduced the same way as in Yoshida et al. (2002). As the i-band data were obtained with FDCCDs, crosstalk corrections were applied (Yagi, 2012). The World Coordinate System was calibrated using wcstools 3.8.3 (Mink, 2002) and Guide Star Catalog 2.3 (Lasker et al., 2008). Photometric zero points were calibrated using the method given in Yagi et al. (2013). We adopted the stars in Sloan Digital Sky Survey III Data Release 9 as standard objects, and converted the SDSS magnitudes to the Suprime-Cam system. The detail of the construction of the magnitude conversion was described in Yagi et al. (2013). The color conversion coefficients from SDSS to Suprime-Cam magnitudes are given in Table 9. Stars of magnitude in SDSS3 DR9 were used for our calibration. The K-correct (Blanton & Roweis, 2007) v4 offset for SDSS101010http://howdy.physics.nyu.edu/index.php/Kcorrect is applied; =0.012, 0.010 and 0.028 for , and , respectively.
In Figures 2 and 3, net-H images (NB659-R) are obtained by subtracting the scaled R-band image from the NA659-band image. As the seeing size was worse in R-band, the NA659 image was convolved with a Gaussian (FWHM=0.95 arcsec) to match the size of the point spread function (PSF).
We used SExtractor (Bertin & Arnouts, 1996) for the photometry of the Suprime-Cam data. The Galactic extinction was corrected with the values in NED based on Schlegel et al. (1998) and Schlalfy&Finkbeiner (2011); =(0.08, 0.06, 0.05, 0.09, 0.06) and (0.08, 0.06, 0.05, 0.10, 0.07) for HaR-1,2 field and HaR-3,4 field, respectively. Their magnitudes (MAG_AUTO) after the Galactic extinction correction are given in Tables 2 and 3.
A.2 KPNO-4m
NOAO science archive111111http://portal-nvo.noao.edu/ provides calibrated data around the region that were taken on 2007-04-22 and 2007-04-23 with NOAO MOSAIC 1 on the KPNO 4m Mayall telescope. The data were already used in Kenney et al. (2008). We retrieved the data in rest-H(ha; center=6566Å, FWHM=80Å at F=3.1), H around the Virgo redshift (ha4; center=6610.1Å, FWHM=80Å at F=3.1) , and R-band (center=6622Å, FWHM=1490Å at F=3.1). The filter characteristics are given on the KPNO web site121212http://www.noao.edu/kpno/mosaic/filters/, and the center and FWHM were calculated from the transmission data, and 15Å shift of R-band at F=3.1.
A.3 GALEX
In the GALEX archive131313http://galex.stsci.edu/GR6/, several coadded tiles covered the targets. We retrieved the coadded FITS images listed in Table 10, and measured the flux in a circular aperture in FUV (1344–1786Å) and NUV (1771–2831Å) bands (Morrissey et al., 2007). As the FWHM of the PSF of GALEX was large, we adopted the aperture size of 6 arcsec radius. The files presented as *_skybg.fits of each tile was used for the background correction. The background subtracted aperture fluxes in the tiles were averaged with the weight of exposure time, and converted to AB magnitude using the zero point given in Morrissey et al. (2007). We adopted the Galactic extinction correction in GALEX bands by Wyder et al. (2007) as , and . The results were =(0.206,0.206), (0.230,0.231). for HaR-1,2 field and HaR-3,4 field, respectively. The magnitude errors were estimated following the GALEX webpage141414http://galexgi.gsfc.nasa.gov/docs/galex/FAQ/counts_background.html. The results are given in Table 2. In FUV data, HaR-1 shows no recognizable shape. We therefore assumed the measured aperture flux as the upper limit.
A.4 XMM-OM
The target fields were also observed by XMM-Newton Optical Monitor (XMM-OM), and UVW1 (center=2905Å, width=620Å Kuntz et al., 2008) magnitudes of HaR-2,3, and 4 are available in the catalog in the archive. The data were obtained from MAST151515http://archive.stsci.edu/. The catalog magnitudes are shown in Table 11. Although the error of magnitude was larger than that of GALEX, the spatial resolution of XMM-OM was higher: the FWHM of PSF was 5 arcsec and 2.3 arcsec for GALEX NUV band and XMM-OM UVW1 band, respectively. We checked that there is no apparent contamination from nearby objects around the targets in the UVW1 band of XMM-OM.
A.5 SDSS
HaR-4 was detected in SDSS3 DR9 as SDSS J122613.13+124300.4. The SDSS magnitudes are shown in Table 12. We corrected Galactic extinction and the offset of SDSS-magnitude from AB-magnitude by the K-correct v4(Blanton & Roweis, 2007); =-0.036, 0.012, 0.010, 0.028, and 0.040 for u, g, r, i, and z-band, respectively. The i-band magnitude was comparable to our measurement in Suprime-Cam in Table 2. Other three HaRs were not detected in SDSS.
We found that the model magnitude of HaR-4 was 0.7 mag brighter in SDSS data release 7 (DR7 Abazajian et al., 2009) than that in DR9. The reason would be the difference of the adopted model profile of the object: Petrosian radius was 7.359(DR7) arcsec vs 2.475(DR9) arcsec. As seen in Figure 3 bottom, whose image size is 20 arcsec square, Petrosian radius of 7.3 arcsec was too large for HaR-4, and we consider the magnitude in DR9 was appropriate.
The 0.7 mag difference was specific to HaR-4. Other brighter objects had comparable magnitude. Our photometric calibration of Suprime-Cam data based on DR9 was not affected even if we used DR7.
A.6 IRAC/Spitzer
We retrieved calibrated data of InfraRed Array Camera (IRAC) of Spitzer Space Telescope in 3.6 m (ch1) and 4.5 m (ch2) channels from IRSA161616http://irsa.ipac.caltech.edu/. Five images taken in February and March 2010 covered our target fields. Their unique observation identification number (AORKEY) and observation date are shown in Table 13. Exposure time was 93.6 and 96.8 seconds for ch1 and ch2, respectively.
We used the flux zero point given in the calibrated FITS headers (1 DN pixel-1 = 106Jy steradian-1). After background subtraction, aperture photometry of 3 arcsec radius was performed for each target in each image. Then, median flux was calculated for each target.
The error of each image was estimated from the median of the absolute deviation of random aperture photometry of 3 arcsec radius. AB magnitudes were calculated as
| (A1) |
The result is shown in Table 2.
HaR-1 was not recognized in the IRAC images, and the aperture flux was negative in some of the images. The upper limit of aperture flux in 3 arcsec radius in ch1 (0.7Jy) was therefore used. HaR-3 was heavily blended with the neighbor galaxy. We tried to measure the flux in a semicircular aperture to mask the side of the neighbor galaxy, and double the flux. The value should still suffer from the envelope of the neighbor galaxy, and we regard it as the upper limit of the flux.
| filter | DATE-OBS(UTC) | exptime |
| R | 2002-06-05 | 6min 6 |
| 2002-06-06 | 6min 12 | |
| NA659 | 2001-04-25 | 5.5min |
| 2001-04-26 | 20 min 5 | |
| V | 2001-03-24 | 5min 3 |
| NA503 | 2001-04-24 | 20min 3 |
| i | 2010-04-12 | 2.8min 5 + 1.4min |
| SDSS-Suprime | CCD | SDSS | range | |||||
|---|---|---|---|---|---|---|---|---|
| MIT | 00.8 | -0.037 | 0.701 | -0.508 | 0.278 | … | ||
| MIT | 00.6 | -0.046 | -0.228 | -0.101 | … | … | ||
| SITe | -0.40.8 | 0.039 | 0.574 | -0.030 | 0.271 | -0.221 | ||
| HPK | -0.41.6 | -0.006 | 0.089 | 0.019 | -0.015 | … |
| Tile | EXPTIME(FUV) | EXPTIME(NUV) | OBS-DATE |
|---|---|---|---|
| NGA_Virgo_MOS10 | 1590.25 | 3128.45 | 2004-03-11 |
| Virgo_Epoque_MOS01 | 482.15 | 15699.9 | 2006-03-20 |
| Virgo_Epoque_MOS08 | 504.05 | 16419.85 | 2006-03-20 |
| GI5_057013_NGC4388 | 2538. | 4993.8 | 2009-05-07 |
| Name | XMM-OM dataset | UVW1 mag | DATE-OBS |
|---|---|---|---|
| (ABmag) | |||
| HaR-1 | 0108260201 | … | 2002-07-02 |
| HaR-2 | 0108260201 | 21.9 0.4 | 2002-07-02 |
| HaR-3 | 0110930301 | 21.50.5 | 2002-07-07 |
| HaR-4 | 0110930301 | 21.10.3 | 2002-07-07 |
| 0110930701 | 21.20.5 | 2002-12-12 |
| object | u | g | r | i | z |
|---|---|---|---|---|---|
| HaR-4 | 22.40.5 | 21.310.08 | 21.380.12 | 21.550.16 | 21.60.6 |
| AORKEY | DATE_OBS |
|---|---|
| 35323392 | 2010-03-11 |
| 35324160 | 2010-03-10 |
| 35325184 | 2010-03-08 |
| 35325696 | 2010-03-03 |
| 35326208 | 2010-02-24 |
Appendix B Detail of the age and mass estimation
For age and mass estimation of HaRs, we used STARBURST99 v6.0.4(Leitherer et al., 1999; Vazquez&Leitherer, 2005; Leitherer et al., 2010) model and calculate the magnitudes and H luminosity. We adopted the metallicity Z=0.02, the IMF by Kroupa (2001), an instantaneous burst of a fixed mass, and both Geneva and Padova stellar evolutionary tracks. We also tested Salpeter IMF (Salpeter, 1955), but the result did not change significantly. The spectra were redshifted to the velocity of HaR-2: z=0.0074. We checked that the redshift difference of HaR-1,2(z=0.0074) and HaR-3,4(z=0.0078) made only mag difference, and we neglected the effect.
The model magnitudes were calculated from the spectrum of each age multiplied with system responses of GALEX, KPNO mosaic, IRAC, and Suprime-Cam/Subaru. The filter transmittances of GALEX were obtained from COSMOS filter response page171717http://www.astro.caltech.edu/~capak/cosmos/filters/, which data was converted from Morrissey et al. (2005). The filter transmittances of IRAC were taken from Spitzer Document page at IRSA181818http://irsa.ipac.caltech.edu/data/SPITZER/docs/irac/calibrationfiles/spectralresponse/. The filter transmittances of Suprime-Cam were constructed as the product of the quantum efficiency of CCDs191919http://www.naoj.org/Observing/Instruments/SCam/ccd.html, the transmittance of the primary focus corrector202020http://www.naoj.org/Observing/Telescope/Parameters/PFU/, the reflectivity of the primary mirror212121http://www.naoj.org/Observing/Telescope/Parameters/Reflectivity/, the atmospheric extinction model used in Yagi et al. (2013), and the filter responses in Subaru WWW for i-band 222222http://www.naoj.org/Observing/Instruments/SCam/sensitivity.html. The simulated filter responses of KPNO mosaic Ha at F/3.1 focus was taken from the NOAO web page232323http://www.noao.edu/kpno/mosaic/filters/. Note that we did not use V, R, NA503, and NA659 of Suprime-Cam and ha4 of KPNO in this fitting, since they would be contaminated by strong nebular emission lines. As the transmittance of Suprime-Cam and KPNO mosaic was measured in the air wavelength, the model spectra were converted to the air wavelength using the index of Ciddor (1996), when these magnitudes were calculated. The internal extinction was calculated as (Calzetti et al., 2000), where are given in Table 6. The coefficient we adopted are (FUV,NUV,V,R,i,3.6,4.5)=(8.24,8.24,3.1,2.5,1.9,0.203,0.156), respectively.
From the model calculation, we can plot the log of the H luminosity (L(H)) as a function of the logarithm of the age T as Figure 10 top-left. In the figure, observed L(H) is shown as a solid horizontal line, and the 1- of the L(H) are shown as broken horizontal lines. The crossing is the solution where the model and the observation are consistent. By adding an offset of of the model at each age, the figure is transformed so that the ordinate corresponds to the initial mass of the cluster (Figure 10 top-right). In the figure, models are horizontal (since the initial mass is time-invariant), and observed value is a curve. The error of the curve comes from the observed value, including the uncertainty of the internal extinction correction, and the amount of the error is the same at each age. No error of age at each point.
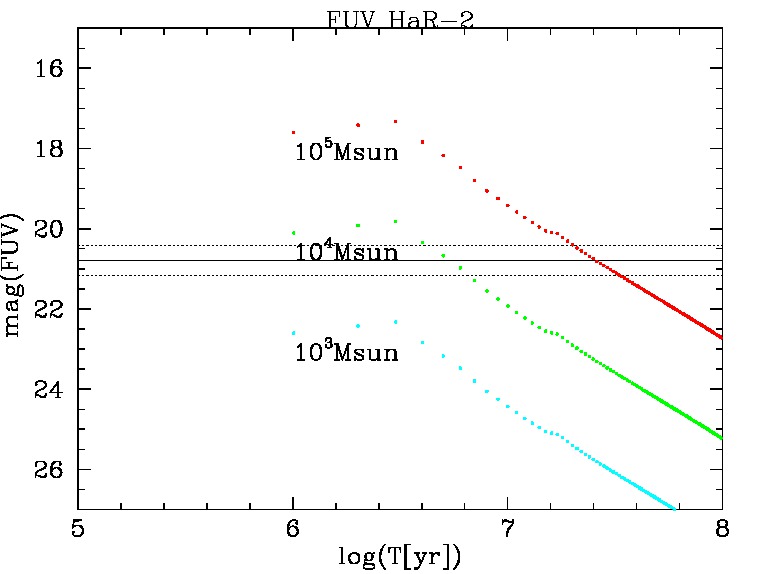
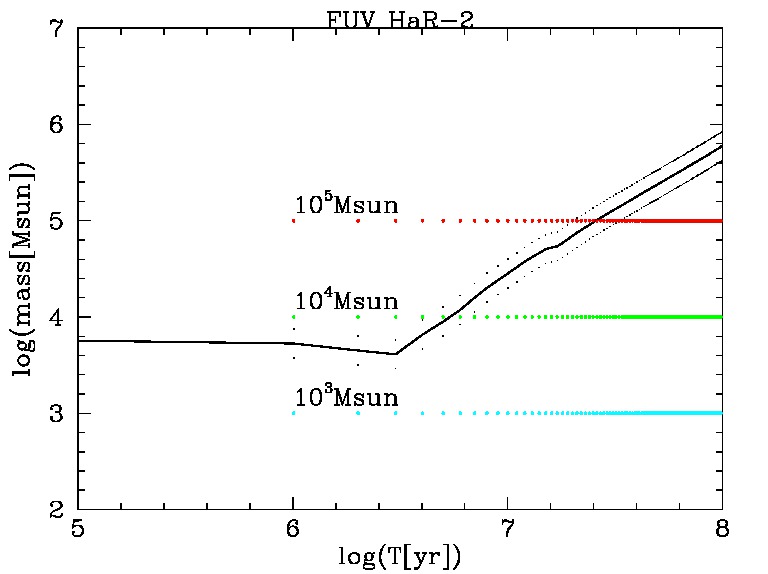
Similar transformation is applicable to the plots of magnitudes. For example, the FUV magnitude is plotted as Figure 10 bottom-left. It is converted to Figure 10 bottom-right by multiplying by -2.5 and adding an offset of of the model at each age, where log(l(FUV))=-2.5 magFUV.
Since the coordinates of the transformed figures (right panels of Figure 10) are the same, we can overplot them in a single figure, with magnitudes in other bands. Figures 8 were thus constructed. And the crossing of these curves is the solution where the models and the observations are consistent.