TIME-DEPENDENT NONEXTENSIVITY ARISING FROM THE ROTATIONAL EVOLUTION OF SOLAR-TYPE STARS
Abstract
Nonextensive formalism is a generalization of the Boltzmann–Gibbs statistics. In this formalism the entropic index is a quantity characterizing the degree of nonextensivity, and is interpreted as a parameter of long-memory or long-range interactions between the components of the system. Since its proposition in 1988, this formalism has been applied to investigate a wide variety of natural phenomena. In stellar astrophysics, theoretical distribution function based on nonextensive formalism (–distributions) has been successfully applied to reproduce the distribution of stellar radial and rotational velocity data. In this paper, we investigate the time variation of the entropic index obtained from the distribution of rotation, , for a sample of 254 rotational data for solar-type stars from 11 open clusters aged between 35.5 Myr and 2.6 Gyr. As a result, we have found an anti-correlation between the entropic index and the age of clusters, and that the distribution of rotation for these stars becomes extensive for an age greater than about 170 Myr. Assuming that the parameter is associated with long-memory effects, we suggest that the memory of the initial angular momentum of solar-type stars can be scaled by the entropic index . We also propose a physical link between the parameter and the magnetic braking of stellar rotation.
Subject headings:
open clusters and associations: general – stars: evolution – stars: rotation – stars: statistics1. INTRODUCTION
Open clusters are formed by stars at nearly the same distance, with the nearly the same chemical, and created at essentially the same time. They are highly important in astrophysics because they serve as “laboratories” to test theoretical models related to the effects and characteristics of the stellar composition, evolution, and environment. It is widely accepted that star clusters are formed from the fragmentation of large, dense and rotating molecular clouds, and in this process the original cloud angular momentum is partially transferred to the newly formed stars (Ballesteros-Paredes et al., 2011a, b; Tomisaka, 2000).
The forming stars experience the action of several mechanisms changing their angular momentum. These mechanisms include spin-up due to contraction of the cloud, redistribution of spin momentum of the contracting cloud into orbital momentum of components by fragmentation, turbulent transport of the kinetic momentum in differently rotating clouds, and remotion of angular momentum by magnetohydrodynamical effects such as magnetic braking and driving of outflows and jets (Königl, 1991; Shu et al., 1994; Siess & Livio, 1999; Masahiro et al., 2007). All these mechanisms acting in certain stages, or even during the whole stellar formation process establish the angular momentum with which the star reaches the main sequence.
After the star formation, closer encounters including tidal forces owing to the Galactic gravitational field, encounters with field stars, and interstellar clouds crossing the way of the star cluster are expected to occur. Furthermore, structural changes in the momentum of inertia due to a likely rotational decoupling between the core and the outer shells of the star, and loss of angular momentum to the stellar magnetized winds can play an important role in the evolution of the stellar angular momentum (e.g., Endal & Sofia, 1978; Kawaler, 1988; Bouvier, 2008; Scholz, 2009; Spada et al., 2011). All these physical mechanisms contribute to the gradual loss of memory of initial stellar angular momentum, and makes the determination of the distribution of the stellar rotation a difficult task.
In fact, over the last six decades, many researchers have proposed different laws controlling the rotational velocity distributions (see Brown, 1950; Chandrasekhar & Münch, 1950; Deutsch, 1965, 1970; Gaigé, 1993; Fukuda, 1982; Guthrie, 1982). Usually, the frequency function for the rotational velocity, , is assumed to be a Maxwell–Boltzmann distribution law (e.g., Deutsch, 1965, 1970), which considers that the system has no memory of past experience (the ergodic hypothesis). Soares et al. (2006) have modified the basic hypothesis of statistical independence between the distributions associated with the stellar angular momentum components and have proposed the nonextensivity of the stellar angular momentum (see also the discussion in Carvalho et al., 2008). In this context, the distribution function for is given by
| (1) |
where is an entropic index that measures the nonextensivity of the system (see Section 2), and is a mass-dependent parameter associated with the characteristic width of the distribution (see Soares & Silva, 2011). At the limit , Equation (1) reproduces the Maxwellian function proposed by Deutsch (1965). This distribution function has been tested and has been successful in describing the distribution of observed stellar rotation data (Soares et al., 2006; Carvalho et al., 2008, 2010; Santoro, 2010; Soares & Silva, 2011). More recently, de Freitas & De Medeiros (2013) have analyzed the relationship between the rotation and star ages in the context of the Tsallis formalism, and have shown that relationship can be well reproduced using the nonextensive theory approach.
In this paper we report the results of the analysis of the relationship between the index and the stellar age based on a sample of 254 rotational velocity data for solar-type stars in open clusters. In the next section, we summarize the basic idea of nonextensive formalism. The data are outlined in Section 3. In Section 4, we present the method to obtain the parameters and from the distribution, followed by the discussion of the relationship between and cluster ages in Section 5. Finally, we summarize our main results in Section 6.
2. NONEXTENSIVE FORMALISM
Nonextensive formalism was proposed in Tsallis (1988) and it has since been shown to be useful for studying systems out of equilibrium with long-ranged interactions, long-ranged memories, or which evolve in fractal-like space-time. In this formalism the entropy is defined by
| (2) |
where is a positive constant, denotes the probability for occupation of -th state, and is the total number of the configurations of the system. As , the nonextensive entropy definition recovers the standard form
| (3) |
where is the usual Boltzmann constant. This means that the definition of nonextensive entropy contains Boltzmann–Gibbs statistics as a special case.
The entropic index value is determined by the microscopic dynamics of the system and characterizes the degree of nonextensivity, according to the following pseudo-additivity rule for two independent systems and :
| (4) |
where and correspond to superextensivity and subextensivity, respectively. In the limit , it recovers the Boltzmann–Gibbs entropy, which is extensive.
In nonextensive formalism the parameter is interpreted as a parameter of long-memory or long-range interactions between the components of the system, and larger values for emphasize these long-memory or long-range interactions. Apart from the stellar rotation, nonextensive formalism has been successfully applied to investigate a wide variety of natural phenomena, such as self-gravitating polytropic systems (Plastino & Plastin, 1993), Fokker–Planck systems (Stariolo, 1993), high energy collisions (Wilk & Wlodarcsyk, 2000), models for earthquakes (Silva et al., 2006), and stellar radial velocity in open clusters (Carvalho et al., 2007).
3. THE SAMPLE
The work sample consists of 254 data for solar-type stars from 11 Galactic open clusters aged between 35.5 Myr and 2.6 Gyr. The rotational data have been selected from the survey of radial and rotational velocities performed by Mermilliod, Mayor & Udry (2009). The measurements were made with the CORAVEL spectrometer (Baranne et al., 1979; Benz & Mayor, 1981), and the values were obtained following the calibration of Benz & Mayor (1984), which enables measurements of for dwarf stars with an accuracy of about 1. For this study, we have selected only the stars that are considered cluster members, namely stars not flagged as “NM” in the notes column of Table 11 of Mermilliod, Mayor & Udry (2009), and with a color index ranging in the interval of , which corresponds to the stellar masses ranging in the interval of (Cox, 2000). We have also rejected the spectroscopic binary stars because their rotational velocities can be affected by tidal effects (e.g., Zahn, 1977).
As we are analyzing the relationship between and the cluster ages, using a homogeneous sample of cluster ages is fundamental in this analysis. The data from Kharchenko et al. (2005) provides a uniform scale of ages for all clusters we are studying since all their cluster ages were determined with the same isochrone-based procedure. These authors have established that the accuracy of their cluster age sample is around 0.2–0.25 in log(age) by considering the sources of uncertainty that potentially affect their method. One of the main factors limiting the accuracy in determining their cluster ages is that for many young clusters ( Gyr) the ages were estimated by fitting only one cluster member star. Another study relatively more rigorous in determining the ages by isochrone fitting was performed by Meynet et al. (1993). These authors used a homogeneous data set of more than 4000 stars with accurately determined membership, distance, metallicity, binarity, and reddening to estimate the ages of 30 open clusters between 4 Myr and 9.5 Gyr. The comparison between the ages estimated by Kharchenko et al. (2005) and Meynet et al. (1993) for 28 clusters presents a good overall agreement, with a root mean square (rms) of 0.33 in log(age). In the present study, we will use the homogeneous sample of cluster ages from Kharchenko et al. (2005). However, as the accuracy of the cluster ages may significantly influence our conclusions, we will be more careful about the possible range of individual cluster ages, and will adopt a range equal to twice the rms value from the comparison with the Meynet et al. (1993) data, instead of the accuracy established in Kharchenko et al. (2005).
As the age of Hyades is not provided by those authors, due to a limitation in their technique, we have considered the age of 787 Myr provided by the database for stars in open clusters WEBDA database (http://www.univie.ac.at/webda/). The color indices were also taken from WEBDA. The original survey in Mermilliod, Mayor & Udry (2009) contains 13 open clusters; however, two of them could not be analyzed in this work because they have few data in the color index range we are considering. They are IC 2391 and NGC 7092 with only one and two data, respectively. In Table 1 we present the main characteristics of our work sample. The number of stars in each cluster whose rotations are analyzed is given in the Column (2), the mean color index and the mean rotational velocity in for these stars are shown in Columns (3), and (4), respectively, and Column (5) presents the logarithm of the cluster age in years.
| (1) | (2) | (3) | (4) | (5) | (6) | (7) | (8) | (9) | (10) | (11) |
|---|---|---|---|---|---|---|---|---|---|---|
| Cluster | aaMean value for stars in the cluster standard deviations from the mean value. | aaMean value for stars in the cluster standard deviations from the mean value. | log(age) | RSSbbThe residual sum of squares measuring the discrepancy between the data and the estimation model. | Prob. | |||||
| AlphaPer | 14 | 0.64 0.07 | 24.9 17.6 | 7.55 | 1.460 0.072 | 1.000 | 14.121 1.861 | 1.001 | 0.015 | 0.678 |
| NGC 1976 | 8 | 0.63 0.05 | 12.6 11.1 | 7.71 | 1.508 0.079 | 0.999 | 5.132 0.789 | 1.001 | 0.007 | 0.671 |
| IC 2602 | 11 | 0.61 0.07 | 19.6 17.2 | 7.83 | 1.462 0.158 | 0.995 | 9.841 2.595 | 1.004 | 0.024 | 0.634 |
| Pleiades | 41 | 0.65 0.07 | 15.9 12.3 | 8.08 | 1.185 0.085 | 0.997 | 13.215 1.095 | 1.003 | 0.017 | 0.628 |
| NGC 6475 | 13 | 0.68 0.08 | 15.8 9.4 | 8.22 | 1.188 0.108 | 1.001 | 13.868 1.524 | 1.002 | 0.007 | 0.646 |
| Blanco 1 | 26 | 0.64 0.07 | 12.3 10.1 | 8.32 | 1.015 0.070 | 0.996 | 12.067 0.670 | 1.001 | 0.006 | 0.685 |
| ComaBer | 8 | 0.61 0.07 | 9.4 5.7 | 8.78 | 1.078 0.181 | 0.997 | 8.341 1.222 | 1.001 | 0.003 | 0.671 |
| Hyades | 43 | 0.63 0.08 | 7.5 5.7 | 8.90 | 1.081 0.109 | 0.998 | 6.878 0.615 | 1.002 | 0.033 | 0.600 |
| Praesepe | 43 | 0.65 0.07 | 6.7 3.1 | 8.90 | 0.759 0.095 | 0.988 | 8.646 0.475 | 1.005 | 0.097 | 0.516 |
| NGC 0752 | 19 | 0.59 0.04 | 5.7 3.3 | 9.14 | 1.015 0.157 | 1.001 | 6.147 0.754 | 1.000 | 0.015 | 0.657 |
| NGC 2682 | 27 | 0.61 0.06 | 5.3 2.8 | 9.41 | 0.772 0.214 | 0.973 | 6.975 0.869 | 1.010 | 0.111 | 0.618 |
4. PARAMETERS AND FROM THE DATA
The Empirical Cumulative Distribution Function (ECDF) for each cluster was computed as follows: (1) First, we sorted the data set in ascending order, from the smallest to the largest , where is the amount of data for the cluster. (2) Then we computed the unbiased parameter defined as
where . (3) Finally, the ECDF was made by plotting the computed parameter versus values (Qin et al., 1998).
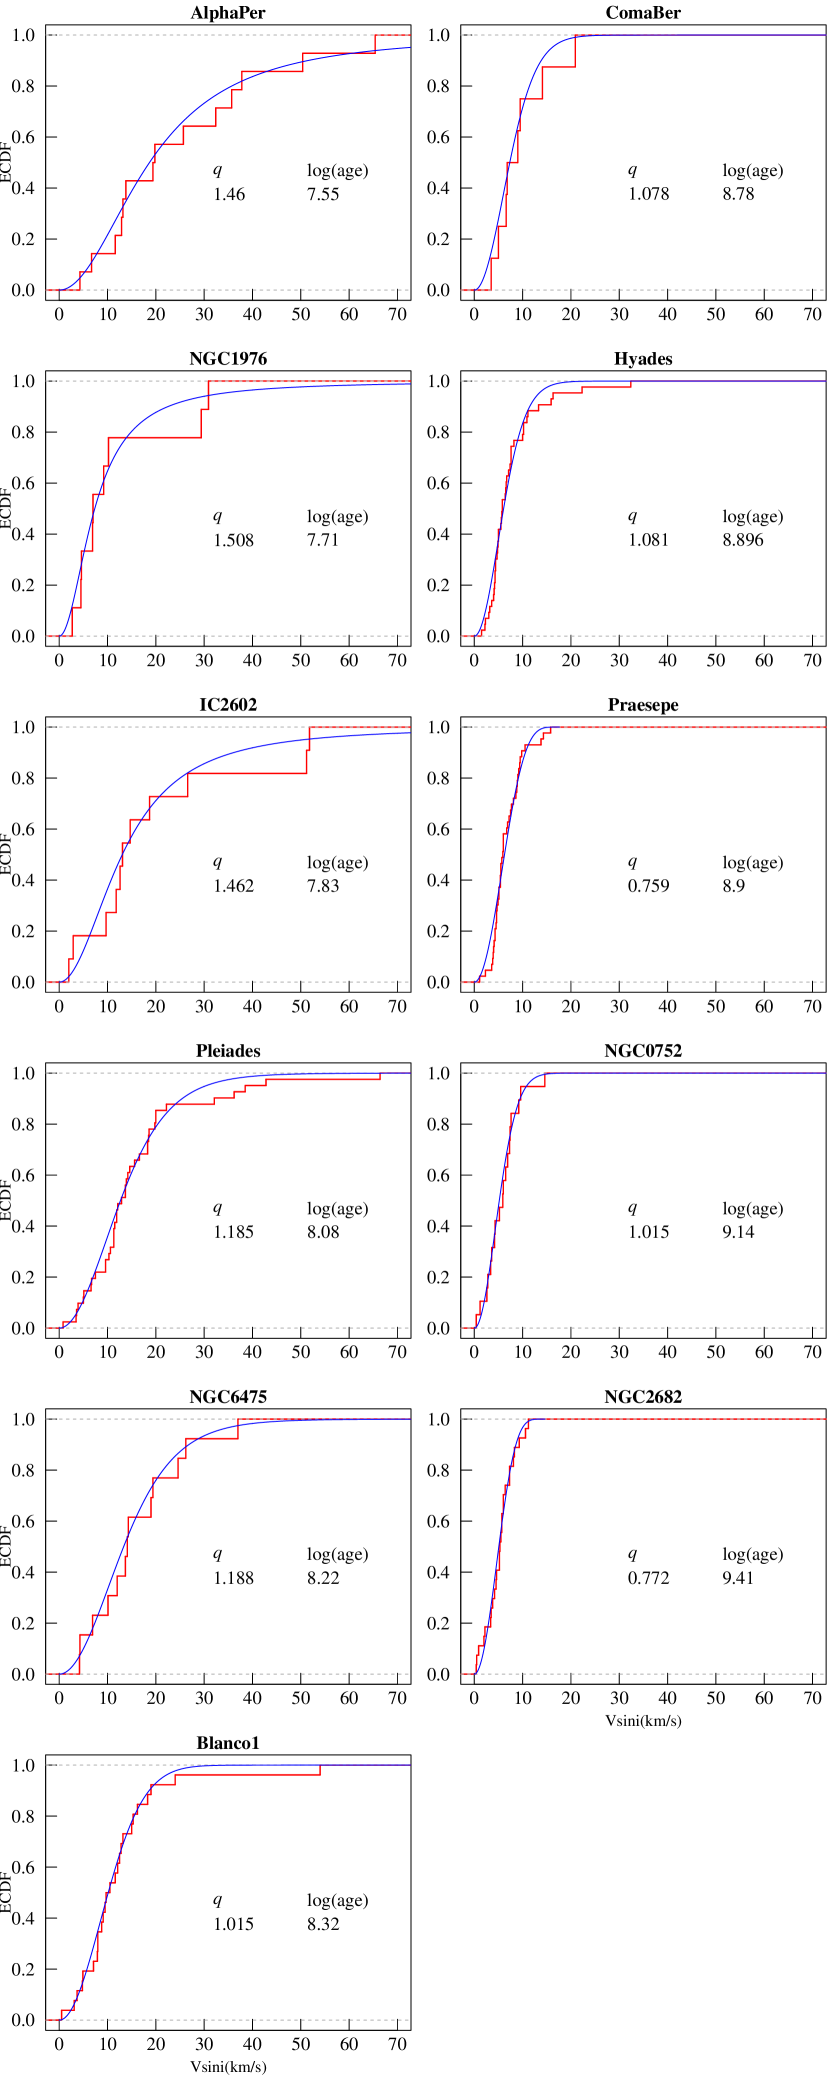
To determine the best-fit parameters and , we first found a non-linear relation between the variables and by computing a Nadaraya–Watson kernel regression estimator (KDE) from the ECDF with a Gaussian kernel and an appropriate bandwidth selected according to Scott’s rule (Nadaraya, 1964; Watson, 1964; Scott, 1992). Next, we determined the best-fit parameters and by fitting the integral of Equation (1) to the ECDF. To adjust the curve, we used a Gauss–Newton algorithm to minimize the residual sum of squares and a convergence tolerance of (Bates & Chambers, 1992). In order to reduce the risk of convergence to a local minimum, we used a graphical display to approximately match the curve to the KDE by manually adjusting the parameters and . The values that produce the visually matched curve were then used as the starting values. In addition, we tested the convergence, by making the best-fit parameters and vary randomly until 30% from its original value and using these new random values to start the procedure of fit. For all clusters, this process was repeated 300 times, and the parameters always converged to the original best-fit values. The best-fit curves for each ECDF are presented in Figure 1.
In order to constrain the best-fit parameters and to a 95% confidence interval, we used bootstrap resampling with 1000 replicates to estimate the errors. The best-fit parameters, and , and their error values are presented in Columns (6) and (8) of Table 1. In Columns (7) and (9), we compare the best-fit values for and with the same parameters from bootstrap resampling, and , respectively. Finally, as the KDE provides an independent probability estimation for each ECDF, we compared the best-fit curve with the KDE. For each cluster, we have performed an Anderson–Darling –sample test adjusted for ties (Scholz & Stephens, 1987) with a 95% confidence level, and the null hypothesis that the best-fit curve and the KDE were drawn from the same probability distribution. The null hypothesis was accepted for all clusters, according to the probability values shown in Column (11) of Table 1.
4.1. Low Values
The values of from Mermilliod, Mayor & Udry (2009) were determined by using the calibration of Benz & Mayor (1984). Such a calibration allows the separation of the stellar rotation from the intrinsic sources of line broadening such as micro– and macroturbulence, pressure, and Zeeman splitting, and enables the measurement of for dwarf stars with an accuracy of about 1, even for rotators with (c.f. Benz & Mayor, 1984). However, as reported by Queloz et al. (1998), a precise separation of the rotation from all other broadening mechanisms affecting the stellar spectral lines is crucial for determining the values of rotators below . In this work, the overestimation of for low rotators will cause narrowing of the ECDF, which results in a systematic shift of the best-fit to lower values. In order to evaluate the influence of this possible systematic error in determining the rotation of slow rotators in our results, we proceeded as follows. We have performed for each cluster an Anderson–Darling –sample test with a 95% confidence level to compare a sample such that all data with rotation of less than were excluded with the original sample, containing all the data of rotation of the cluster. The test results have showed that except for Hyades and NGC 2682, the two samples for each cluster come from a common population. For Hyades and NGC 2682, we determined the values by considering all the slow rotators () as non-rotators (). Using the procedures described in Section 4, we obtained the best fit values (; ), and (; ) for Hyades and NGC 2682, respectively. These values are very similar to these ones presented in Table 1, when we take into account the estimated errors. Then, possible systematic errors in the determination of do not seem to significantly affect our results.
5. THE RELATIONSHIP BETWEEN AND STELLAR AGES
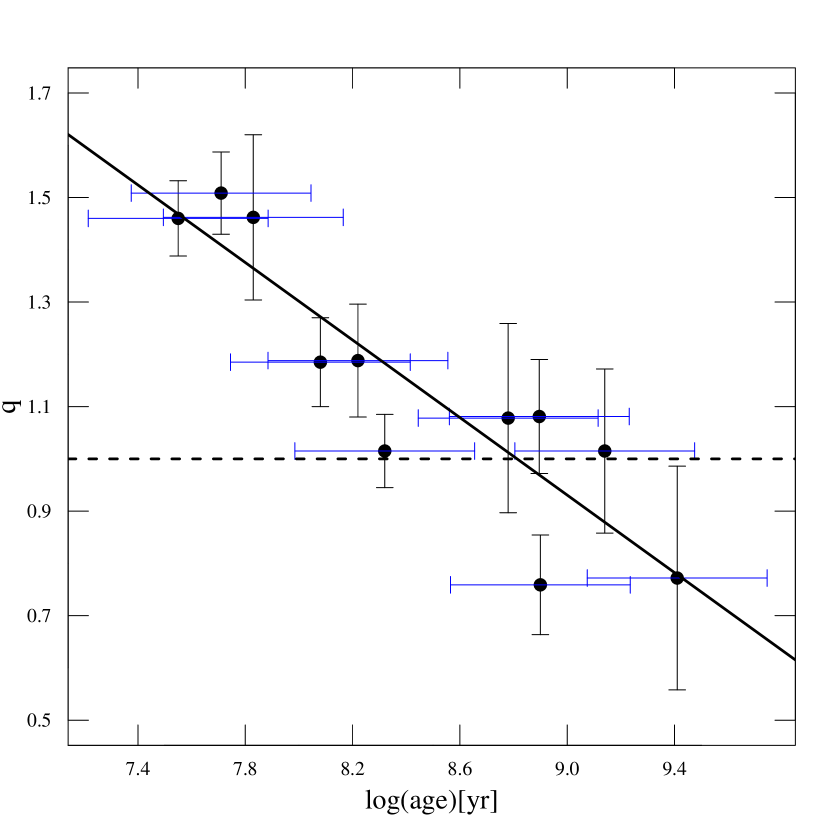
Figure 1 displays the ECDF of (dashed line) for each cluster, and the respective best-fit curves (solid line). The changes to the shape of the ECDF with cluster age is phenomenologically well understood. The younger clusters have a population of high rotators, and they present a higher mean, and a longer tail to high velocities. As the cluster ages, this population evolves to slow rotators (Skumanich, 1972; Kawaler, 1988; Barnes, 2003; Irwin & Bouvier, 2009), the mean decreases, and the ECDF becomes steeper. The values are correlated with the mean values. We used a Spearman’s statistic to estimate a rank-based measure of correlation between and mean . Such a test gives the measure of correlation between variables as the parameter ranging in the interval , with indicating no correlation (Hollander & Wolfe, 1973). The result gives with a probability for the null hypothesis that the true is lesser than 0. As the index is sensitive to the mean of the distribution it is also sensitive to the cluster ages. The time-variation of the nonextensivity of the distributions as measured by emerges most clearly from Figure 2, where we have plotted the index as a function of the cluster ages. There is an anti-correlation between these two parameters. The Spearman’s statistic gives , and for the null hypothesis that the true is greater than 0.
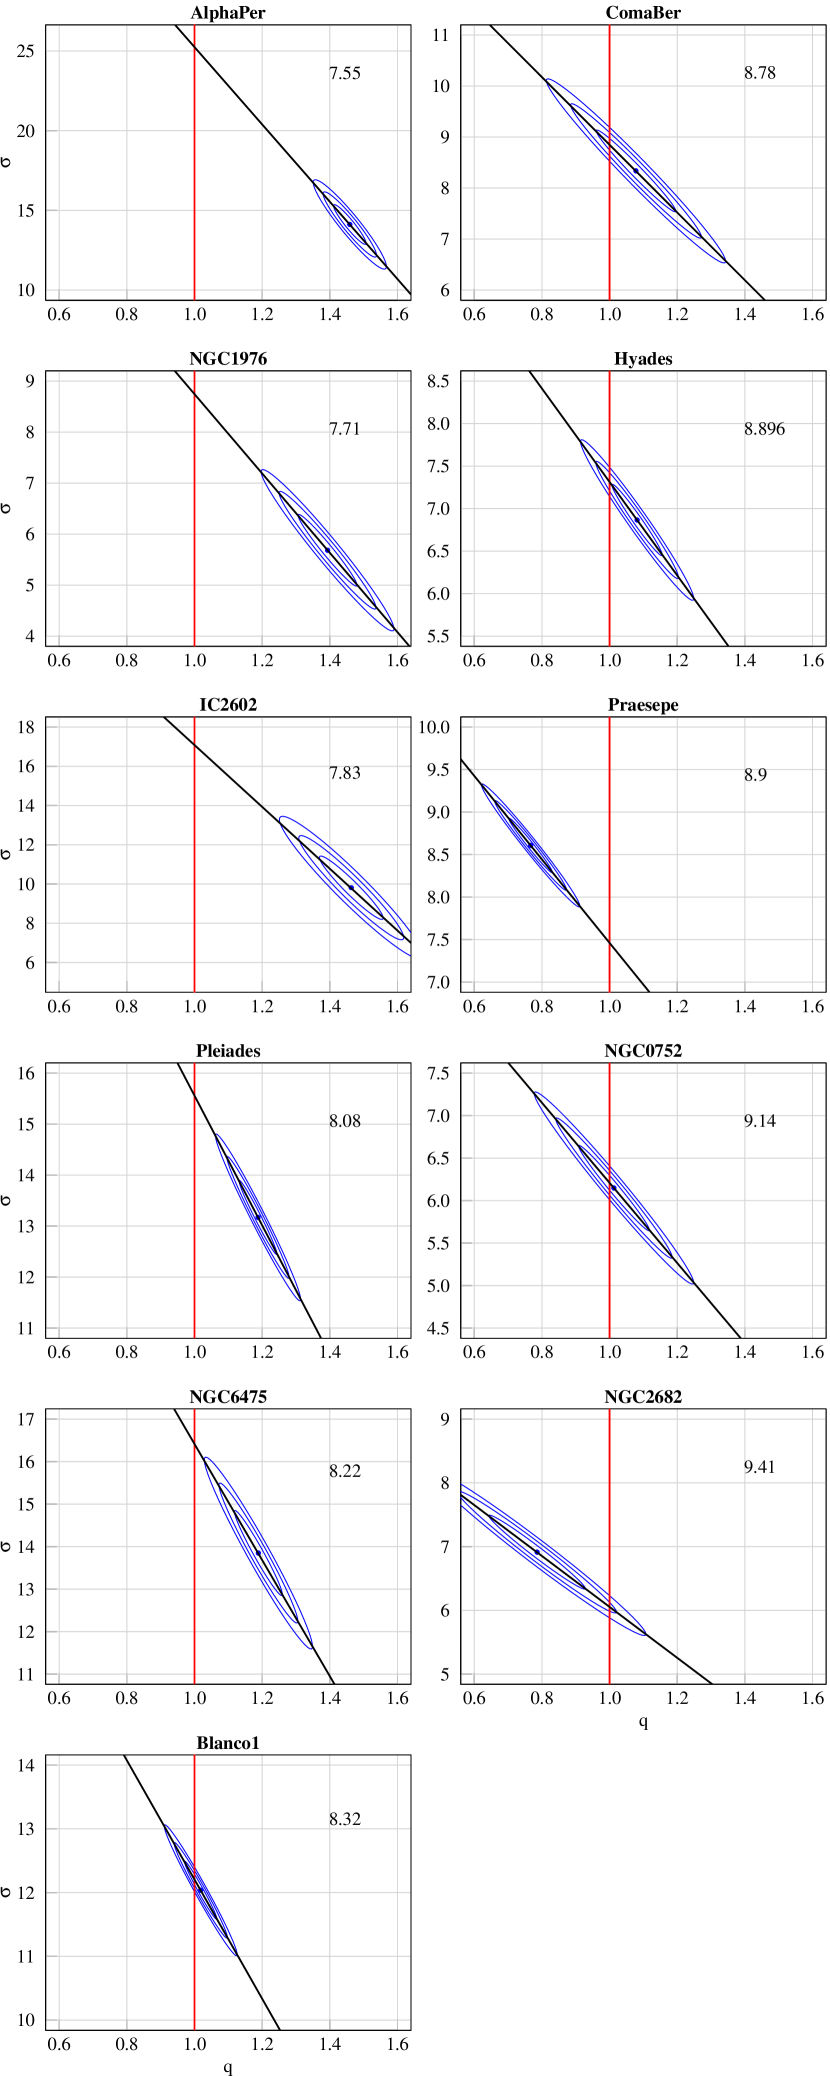
The parameter is associated with the characteristic width of the distribution, and therefore we expect that it is also correlated with the cluster ages. Spearman’s statistic returns a correlation between and cluster ages of , and a probability for the null hypothesis that the true is greater than 0. In order to analyze whether this correlation influences our results, we have drawn the 68.3%, 95.5%, and 99.7% confidence ellipses on the plane, as shown in Figure 3. The confidence ellipses were computed for 1000 bootstrap replications of and parameters for each cluster. According to Figure 3, we can state with a confidence level of 99.7% that the nonextensivity of the distributions () is present until about the age of NGC 6475: dex Myr. If we consider the age range adopted for Blanco 1, our sample will give a minimum age limit to nonextensivity of dex Myr.
The nonextensivity (i.e., ) of the distribution of stellar rotation, , was reported by Soares et al. (2006); Carvalho et al. (2008, 2010); Santoro (2010); and Soares & Silva (2011). Now we state that for solar-type stars in open clusters: 1) the nonextensivity of the distribution of decreases when the cluster ages, and 2) the distribution of becomes extensive for ages of about 700 Myr. As mentioned in Section 2, the entropic index measures the degree of nonextensivity of the system and emphasizes effects associated with long-memory or long-range interactions. In this context, one possible explanation for the anti-correlation between and cluster age would be the memory of the initial angular momentum of the stars vanishing and thus, this memory loss would be scaled by the entropic index . We recall that the solar-type stars retain the memory of their initial angular momentum until an age of greater than 100 Myr, with this age being even higher for lower mass stars (Pinsonneault et al., 1990; Bouvier, Forestini & Allain, 1997; Scholz & Eislöffel, 2007; Bouvier, 2009; Scholz, 2009; Irwin & Bouvier, 2009). We estimate that the age for extensivity, when stars have lost all memory of past angular momentum history, is around 700 Myr considering the best-fit curve presented in Figure 2.
In their study, de Freitas & De Medeiros (2013) have shown that the rotation–age relationship can be reproduced using a model from nonextensive formalism. Their model, based on the nonextensivity parameter , derived from the Kawaler’s parameterization, has been tested using data for F- and G- type main-sequence field stars with ages limited to 10 Gyr, and has closely reproduced the decrease of rotation with age. These authors have proposed that the parameter is associated with the dynamo process and magnetic field geometry. In their model, indicates that the stars are in a saturated magnetic field regime, while higher values denote an unsaturated domain, where magnetic braking law can be applied. In this context, by considering the correlation between and the mean values, Figure 2 could indicate that cluster stars in our sample are in an unsaturated magnetic field domain (), where the effects of magnetic torque are present.
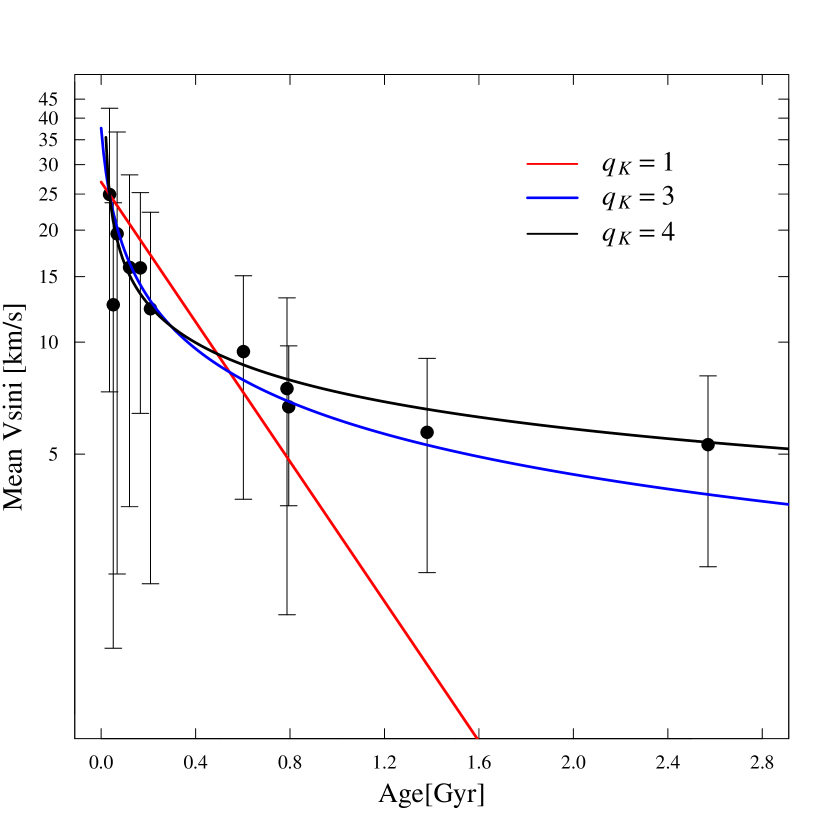
In Figure 4, we present the distribution of mean as a function of age as well as the curve obtained by fitting the model proposed by de Freitas & De Medeiros (2013) to the data (black line). The best-fit values for and the nonextensive Lyapunov exponent coefficient are , and , respectively, with a log-likelihood value . In addition, Figure 4 displays the best-fit curves for , , (red line), and , , (blue line), representing an exponential decay, and Skumanich law (Skumanich, 1972), respectively. The unsaturated model with as well as Skumanich law have smaller magnitudes, indicating that these models are better than the exponential decay in fitting the data.
According to Kawaler’s parameterization (Kawaler, 1988), and are parameters related to the dynamo theory and topology of the magnetic field, respectively. The –parameter ranges between 1 and 2, for the unsaturated domain, and is 0, for the saturated one. The saturated regime is described by a usual exponential ( in the nonextensive approach). The model proposed by de Freitas & De Medeiros (2013) suggests that the unsaturated regime is driven by a power law with exponent . For this regime, presents a lower value denoted by , when , and an upper value , when . Then, for , as obtained from our sample, the topology of magnetic field is essentially radial, with ranging from to . For Skumanich law, namely , depending on the value of the parameter , the topology of the magnetic field can be either radial, with , or dipolar, with . These values for parameter , are approximately equal to those obtained by de Freitas & De Medeiros (2013, see Table 1), if we consider the same mass range of the stars in our sample. In the context of the theory of magnetic braking, these results support the hypothesis that solar-type stars are under the action of a braking torque provided by a radial or dipolar magnetic field. Accordingly, recent numerical simulations for solar-like stellar winds from rotating stars with dipolar magnetic fields carried out by Matt et al. (2012) have shown that low or moderate rotation rates do not influences significantly the net torque on the star since at this rotational regime the the Alfvén radius111Matt et al. (2012) define the “Alfvén radius” as the cylindrical radial location where the wind velocity equals the local Alfvén speed. is nearly independent of the spin rate.
In order to establish the relationship between the parameter , derived from Kawaler’s parameterization, and the parameter from the distribution of , we suggest the equation . The variation is the difference between the logarithms of the cluster ages, and is the index for the cluster with age . This equation is a heuristic approximation based on the observation that when , it nearly matches the best-fit curve in Figure 2. There are at least two important consequences in admitting this relationship between , , and cluster age. First, the parameter will determine the slope of the curve versus cluster age. Second, we will have a bridge between the index and the theory of magnetic braking of stellar rotation, since is related to the parameters and .
Finally, it is worth mentioning that in a forthcoming paper we will present the results of applying this analysis to a large data set of rotational periods for solar mass stars in open clusters over the age range 1 Myr to Gyr (e.g., Herbst et al., 2002; Meibom et al., 2011). The rotation periods have multiple advantages over as, for example, the former is free of the ambiguity inherent to the , and since stellar rotational periods can be measured with high precision from spot-modulation, the slower rotators are better represented in the database.
6. CONCLUSIONS
We have analyzed the time relationship between the entropic index from the empirical distribution of rotational velocities for solar–type stars from 11 open clusters aged between 35.5 Myr and 2.6 Gyr. As a result, we have found that there is an anti–correlation between these values and the cluster age. The entropic index in Tsallis formalism is a measure of the degree of nonextensivity of a system, with larger values for emphasizing the long-memory or the long-range interactions. In this work we have proposed that the loss of initial angular momentum memory for solar type stars in open clusters can be scaled by the index . In this context, our results indicate that these stars lose the memory of their initial angular momentum for an age greater than about 170 Myr, when their rotational distribution becomes extensive. In addition, we have proposed a correlation between and the nonextensivity parameter from Kawaler’s parameterization, according to which determines the behavior of with cluster ages. Such a relation between these two parameters can constitute a link between the parameter obtained from the distribution of and the theory of magnetic braking of stellar rotation. Going forward, we believe that our results can provide an additional support for using Tsallis nonextensive formalism to investigate the stellar angular momentum evolution.
References
- Ballesteros-Paredes et al. (2011a) Ballesteros-Paredes, J., Hartmann, L. W., Vázquez-Semadeni, E., Heitsch, F., & Zamora-Avilés, M. A. 2011a, MNRAS, 411, 65B
- Ballesteros-Paredes et al. (2011b) Ballesteros-Paredes, J., Vázquez-Semadeni, E., Gazol, A., et al. 2011b, MNRAS, 416, 1436B
- Baranne et al. (1979) Baranne, A., Mayor, M., & Poncet, J. L. 1979, VA, 23, 279
- Barnes (2003) Barnes, S. A. 2003, ApJ, 586, 464
- Bates & Chambers (1992) Bates, D. M., & Chambers, J. M. 1992, in Statistical Models, ed. S. J. M. Chambers & T. J. Hastie (Pacific Grove, CA: Wadsworth & Brooks/Cole)
- Benz & Mayor (1981) Benz, W., & Mayor, M. 1981, A&A, 93, 235
- Benz & Mayor (1984) Benz, W., & Mayor, M. 1984, A&A, 138, 183
- Bouvier (2008) Bouvier, J. 2008, A&A, 489, 53
- Bouvier (2009) Bouvier, J. 2009, EAS, 39, 199
- Bouvier, Forestini & Allain (1997) Bouvier, J., Forestini, M. & Allain, S. 1997, A&A, 326, 1023
- Brown (1950) Brown, A. 1950, ApJ, 111, 366
- Carvalho et al. (2008) Carvalho, J. C., Silva, R., do Nascimento, J. D., Jr., & De Medeiros, J. R. 2008, EL, 84, 59001
- Carvalho et al. (2010) Carvalho, J. C., Silva R., do Nascimento Jr, J. D., Soares, B. B. & De Medeiros, J. R. 2010, EL, 91, 69002
- Carvalho et al. (2007) Carvalho, J. C., Soares, B. B., Canto Martins, B. L, et al.2007, PhyA, 384, 507
- Chandrasekhar & Münch (1950) Chandrasekhar, S. & Münch, G. 1950, ApJ, 111, 142
- Cox (2000) Cox, A. N. (ed.) 2000, Allen’s Astrophysical Quantities, (4th ed.; Berlin: Springer) 390
- de Freitas & De Medeiros (2013) de Freitas, D. B., & De Medeiros, J.R. 2013, MNRAS, 433, 1789
- Deutsch (1965) Deutsch, A. J. 1965, AJ, 70, 673
- Deutsch (1970) Deutsch, A. J. 1970, in Proc. IAU Colloq., Stellar Rotation, ed. A. Slettebak, D. Reidel (Dordrecht-Holland: Kluwer) 207
- Endal & Sofia (1978) Endal A. S., Sofia S., 1978, ApJ, 220, 279
- Fukuda (1982) Fukuda, I. 1982, PASP, 94, 271
- Gaigé (1993) Gaigé, Y. 1993, A&A, 269, 267
- Guthrie (1982) Guthrie, B. N. G. 1982, MNRAS, 198, 795
- Herbst et al. (2002) Herbst, W., Bailer-Jones, C. A. L., Mundt, R. et al.2002, A&A, 396, 513
- Hollander & Wolfe (1973) Hollander, M. & Wolfe, D. A. 1973, Nonparametric Statistical Methods. New York: Wiley) 185
- Irwin & Bouvier (2009) Irwin, J., & Bouvier, J. 2009, in Proc. IAU Symp. 258, The Ages of Stars, ed. E. E. Mamajek, D. R. Soderblom, & R. F. G. Wyse (Dordrecht-Holland: Kluwer), 363
- Kharchenko et al. (2005) Kharchenko, N. V., Piskunov, A. E., Röser, S., et al.2005, A&A, 438, 1163
- Kawaler (1988) Kawaler, S. D. 1988, ApJ, 333, 236
- Königl (1991) Königl, A. 1991, ApJL, 370, L39
- Masahiro et al. (2007) Masahiro N., Machida, M. N., Inutsuka, S., & Matsumoto, T. 2007, ApJ, 670, 1198
- Matt et al. (2012) Matt, S., MacGregor, K. B., Pinsonneault, M. H., & Greene, T. P. 2012, ApJ, 754, 26
- Meibom et al. (2011) Meibom, S., Barnes, S. A., & Latham, D. W., et al.2011, ApJL, 733, L9
- Meynet et al. (1993) Meynet, G., Mermilliod, J.-C., & Maeder, A. 1993, A&AS, 98, 477
- Mermilliod, Mayor & Udry (2009) Mermilliod, J.–C., Mayor, M. & Udry, S. 2009, A&A, 498, 949
- Nadaraya (1964) Nadaraya, E. A. 1964, Theory Prob. Appl., 9, 141
- Pinsonneault et al. (1990) Pinsonneault, M. H., Kawaler, S. D., & Demarque, P. 1990, ApJS, 74, 501
- Plastino & Plastin (1993) Plastino, A. R., Plastino, A. 1993, PhLA, 174, 384
- Qin et al. (1998) Qin, Yi-Ping, Xie, G. Z., Zheng, Xue-Tang, Wu, Shi-Min 1998, A&AS, 132, 301
- Queloz et al. (1998) Queloz, D., Allain, S., Mermilliod, J.-C., Bouvier, J. et al.1998, A&A, 335, 183
- Santoro (2010) Santoro, L. 2010, in EAS Publications Series, Vol. 45, Gaia: at the frontiers of astrometry, ed. C. Turon, F. Meynadier, & F. Arenou (Les Ulis: EDP Sciences), 257
- Scholz (2009) Scholz, A. 2009, in AIP Conf. Proc. 1094, Cool stars, Stellar Systems and the Sun, ed. E. Stempels (Melville, NY: AIP), 61
- Scholz & Eislöffel (2007) Scholz, A., & Eislöffel, J. 2007, MNRAS, 381, 1638
- Scholz & Stephens (1987) Scholz, F. W. & Stephens, M. A. 1987, J. Am. Stat. Assoc., 82, 399, 918
- Scott (1992) Scott, D. W. 1992. Multivariate Density Estimation: Theory, Practice, and Visualization (New York: Wiley), 152
- Shu et al. (1994) Shu, F., Najita, J., Ostriker, E., et al.1994, ApJ, 429, 781
- Siess & Livio (1999) Siess, L. & Livio, M. 1999, MNRAS, 304, 925
- Silva et al. (2006) Silva, R., Alcaniz, J. S., França, G. S. et al.2006, PhRvE, 73, 26102
- Skumanich (1972) Skumanich, A. 1972, ApJ, 171, 565
- Soares et al. (2006) Soares, B. B., Carvalho, J. C., do Nascimento, Jr., J. D. & De Medeiros, J. R. 2006, PhyA, 364, 413
- Soares & Silva (2011) Soares, B. B. & Silva, J. R. P. 2011, EL, 96, 19001
- Spada et al. (2011) Spada, F., Lanzafame, A. C., Lanza, A. F. et al.2011, MNRAS, 416, 447
- Stariolo (1993) Stariolo, D.A. 1993, PhLA, 185, 262.
- Tomisaka (2000) Tomisaka, K. 2000, ApJL, 528, L41
- Tsallis (1988) Tsallis, C. 1988, JSP, 52, 479
- Watson (1964) Watson, G. S. 1964, Sankhya A, 26, 359
- Wilk & Wlodarcsyk (2000) Wilk, G. & Wlodarcsyk, Z. 2000, PhRvL, 84, 2770
- Zahn (1977) Zahn, J.–P. 1977, A&A, 57, 383