The changing Ly optical depth in the range from MOSFIRE spectroscopy of Y-dropouts
Abstract
We present MOSFIRE spectroscopy of 13 candidate galaxies selected as Y-dropouts as part of the BoRG pure parallel survey. We detect no significant Ly emission (our median 1 rest frame equivalent width sensitivity is in the range 2-16Å). Using the Bayesian framework derived in a previous paper, we perform a rigorous analysis of a statistical subsample of non-detections for ten Y-dropouts, including data from the literature, to study the cosmic evolution of the Ly emission of Lyman Break Galaxies. We find that Ly emission is suppressed at by at least a factor of three with respect to continuing the downward trend found by previous studies of -dropouts at . This finding suggests a dramatic evolution in the conditions of the intergalactic or circumgalactic media in just 300 Myrs, consistent with the onset of reionization or changes in the physical conditions of the first generations of starforming regions.
Subject headings:
galaxies: evolution — galaxies: high-redshift1. Introduction
In the past few years our knowledge of the first galaxies has increased stupendously. Deep imaging surveys with the Hubble Space Telescope have pushed the frontier of Lyman Break galaxies (LBGs) beyond redshift reaching into the epoch of cosmic reionization (e.g., Bouwens et al., 2010; Ellis et al., 2013; Robertson et al., 2013; Coe et al., 2013). The luminosity function of LBGs appears to evolve rapidly, with a decrease in the number density of observed galaxies, but with faint end slopes getting steeper (e.g., Bradley et al., 2012; Oesch et al., 2013). Similarly, narrow band surveys on large ground based telescopes have enabled searches for Ly emission yielding many candidate galaxies at comparably high redshift (hereafter Ly emitters, LAE). These studies indicate that the amount of ionizing photons from these galaxies is sufficient to keep the universe ionized, only if the luminosity function extends to very faint magnitudes and the ionizing fraction is high (Trenti et al., 2010; Lorenzoni et al., 2011).
Spectroscopic follow-up is key to further our understanding of the physics of the first galaxies, their interactions with the surrounding intergalactic medium, and their role in cosmic reionization. Even though spectroscopic follow-up of LBGs has been very successful out to , progress has been slower beyond this threshold. Several studies have shown that at Ly emission appears to be significantly reduced with respect to , consistent with a rapid rise in the fraction of neutral hydrogen in the immediate surroundings of these galaxies, possibly a smoking gun that we have reached the tail-end of cosmic reionization (Kashikawa et al., 2006; Fontana et al., 2010; Pentericci et al., 2011; Schenker et al., 2012; Ono et al., 2012; Treu et al., 2012).
Beyond , galaxies remain enshrouded in mystery, at least from a spectroscopic point of view. Confirmation of LBGs and even of some LAEs remain elusive (Lehnert et al., 2010; Bunker et al., 2013; Jiang et al., 2013; Capak et al., 2013). This stems in part from technological limitations as Ly is redshifted into the near infrared where traditionally spectrographs did not have the sensitivity and multiplexing capabilities of their optical counterparts (see, e.g., Schenker et al., 2012; Treu et al., 2012).
We present here deep spectroscopic observations of a sample of 13 galaxies selected as Y-band dropouts as part of the Brightest of Reionization Galaxies (hereafter BoRG Trenti et al., 2011; Bradley et al., 2012), using the new MOSFIRE (McLean et al., 2008; McLean et al., 2012) spectrograph on the Keck-I Telescope. The combination of BoRG and MOSFIRE is extremely powerful for the study of the universe. The wide-area search of BoRG allows us to find the brightest candidate galaxies, which also happen to be clustered (Trenti et al., 2012) in the sky and are therefore ideal targets for the multiplexing capabilities of MOSFIRE.
No Ly emission is detected down to median limiting fluxes of erg s-1cm-2 (5), whereas a few detections would have been expected if the distribution of Ly emission had been the same as at (Treu et al., 2012). We use the statistical framework developed by Treu et al. (2012) to perform a rigorous analysis of the non-detections, taking into account all the available information, and show that they imply a significant increase in the Ly optical depth between and .
All magnitudes are given in the AB system and a standard cosmology with , and is assumed.
2. Observations and Data Reduction
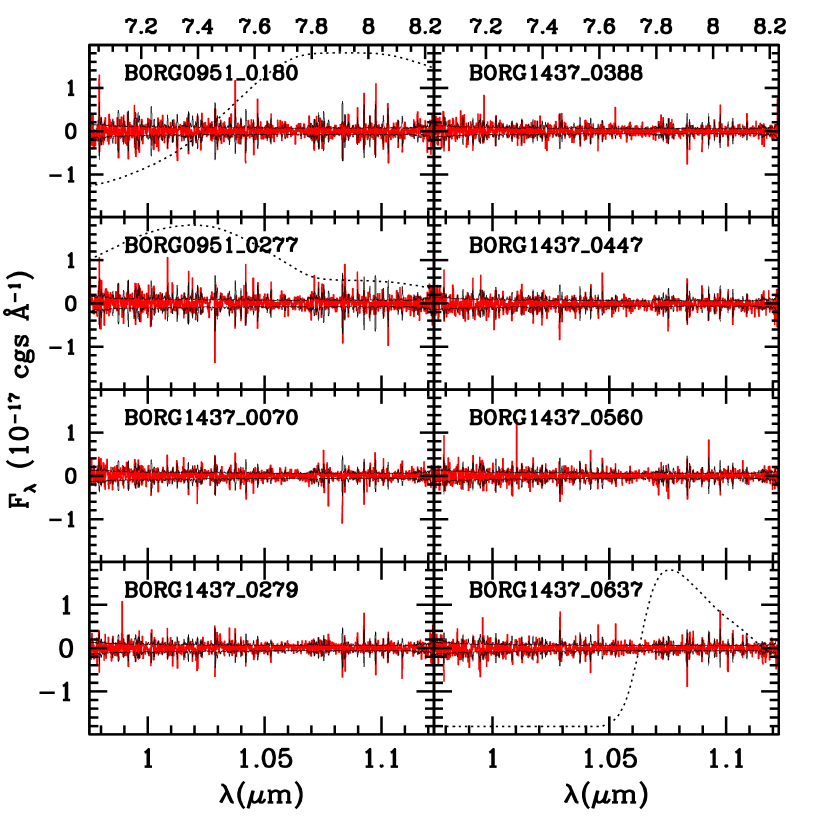
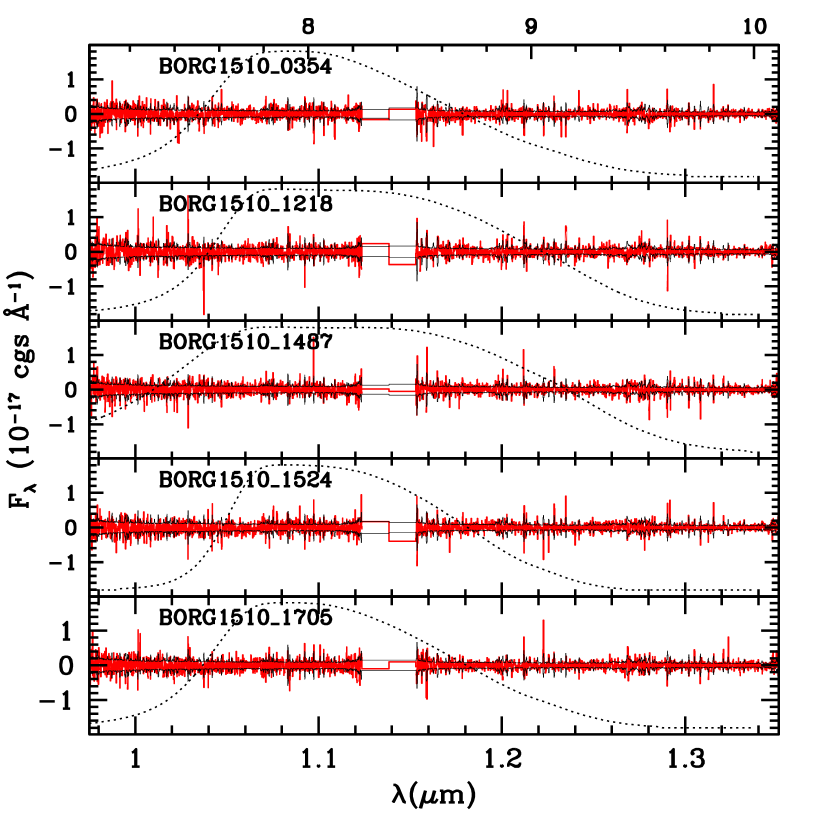
The spectroscopic targets were selected from BoRG as Y-band dropouts, i.e. galaxy candidates, using Hubble Space Telescope (HST) data taken in the WFC3 bands F600LP/F606W, F098M, F125W, and F160W as described by Bradley et al. (2012) and Schmidt et al. (2013; in preparation). The spectroscopic sample presented here consists of 13 individual targets, from 3 of the 71 BoRG fields, namely BoRG_0951+3304, BoRG_1437+5043, and BoRG_1510+1115, selected to contain a large number of high-quality candidates. The primary statistical sample consists of 8 dropouts detected at high-significance (5 in the primary detection band, plus all the color requirements) as described by Schmidt et al. (2013; in preparation). Photometric redshifts for the sources in the primary sample are shown as dashed black curves in Figures 1 and 2. We took advantage of the multi-slit capabilities of MOSFIRE (McLean et al., 2012) to observe 5 marginal candidates. For completeness we present results from these 5 marginal objects but do not consider them in our statistical analysis.
The near-infrared spectroscopic data presented here were obtained with MOSFIRE on Keck-I during two nights (25-26 April 2013), in good weather with subarcsecond seeing and clear transparency. We used slit widths of and a nodding amplitude of . BoRG_0951+3304, BoRG_1437+5043 were observed in the Y-band, whereas BoRG_1510+1115 was observed both in the Y and J bands. Table 1 summarizes exposure times. The spatial resolution is per pixel and the dispersion is 1.0855 and 1.3028 Å/pixel in Y and J respectively. The spectral coverage is shown in the Figures.
The data were reduced using the publicly available MOSFIRE data reduction pipeline (DRP111http://code.google.com/p/ mosfire/). The output of the DRP are non-calibrated 2D spectra in units of electrons per second per pixel. From the 2D spectra, 1D spectra were extracted by using a 11 pixel-wide extraction aperture centered on the position of the target. The extracted 1D spectra were corrected for telluric absorption using observations of the nearest V8 A0V Hipparcos star, for galactic extinction using the Cardelli et al. (1989) extinction law with , and airmass. The absolute flux calibration was obtained from 3 bright objects () with known HST magnitudes which were also observed in the MOSFIRE masks simultaneously with the dropouts, calculating slit losses based on the HST images. Each night of observations was reduced separately combining only the final spectral products at the very end. The final calibrated spectra are shown in Figures 1 and 2 and are consistent with noise. The sensitivity is consistent with that estimated by the MOSFIRE Exposure Time Calculator.
The non-detections allow us to rule out the possibility that the sources in BoRG_1510+1115 are lower redshift contaminants where the HST continuum flux comes from emission lines like [O II] and [O III] or [O III] and H (Atek et al., 2011). However, if the continuum magnitude in F125W were due to an emission line, it would correspond to erg s-1cm-2, detectable with our median sensitivity of 0.4-0.6 in the same units (5-). Similarly, our sensitivity is sufficient to exclude contamination by red galaxies where a weaker line in J enhances the break as suggested by Capak et al. (2011). The exception would be for the fields with only Y coverage if weak [O III] fell beyond 1.1238m () but within the F125W filter, while H accounted for the flux in F160W. Longer wavelength coverage with MOSFIRE is needed to rule out this possibility.
| Object | V606 | Y098 | J125 | H160 | Stat. | /hr | /Å | ||
|---|---|---|---|---|---|---|---|---|---|
| 0951+3304_0180 | 147.70451 | 33.06513 | 26.83 | 26.83 | 26.24 0.27 | 26.56 0.43 | 1 | 1 | 4.1 |
| 0951+3304_0277 | 147.68443 | 33.07019 | 26.83 | 26.83 | 25.87 0.22 | 25.88 0.27 | 1 | 1 | 3.0 |
| 1437+5043_r2_0637_T12a | 219.21058 | 50.72601 | 28.10 | 28.05 | 25.76 0.07 | 25.69 0.08 | 1 | 3 | 2.1 |
| 1510+1115_0354 | 227.54706 | 11.23145 | 27.59 | 27.83 | 27.03 0.22 | 27.21 0.38 | 1 | 2.1, 3 | 9.3 |
| 1510+1115_1218 | 227.54266 | 11.26152 | 27.59 | 27.83 | 26.87 0.22 | 26.64 0.25 | 1 | 2.1, 3 | 8.6 |
| 1510+1115_1487 | 227.53173 | 11.25254 | 27.59 | 27.83 | 27.60 0.24 | 27.34 0.28 | 1 | 2.1, 3 | 15.7 |
| 1510+1115_1524 | 227.53812 | 11.25552 | 27.59 | 27.83 | 26.63 0.15 | 26.52 0.20 | 1 | 2.1, 3 | 6.6 |
| 1510+1115_1705 | 227.54008 | 11.25111 | 27.59 | 27.83 | 27.00 0.19 | 27.02 0.28 | 1 | 2.1, 3 | 9.2 |
| 1437+5043_r2_0070_T12e | 219.22225 | 50.70808 | 28.10 | 28.05 | 26.90 0.14 | 26.94 0.17 | 0 | 3 | 6.0 |
| 1437+5043_r2_0388 | 219.23494 | 50.71960 | 28.10 | 28.05 | 27.66 0.24 | 27.84 0.36 | 0 | 3 | 11.5 |
| 1437+5043_r2_0560_T12c | 219.23092 | 50.72405 | 27.92 0.31 | 28.05 | 27.73 0.23 | 27.47 0.24 | 0 | 3 | 12.4 |
| 1437+5043_r3_0279 | 219.18681 | 50.72723 | 27.94 | 27.82 | 27.27 0.24 | 27.46 0.34 | 0 | 3 | 8.4 |
| 1437+5043_r3_0447 | 219.18983 | 50.73406 | 27.94 | 27.82 | 27.63 0.27 | 27.79 | 0 | 3 | 12.3 |
Note. — Photometry is taken from the most recent analysis by Schmidt et al. (2013; in preparation). and has been corrected for Galactic extinction using the Cardelli et al. (1989) extinction law and E(B-V) of 0.01328, 0.01254, and 0.04605 for BoRG_0951+3304, BoRG_1437+5043 and BoRG_1510+1115 respectively. The candidates in the field 1437+5043 were identified by Trenti et al. (2012) and Bradley et al. (2012). The magnitude limits are 2 limits. The candidates in the first part of the table (Stat=1) statisfy all the requirements for Y-dropout selection and are the statistical sample analyzed in this paper. The candidates below the horizontal bar (Stat=0) were observed as slit fillers. The /hr give the total exposure time in (, ). The last column lists the median Ly equivalent width noise (1) of the MOSFIRE spectra.
3. Inferences on the Ly- Optical depth
3.1. Summary of the method
We apply the method introduced by Treu et al. (2012) to constrain the distribution of equivalent width of Ly- given a sample of LBGs, exploiting all the information available. Only a brief summary of the method is given here. The reader is referred to Treu et al. (2012) for details and analytic expressions of the likelihood.
As in our previous work we describe the intrinsic rest-frame distribution in terms of the one measured at by Stark et al. (2011)
| (1) |
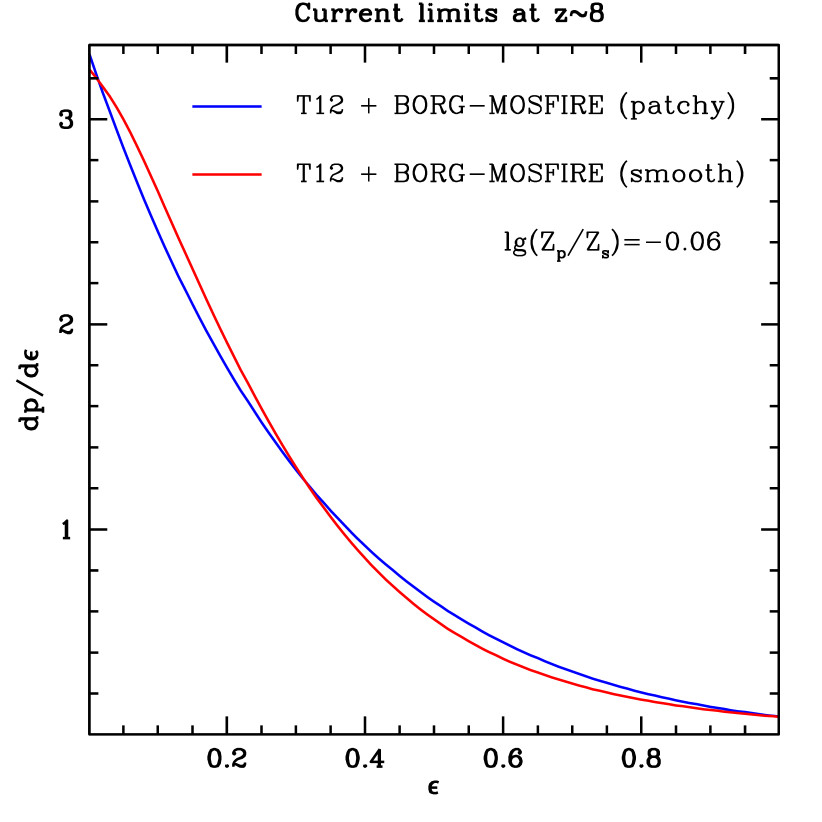
with Wc=47Å, A=0.38 for sources with and Wc=47Å, A=0.89 for sources with . A is the fraction of emitters and is the step function. As discussed below, 1-A includes the fraction of interlopers. Following Treu et al. (2012) we consider two extreme cases which should bracket the range of possible scenarios. In the first (“patchy”) model, no Ly is received from a fraction of the sources, while the rest is unaffected. The probability distribution of the equivalent width is then given by
| (2) |
In the second (“smooth”) model, Ly is attenuated by a factor , yielding
| (3) |
Bayes’s rule gives the posterior probability of and (collectively ) and given an observed spectrum and continuum magnitude :
| (4) |
where the term within square brackets is the likelihood p({f},,m), are the flux measurements in each spectral pixel and . We adopt a uniform prior p() between zero and unity, while the prior p() is given by the photometric redshift. By construction our method takes into account the strong wavelength dependence of the sensitivity typical of near infrared spectroscopic data. The inference is carried out for each spectral pixel, using its noise properties including the effects of atmospheric transmission and absorption.
The posterior on is obtained by summing over in the range where p() is non-zero. Our formalisms takes properly into account the effects of incomplete wavelength coverage, in deriving limits on and . For example, if the wavelength range only covers an interval [,], and the prior on is uniform, then the posterior will be:
| (5) |
The normalization factor is the Bayesian evidence and quantifies how well the model describes the data. It can be used for selection, by comparing evidence ratio between two models, or to decide whether additional parameters are warranted by the data. In comparison to other standard model selection techniques like likelihood ratio the avdantage of the evidence is that it takes into account the entire parameter space, thus avoiding issues of fine tuning.
The formalism described above is for an individual galaxies. For a sample of galaxies, or for multiple independent spectra of the same galaxies, it is sufficient to multiply the likelihoods to obtain the total likelihood.
3.2. Results
The key result of this paper is the posterior probability densities of the and parameters given the data, shown in Figure 3. This posterior probability distribution function is based on the 8-non detections of the primary sample presented here, plus the three non-detections presented by Treu et al. (2012) and Schenker et al. (2012) 222BORG11534, A1703_zD7 and BORG58, The latter is also part of the MOSFIRE sample presented here, so the total number of objects is 10, with one having two independent observations with different wavelength coverage and sensitivity.. The non-detections imply that Ly emission is suppressed significantly between and . The 68% credible intervals, obtained by integrating the posterior are and , i.e. Ly emission from LBGs is less than a third than the value at . The parameters and can be physically interpreted as the average excess optical depth of Ly- with respect to , i.e. . As expected for a sample of non-detections, the data are insufficient to distinguish between the two models. We will thus refer primarily to the patchy model, for easier comparison with previous work (this is the model implicitly assumed by Fontana et al., 2010; Pentericci et al., 2011; Ono et al., 2012; Schenker et al., 2012).
Before discussing the interpretation of our findings we need to consider the role of contamination. The parameter relates the number of LBG selected galaxies with Ly emission at to the same quantity at . In order to transform this into a Ly optical depth, one has to account for the fraction of contaminants in both samples
| (6) |
where and are the fraction of contaminants in the and LBG selected samples, respectively. A simple estimate of the number of contaminants can be obtained from the posterior probability distribution functions of the photometric redshifts and by computing the total probabilities that the source is outside the fiducial window. This probability is low and does not change our conclusions in any significant way: Stark et al. (2011) estimate with this method, while for our method it is in the range 0.1-0.2 and already taken into account by our formalism as described by Treu et al. (2012). A more insidious form of contaminants is represented by the “unknown unknowns”, like the faint emission line objects discussed above.
In the case of BoRG this additional contribution is estimated to be , (bringing the total to 0.33-0.42 Bradley et al., 2012). In the case of the i-dropouts selected from GOODS (Stark et al., 2011), the additional contamination is probably somewhat less, given the higher quality of the dithering strategy and larger number of blue bands available. To be conservative we thus consider the ratio to be in the range 1-1.25, that is from equal contamination – after accounting for known losses inferred from photo-s – to higher contamination in the sample.
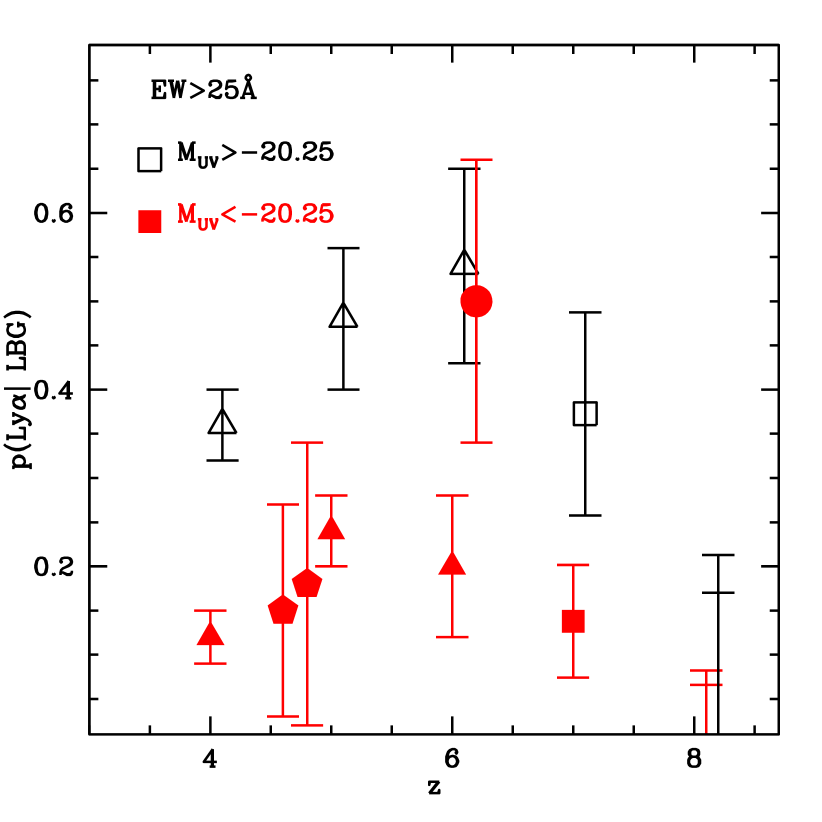
With this estimate in hand we can proceed to compute the fraction of LBGs with Ly emission above the standard threshold of 25Å equivalent width. Our measurement at is shown in Figure 4 together with data from the literature at lower redshift (see caption). In the patchy model, the fractions for Y-dropouts are for galaxies with and for galaxies fainter than this limit (the two numbers are for minimal and maximal contamination). In the smooth model the same fractions are and . Note that these bounds include the uncertainty on the fraction and thus the uncertainties on the points beyond are correlated. If the fractions at move up/down, so do the points at higher redshift, but the trend will remain the same. Even considering the more conservative upper limits from the patchy model, the drop in the fraction of Ly emitters amongst LBG in just 300 Myrs is at least a factor of .
There are three possible explanations for our finding, ranging from the mundane to the very interesting. The first and most mundane explanation is that samples of Y-dropouts suffer from much higher rate of contamination than similar LBG samples at lower redshift. A breakdown of the Lyman Break technique could occur if there were exotic populations of galaxies which are missing from our current templates and models used to estimate color-cuts and compute photo-s. While this cannot be ruled out with present data, it would certainly be a surprise to see the Lyman Break selection breaking down so abruptly over a relatively small change in wavelength and magnitudes. The second explanation could be related to the special environment of the BoRG galaxies. As expected for the most luminous galaxies at every redshift, the BoRG sources are bright and strongly clustered, especially those that we selected for spectroscopic follow-up (Hildebrandt et al., 2009; Overzier et al., 2009). Thus, we may be comparing galaxies in proto-clusters with field galaxies, and perhaps this could bias our interpretation. However, we expect the higher density regions to completely reionize earlier and therefore to have a smaller Ly optical depth, not larger (Barkana & Loeb, 2004). Thus this second explanation of the large Ly optical depth at as the result of a selection bias would also be surprising. The third explanation is that indeed the average Ly optical depth of the universe increases significantly in this small amount of cosmic time. This third explanation would be very exciting, implying that we have reached an epoch where the properties of the intergalactic and circumgalactic medium (IGM and CGM, respectively) are changing dramatically, presumably owing to rapid changes in the degree of cosmic reionization or in the physics of the first generations of star forming regions.
Observationally, the big question is then how do we test these three hypothesis. Searches for Ly to greater depth than ours, would provide useful information, hopefully including detections. But also more and deeper non-detections would certainly help tighten the upper limits derived here. This is possible with longer MOSFIRE integrations or by using the WFC3 grism on board the Hubble Space Telescope. Systematic studies of many gravitationally lensed sources should be a particularly powerful way to probe very faint sources and thus also help with testing the second hypothesis (e.g., Bradač et al., 2012). However, it is probable that some fraction of LBGs at and above will remain undetected in Ly even with heroic efforts. In order to quantify the amount of contaminants and thus test the first and third hypotheses, one needs detections of other lines or of the continuum. Hopefully IR lines can be detected with pointed observations with ALMA (Carilli & Walter, 2013) although this is non-trivial (Ouchi et al., 2013). Detection of the continuum will be hard and might require several hours of integrations with the James Webb Space Telescope (Treu et al., 2012) or an extremely large telescope like the Thirty Meter Telescope, unless the sources are highly magnified by a foreground gravitational lens.
4. Conclusions
We present MOSFIRE observations of a sample of candidate galaxies identified as part of the BoRG Survey. The data are consistent with noise, setting stringent upper limits on the presence of emission lines. We carry out a statistical analysis of the non-detections in the context of our flexible models of purely patchy and smooth absorption showing that they imply a substantial increase in Ly optical depth between and . Quantitatively, our findings can be summarized as follows:
-
•
At the distribution of Ly- equivalent width is significantly reduced with respect to , by at least a factor of three (i.e. and respectively in the patchy and smooth model).
-
•
The fraction of emitters with equivalent width Å can be computed within our models. In the patchy model, the fractions for Y-dropouts are for galaxies with and for galaxies fainter than this limit (the two numbers are for minimal and maximal contamination). In the smooth model the same fractions are and .
These results extend out to in a more dramatic fashion the increase in Ly optical depth seen by previous studies between and (Fontana et al., 2010; Vanzella et al., 2011; Pentericci et al., 2011; Schenker et al., 2012; Ono et al., 2012; Treu et al., 2012). This body of work indicates that the properties of LBG galaxies are evolving over a very short amount of cosmic time. More spectroscopic data are needed to characterize this very interesting process further and clarify the relationship between the vanishing Ly emission and cosmic reionization.
References
- Atek et al. (2011) Atek, H., Siana, B., Scarlata, C., et al. 2011, ApJ, 743, 121
- Barkana & Loeb (2004) Barkana, R., & Loeb, A. 2004, ApJ, 609, 474
- Bouwens et al. (2010) Bouwens, R. J., Illingworth, G. D., Oesch, P. A., et al. 2010, ApJ, 709, L133
- Bradač et al. (2012) Bradač, M., Vanzella, E., Hall, N., et al. 2012, ApJ, 755, L7
- Bradley et al. (2012) Bradley, L. D., Trenti, M., Oesch, P. A., et al. 2012, ApJ, 760, 108
- Bunker et al. (2013) Bunker, A. J., Caruana, J., Wilkins, S. M., et al. 2013, MNRAS, 430, 3314
- Capak et al. (2011) Capak, P., Mobasher, B., Scoville, N. Z., et al. 2011, ApJ, 730, 68
- Capak et al. (2013) Capak, P., Faisst, A., Vieira, J. D., et al. 2013, ApJ, 773, L14
- Cardelli et al. (1989) Cardelli, J. A., Clayton, G. C., & Mathis, J. S. 1989, ApJ, 345, 245
- Carilli & Walter (2013) Carilli, C., & Walter, F. 2013, arXiv:1301.0371
- Coe et al. (2013) Coe, D., Zitrin, A., Carrasco, M., et al. 2013, ApJ, 762, 32
- Curtis-Lake et al. (2012) Curtis-Lake, E., McLure, R. J., Pearce, H. J., et al. 2012, MNRAS, 422, 1425
- Ellis et al. (2013) Ellis, R. S., McLure, R. J., Dunlop, J. S., et al. 2013, ApJ, 763, L7
- Fontana et al. (2010) Fontana, A., Vanzella, E., Pentericci, L., et al. 2010, ApJ, 725, L205
- Hildebrandt et al. (2009) Hildebrandt, H., Pielorz, J., Erben, T., et al. 2009, A&A, 498, 725
- Jiang et al. (2013) Jiang, L., Bian, F., Fan, X., et al. 2013, ApJ, 771, L6
- Kashikawa et al. (2006) Kashikawa, N., Shimasaku, K., Malkan, M. A., et al. 2006, ApJ, 648, 7
- Lehnert et al. (2010) Lehnert, M. D., Nesvadba, N. P. H., Cuby, J.-G., et al. 2010, Nature, 467, 940
- Lorenzoni et al. (2011) Lorenzoni, S., Bunker, A. J., Wilkins, S. M., et al. 2011, MNRAS, 414, 1455
- Mallery et al. (2012) Mallery, R. P., Mobasher, B., Capak, P., et al. 2012, ApJ, 760, 128
- McLean et al. (2008) McLean, I. S., Steidel, C. C., Matthews, K., Epps, H., & Adkins, S. M. 2008, Proc. SPIE, 7014,
- McLean et al. (2012) McLean, I. S., Steidel, C. C., Epps, H. W., et al. 2012, Ground-based and Airborne Instrumentation for Astronomy IV. Proceedings of the SPIE, 8446, doi:10.1117/12.924794
- Oesch et al. (2013) Oesch, P. A., Bouwens, R. J., Illingworth, G. D., et al. 2013, ArXiv e-prints, arXiv:1301.6162
- Ono et al. (2012) Ono, Y., Ouchi, M., Mobasher, B., et al. 2012, ApJ, 744, 83
- Ouchi et al. (2013) Ouchi, M., Ellis, R., Ono, Y., et al. 2013, ArXiv e-prints, arXiv:1306.3572
- Overzier et al. (2009) Overzier, R. A., Guo, Q., Kauffmann, G., et al. 2009, MNRAS, 394, 577
- Pentericci et al. (2011) Pentericci, L., Fontana, A., Vanzella, E., et al. 2011, ApJ, 743, 132
- Robertson et al. (2013) Robertson, B. E., Furlanetto, S. R., Schneider, E., et al. 2013, ApJ, 768, 71
- Schenker et al. (2012) Schenker, M. A., Stark, D. P., Ellis, R. S., et al. 2012, ApJ, 744, 179
- Stark et al. (2011) Stark, D. P., Ellis, R. S., & Ouchi, M. 2011, ApJ, 728, L2+
- Trenti et al. (2010) Trenti, M., Stiavelli, M., Bouwens, R. J., et al. 2010, ApJ, 714, L202
- Trenti et al. (2011) Trenti, M., Bradley, L. D., Stiavelli, M., et al. 2011, ApJ, 727, L39+
- Trenti et al. (2012) Trenti, M., Bradley, L. D., Stiavelli, M., et al. 2012, The Astrophysical Journal, 746, 55
- Treu et al. (2012) Treu, T., Trenti, M., Stiavelli, M., Auger, M. W., & Bradley, L. D. 2012, ApJ, 747, 27
- Vanzella et al. (2011) Vanzella, E., Pentericci, L., Fontana, A., et al. 2011, ApJ, 730, L35+