Setting the Stage for Circumstellar Interaction in Core-Collapse Supernovae II: Wave-Driven Mass Loss in Supernova Progenitors
Abstract
Supernovae (SNe) powered by interaction with circumstellar material provide evidence for intense stellar mass loss during the final years leading up to core collapse. One of the most promising energy sources for powering this mass loss is the prodigious core fusion luminosities during late stages of stellar evolution. We have argued that during and after core neon burning, internal gravity waves excited by core convection can tap into the core fusion power and transport a super-Eddington energy flux out to the stellar envelope, potentially unbinding up to of material. In this work, we explore the internal conditions of SN progenitors using the 1-D stellar evolution code MESA star, in search of those most susceptible to wave-driven mass loss. We focus on simple, order of magnitude considerations applicable to a wide range of progenitors. Wave-driven mass loss during core neon and oxygen fusion happens preferentially in either lower mass ( ZAMS) stars or massive, sub-solar metallicity stars. Roughly 20 per cent of the SN progenitors we survey can excite of energy in waves that can potentially drive mass loss within a few months to a decade of core collapse. This energy can generate a circumstellar environment with reaching AU before explosion. We predict a correlation between the energy associated with pre-SN mass ejection and the time to core collapse, with the most intense mass loss preferentially happening closer to core collapse. During silicon burning, a day long phase for our progenitor models, wave energy may inflate of the stellar envelope to s of solar radii. This suggests that some nominally compact SN progenitors (Type Ibc progenitors) will experience wave-driven radius inflation during silicon burning and will have a significantly different SN shock breakout signature than traditionally assumed. We discuss the implications of our results for the core-collapse SN mechanism, Type IIn SNe, Type IIb SNe from extended progenitors (e.g., SNe 1993j and 2011dh), and observed pre-SN outbursts in SNe 2006jc, 2009ip, and 2010mc.
Subject headings:
stars: mass loss – supernovae: generalI. Introduction
There is a large and growing body of evidence demonstrating that many supernova (SN) progenitors experience episodes of intense mass loss as late as the weeks leading up to core collapse (e.g., Foley et al., 2007; Ofek et al., 2010, 2013b; Mauerhan et al., 2013; Margutti et al., 2013). These progenitors stand in stark contrast to the canonical picture of massive stars in their final prior to explosion, that of a “frozen” stellar envelope overlying a vigorously burning, neutrino-cooled core (e.g., Kippenhahn & Weigert, 1990; Woosley et al., 2002). Direct observations of luminous outbursts that precede supernovae (SNe) like 2006jc (Foley et al., 2007; Pastorello et al., 2007), 2009ip (Margutti et al., 2013; Mauerhan et al., 2013) and 2010mc (Ofek et al., 2013b) and the unseen episodes of highly enhanced mass-loss inferred from observations of Type IIn SNe (Kiewe et al., 2012; Gal-Yam, 2012; Ginzburg & Balberg, 2012) point to dynamic conditions in the envelopes of SN progenitors as they approach explosion.
The mass-loss rates inferred, assuming SN emission powered by the interaction of the outgoing SN shock and the prior ejected mass, far exceed what is reproducible by line-driven winds, with derived rates of (e.g., Kiewe et al., 2012; Fox et al., 2013; Smith & McCray, 2007). The total circumstellar masses inferred approach tens of solar masses in the most extreme cases (e.g., Ginzburg & Balberg, 2012; Moriya & Tominaga, 2012). Several candidate mechanisms capable of generating mass loss this prodigious have been proposed, including mass loss driven by waves excited in the convective core (Quataert & Shiode, 2012, hereafter Paper I), hydrodynamic instabilities driven by vigorous convection not well-described by mixing length theory (Smith & Arnett, 2013), common envelope interaction with a close companion (Chevalier, 2012; Soker, 2013), the pulsational pair instability (Rakavy et al., 1967), and local radiation-driven instabilities in the stellar envelope (Suárez-Madrigal et al., 2013). The first two of these appear to best explain the large incidence of episodic mass-loss in the final decades leading up to core collapse (e.g. Ofek et al., 2013b); we focus on the wave-driven mass loss mechanism here.
In this paper, we address two basic questions: how much energy is available in convectively excited waves during the final evolutionary phases of massive stars? And, in which evolutionary phases can this energy escape the core and generate a pre-SN outburst? To that end, we present an investigation of the interior conditions of a suite of core collapse SN progenitor models, spanning a decade in mass, metallicities from Population III to solar, and initial rotation velocities up to 80 per cent of critical (breakup). We focus on single star evolution, although we are fully cognizant of the fact that a large fraction of massive stars are in close binaries (Sana et al., 2012).
Several aspects of the physics of wave-driven mass loss are uncertain and limit our ability to make detailed calculations and predictions (see §II & V.2). For this reason, we restrict ourselves to order of magnitude considerations throughout this study. In particular, we utilize WKB theory in evaluating wave excitation, damping, and propagation. Our goal is to identify general trends with stellar progenitor and evolutionary phase that are plausibly robust even given some of the physics uncertainties.
We begin with a summary of the wave-driving mechanism laid out in Paper I (§II) and a description of our grid of 1-D stellar progenitors (§III). In §IV, we present our investigation of SN progenitor interiors and their susceptibility to wave-driven mass loss. We discuss these results and their application to observed systems in §V and conclude by highlighting directions for future work (§V.2).
II. The wave driving mechanism
The wave-driven mass loss mechanism is discussed in detail in Paper I. In the following, we provide a brief summary of the key concepts, and update some of the relevant timescale considerations.
II.1. Convective wave excitation
In the final stages of massive stellar evolution, i.e., carbon fusion and beyond, the core of the star is cooled predominantly by thermal neutrinos (e.g., Clayton, 1984; Woosley et al., 2002). The nuclear luminosity is thus in equilibrium with the neutrino cooling, which may exceed the emergent stellar luminosity by many orders of magnitude. If each core burning phase releases by fusing of material, we expect characteristic fusion and neutrino luminosities of L⊙ for C-burning, L⊙ for Ne and O-burning, and L⊙ for Si-burning (based on burning timescales given in Table LABEL:tab:mods, and e.g., Woosley et al., 2002). In most models, the luminosities during C and Ne-fusion are in fact smaller by a factor of due to the small abundances of C and Ne left behind by the prior burning phases. The emergent radiative luminosity during these phases is roughly equal to the Eddington luminosity for electron scattering, L⊙ for core collapse SN progenitors.
Due to the different temperature dependences of the nuclear burning and neutrino emission rates, local regions within the core are convectively unstable, with convection carrying a significant fraction of the nuclear luminosity, per cent. Thus, convection may carry a luminosity that exceeds the envelope Eddington value during C-burning, and does so by many orders of magnitude during Ne burning and beyond. This convection has characteristic mach numbers of .111The stellar evolutionary calculations in this paper generally predict Mach numbers a factor of few smaller than the rough analytic estimates given in Table 1 of Paper I.
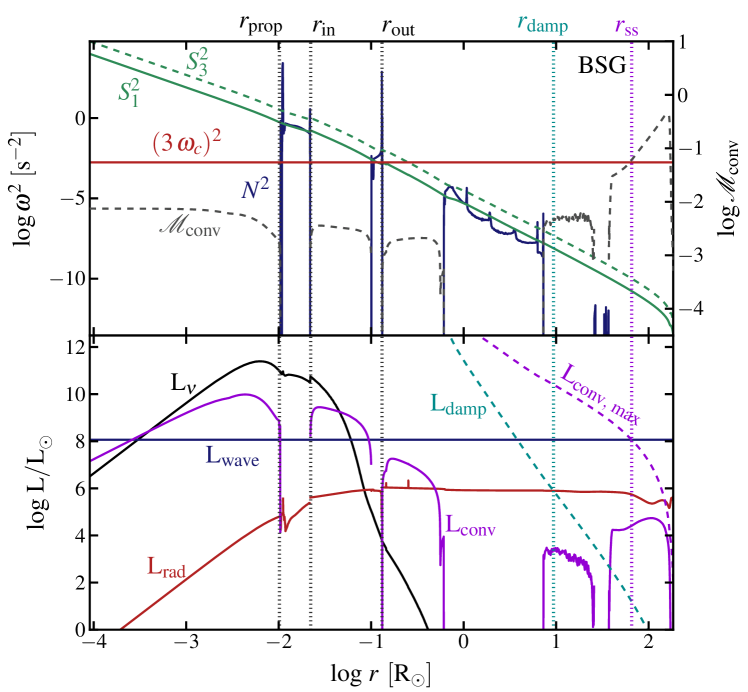
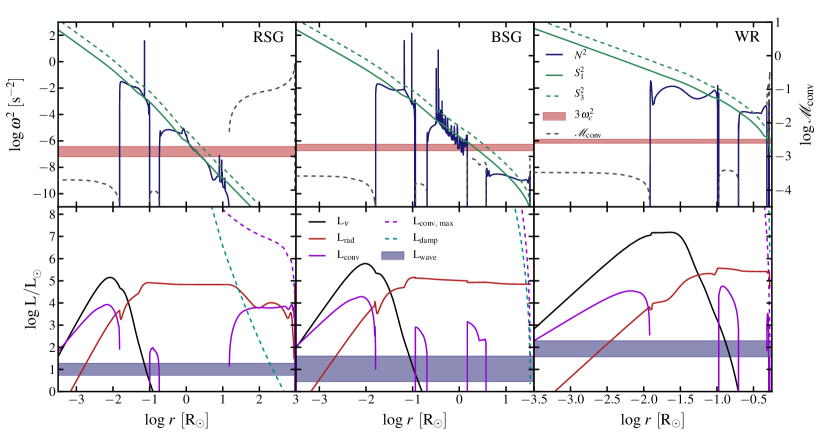
At the interfaces between these convection zones and neighboring stable regions, a radius we call , convection transfers a fraction of its luminosity to linear, propagating gravity modes (g-modes) in that layer (e.g., Press, 1981; Goldreich & Kumar, 1990; Lecoanet & Quataert, 2013). This has been seen explicitly in Meakin & Arnett (2006)’s hydrodynamic simulations of the late stages of massive stellar evolution. The top panel of Fig. 1 shows an example propagation diagram for a 40 M⊙ Z⊙ progenitor during core oxygen burning; here is the innermost labeled radius, marking the boundary between the oxygen burning core convection zone and the neighboring stably stratified layer where g-modes propagate (in which the square of the Brunt-Väisälä frequency, , is positive).
In Paper I, we used the estimate from the earlier literature that the energy flux in internal gravity waves is , where is the convective luminosity and is the convective mach number of the energy-bearing eddies (eqn. 1 from Paper I). This is, however, only appropriate for a model in which the transition between the convective and radiative zones is discontinuous (Lecoanet & Quataert, 2013). High frequency internal gravity waves have longer wavelengths in the radiative zone and thus indeed see the transition as approximately discontinuous. This is not, however, the case for the gravity modes that carry most of the wave energy flux, those with frequencies comparable to the convective turnover frequency (which have shorter wavelengths in the radiative zone). The excitation of these energy-bearing waves depends on the structure of the radiative-convective transition and thus depends on details that are not well-modeled in 1-D stellar evolution calculations. Lecoanet & Quataert (2013) argued that a smooth transition is more physical and leads to a larger energy flux than we assumed in Paper I. For a particular analytically tractable smooth model of the radiative-convective transition, they found that the wave luminosity excited by convection is
| (1) |
where there is a dimensionless pre-factor in front of eqn. 1 that depends on the properties of the radiative-convective transition. It is not possible to calculate this pre-factor with existing 1-D stellar evolution calculations. Thus we set this to 1 while noting that it could be smaller if the radiative-convective transition is very thin (i.e., closer to discontinuous).
The spectrum of waves excited by convection is also uncertain (though constraints may be forthcoming from precision observations of massive main sequence stars; see Shiode et al. 2013). In broad terms, the convection most efficiently excites waves with characteristics similar to the energy-bearing eddies (e.g. Press, 1981). Thus, the wave energy is likely concentrated in waves with characteristics similar to the energy-bearing eddies in the convection zone. These have frequencies near , where is the Brunt-Väisälä frequency in the convection zone, is the radius coordinate, is the convective velocity and is the pressure scale height; the horizontal length-scales correspond to spherical harmonic degrees .
The lowest frequency waves, those with , have non-linear amplitudes and break as soon as they reach the radiative zone (eqn. 1 gives the luminosity in linear g-modes and does not include the energy associated with these immediately non-linear waves).222Note that equation 6 in Paper I for the nonlinearity of g-modes has a typo. The factor should be . The correct expression was used for the estimates given in Paper I. Thus, in the following, we focus on the linear, propagating waves with frequencies . The g-modes are most prone to breaking near the (first) radiative-convective boundary; nonlinear damping is thus not likely to be a significant damping mechanism at larger radii, at least until the g-modes convert into acoustic waves in the stellar envelope.
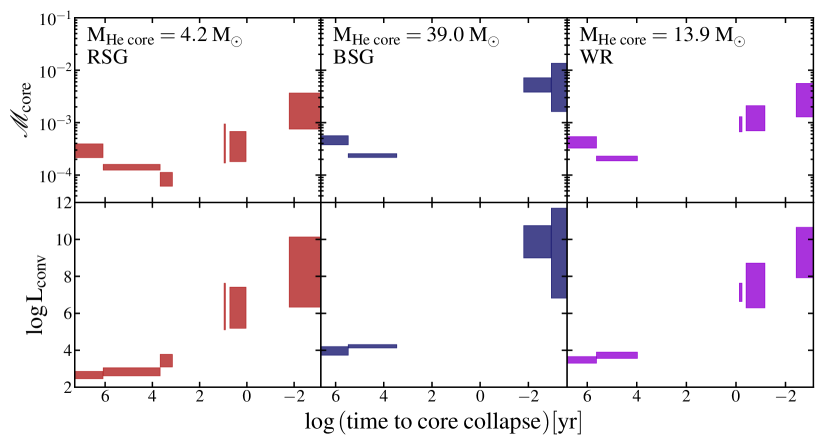
Figure 2 shows the core convective Mach number and convective luminosity as a function of time until core-collapse for three different example stellar models described in more detail in §III and Table LABEL:tab:mods. The plot covers all of stellar evolution, from core hydrogen to core silicon burning. The convective Mach number and convective luminosities peak during late stages of stellar evolution, significantly increasing the energy flux in internal gravity waves predicted by equation 1.
II.2. The fate of gravity waves: tunneling vs. neutrino losses
Convectively excited g-modes in the cores of evolved massive stars damp through one of two main channels: locally via neutrino losses or by tunneling out of the g-mode propagation cavity (we will also refer to the latter as “leakage”). Due to the highly temperature sensitive neutrino emission rates, positive (negative) temperature perturbations associated with waves lose more (less) energy via neutrino emission than the background, damping the perturbations. Nuclear fusion in the core may provide driving via an analogous, but opposite in sign, process known as the -mechanism (Murphy et al., 2004), but we ignore this contribution for simplicity. This is conservative in that we likely overestimate the wave damping rate. Leakage arises because the envelope of the star can often host acoustic waves of the same frequencies as the g-modes propagating in the core. Convectively excited g-modes can couple to the acoustic propagation cavity if they can tunnel through the intervening forbidden region (barrier) and are above the envelope’s acoustic cutoff frequency, , where is the sound speed in the stellar envelope (see e.g., Unno et al., 1989).
Larger length-scale (low ) waves decay slower through the barrier and higher frequency waves see smaller barriers (see Paper I). Thus, g-modes with these characteristics have the highest probability of tunneling, rather than damping to neutrinos. Whether a progenitor can drive mass loss by convectively excited waves depends first on the capacity for advanced convective burning to excite sufficiently high frequency and low waves to high energy.
G-modes damp primarily via tunneling if they leak faster than they damp to neutrinos:
| (2) |
where the leakage time, , is given by the group travel time across the g-mode cavity, divided by the tunneling probability333In some cases, particularly in compact progenitors, the most energetic, propagating g-modes have frequencies on the same order as the acoustic cutoff frequency in the envelope; there is likely an additional inhibiting contribution to the tunneling probability in these cases because the outer turning point is part of the thin stellar atmosphere. This correction is not accounted for here.:
| (3) |
and the group travel time is given by
| (4) |
where , is the g-mode group velocity in the radial direction, is the inner radius of the tunneling region (outer edge of the g-mode propagation cavity) and is the outer radius of the tunneling region (inner edge of the p-mode propagation cavity; see Fig. 1 for the locations of these radii for an example mode). The neutrino damping time is set by the characteristic time for neutrino losses in the g-mode propagation cavity, enhanced by the temperature sensitivity of the neutrino losses:
| (5) |
where is the internal energy per unit mass for the stellar material, is the neutrino energy loss rate per unit mass, , and for neutrino losses due to pair-annihilation.
The size of the g-mode propagation cavity, to , is roughly independent of frequency for the frequencies of convectively excited g-modes (see Fig. 1), fixing the approximate neutrino damping timescale given in eqn. 5. The leakage timescale, on the other hand, depends strongly on the width of the tunneling region, and the rate at which waves decay through the barrier. Both decline with decreasing , while the former also declines with increasing wave frequency.
Equation 3 was derived under the WKB assumption, wherein the waves are assumed to vary on lengthscales much shorter than the background. For many of the compact progenitor models we survey here (i.e. WR stars), this assumption is invalid in the envelope (acoustic propagation cavity) for the frequencies of convectively excited g-modes. Equivalently, these modes have frequencies below the acoustic cutoff for the stellar envelope and are likely reflected before reaching that cavity. In the following, we consider waves with as precluded from tunneling.
There may be an additional suppression of the tunneling probability due to composition barriers present at the interfaces of convective and radiative zones, which can introduce variations on lengthscales shorter than the wavelength. The width and magnitude of these barriers depends sensitively on the treatment of mixing and convective boundaries. We do not attempt to account for these here, but acknowledge that it is an uncertainty in our calculation.
II.3. Acoustic waves and mass loss
Waves that satisfy eqn. 2 and have frequencies above the acoustic cutoff frequency in the envelope tunnel out to the stellar envelope, where they may be carrying a significantly super-Eddington luminosity as acoustic waves. In the envelope, these waves damp either when the radiative damping timescale becomes comparable to the wave travel time or when the wave reaches non-linear amplitudes: (see Paper I). The former condition can be represented as
| (6) |
where is the mass density and is the wavenumber of the propagating acoustic wave. By contrast, sound waves reach non-linear amplitudes when
| (7) |
In the following, we call the location where waves satisfy eqn. 6 and where they satisfy eqn. 7 (where the “ss” is short for “supersonic”). The bottom panel of Fig. 1 demonstrates the locations of these radii, based on eqns. 6 and 7, for an example mode.
Except in some compact progenitors, waves reach eqn. 6 first, deeper in the star, after traveling on the sound crossing time, , from to . The sound crossing time is generally short enough to be unimportant. At , the wave energy damps by radiative diffusion and creates a local region with a significantly super-Eddington flux. In order to drive an outflow, the deposited wave energy must at a minimum reach , where even cannot carry the total luminosity. If is in an envelope convection zone, energy moves quickly outward on a timescale
| (8) |
If, instead, is in a stably stratified radiative zone, the deposited energy must heat the local material enough to drive convection (see, e.g., Piro & Chang 2008 for a detailed discussion of the physics of time-dependent convection zones in the context of Type Ia SN progenitors). This occurs on a (generally much longer) timescale
| (9) |
where the terminal radius, , and is the base of a pre-existing envelope convection zone (if one exists). If there is a pre-existing convection zone, the wave energy need only heat enough material to extend the convection zone down to . If there is not one, or , the wave energy must heat all the material between and to potentially drive an outflow. This of course depends sensitively on the details of how the convection zone grows; it might in fact grow more quickly by entrainment (as described in e.g., Arnett et al., 2009). We use eqn. 9 in the following as it represents a conservative estimate of the timescale for energy to reach after damping at .
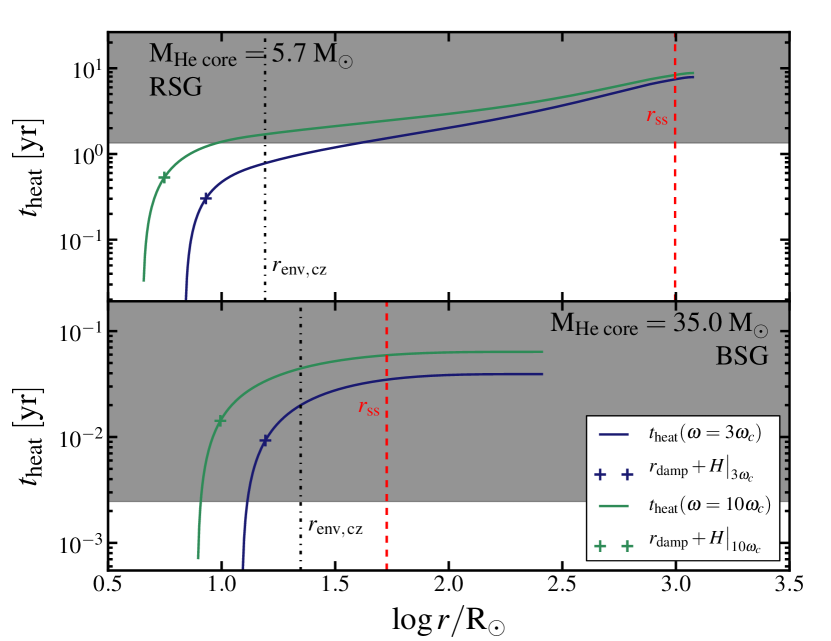
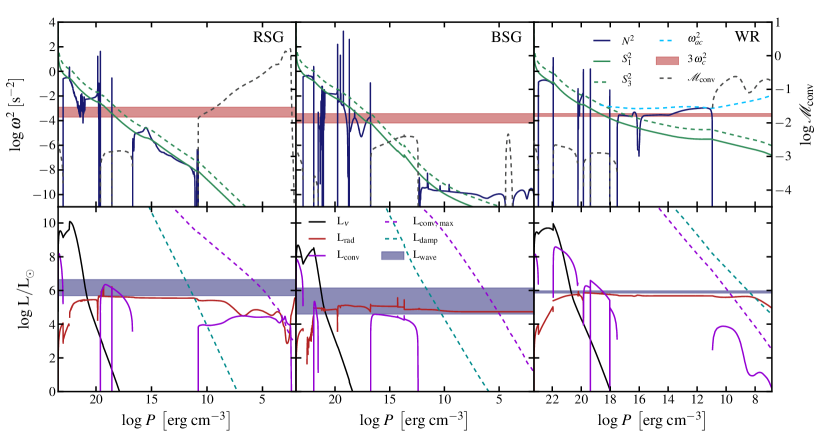
To illustrate the importance of the heating timescale in determining the effect of the dissipated wave energy, Figure 3 shows as a function of radius for two models during core oxygen fusion. In the upper panel, the timescale to heat the stellar envelope out to the pre-existing envelope convection zone (; vertical dash-dot line) is less than the time to core collapse (shown by the shaded grey region) and thus the dissipated wave energy can be efficiently carried to the stellar surface where it can plausibly power an outflow. In the lower panel, however, the timescale to heat the envelope out to the pre-existing envelope convection zone is significantly longer than the time to core-collapse, likely precluding the wave energy from having a significant effect on the stellar structure prior to core collapse.
Convection necessarily fails to carry the energy at , where the total luminosity exceeds . At this point, even convection cannot carry the total luminosity. This can result in a strong pre-SN outflow, so long as , and are all shorter than the time to core collapse. In compact progenitors where convectively excited waves have frequencies above the envelope acoustic cutoff, waves sometimes reach eqn. 7 first. In this case, the heating timescale is invariably quite short and the wave energy potentially drives a strong outflow on roughly the sound travel time to the stellar surface.
For progenitors in which wave energy can reach prior to core collapse, we assume that this leads to an outflow and estimate the mass loss rates and total potential ejecta mass for the given burning phase as follows. At , convection is required to carry the outgoing flux; thus represents a sonic point in a potential outflow. The mass loss rate for this outflow will be
| (10) |
Since at , the kinetic energy of the proposed outflow, , will exceed the wave luminosity so long as , which it must be for bound stellar material. Thus, the outgoing wave luminosity cannot energetically sustain an outflow with the full implied by the sonic point arguments; the star is in a regime analogous to the “photon-tired” wind discussed by Owocki et al. (2004). This could lead to inflation of the envelope to larger radii (as argued by Soker 2013). However, we view this as unlikely because the total wave energy deposited at generally exceeds the binding energy of the star at . Thus, we suspect that an outflow with a smaller than given in equation 10 is the most likely outcome. Owocki et al. (2004) also argue for the latter, positing the development of a porous atmosphere in the presence of super-Eddington luminosities. This provides low density channels out of which radiation can flow and drive a lower density wind. The true outcome of this super-Eddington energy deposition clearly depends on multi-dimensional effects, which will need to be examined using hydrodynamical models. These are, however, beyond the scope of this work.
In this “photon-tired” regime, we very roughly estimate the ejecta mass by assuming that the wind taps into the full wave luminosity via a lower outflow:
| (11) |
The corresponding mass loss rate is
| (12) |
where is the timescale for the relevant burning phase that generates used in eqn. 11. We note that our analysis more robustly predicts than either or since the latter depend on both how the wave energy powers an outflow and the associated speed of the outflow.
III. Stellar Models
We use the MESA star444http://mesa.sourceforge.net/ stellar evolution code (version 4789; Paxton et al., 2011) to construct evolutionary sequences from the zero-age main sequence (ZAMS) to core collapse for SN progenitors ranging in initial mass from 12 to 100 M⊙, metallicity from 0 (i.e., Population III) to solar, and initial angular velocities from 0 to 0.8 critical (see Appendix A for more details on the MESA star parameters we employ). Paxton et al. (2013) provides updated, detailed descriptions of the stellar evolution physics and numerical scheme employed by MESA star. Thus, we provide only a brief summary of the key aspects of our specific calculations, and refer the reader to that comprehensive work for details.
All models employ the Grevesse & Sauval (1998) chemical mixture, OPAL opacities (Rogers & Iglesias, 1992), and updated nuclear reaction parameters for the (Kunz et al., 2002), (Imbriani et al., 2005), and triple-alpha (Fynbo et al., 2005) reactions.
We determine convective boundaries using the Ledoux criterion, with a mixing length parameter , semiconvection with a dimensionless efficiency parameter, , and thermohaline mixing with efficiency, . On the main sequence, we use 33.5 per cent of a pressure scale height of overshoot above the convective core555We use a step function overshoot prescription, in which the convection zone is extended a distance of 33.5 per cent of a pressure scale height above the Ledoux boundary, with a constant diffusion coefficient., following the results of Brott et al. (2011). Beyond the main sequence, we ignore overshoot for simplicity.
For the majority of our calculations, we assume the theoretical mass loss rates of Vink, de Koter, & Lamers (2001) when and de Jager et al. (1988) when , each scaled down by a dimensionless efficiency factor of for non-rotating models (“0.8 (v+dj)”) and for rotating models (“0.6 (v+dj)”). For rotating models, the mass-loss rate is allowed to increase above this prescription by up to a factor of ten, in order to expel any surface layers whose rotation would be super-critical (see Paxton et al. 2013 for a more thorough description). In order to test the effect of the mass loss prescription on the results, we also include calculations for high mass, solar metallicity progenitors, where we use the Nieuwenhuijzen & de Jager (1990) rates for and a dimensionless efficiency factor of (“v+n”); this more closely matches the prescription described in Woosley et al. (2002).
For rotating progenitors, we employ compositional mixing and angular momentum transport via all magnetohydrodynamic (MHD) instabilities available in version 4789 of MESA star, except that we follow Paxton et al. (2013) and ignore the Solberg-Hoiland contribution to the convective instability criterion. The magnetic field is assumed to arise via the Spruit-Tayler dynamo (Spruit, 2002). In detail, we do not believe that the angular momentum transport processes in stellar interiors are well understood. We include the rotating progenitor models to give an order-of-magnitude indication of how different single star evolution outcomes can be when stellar rotation is included.
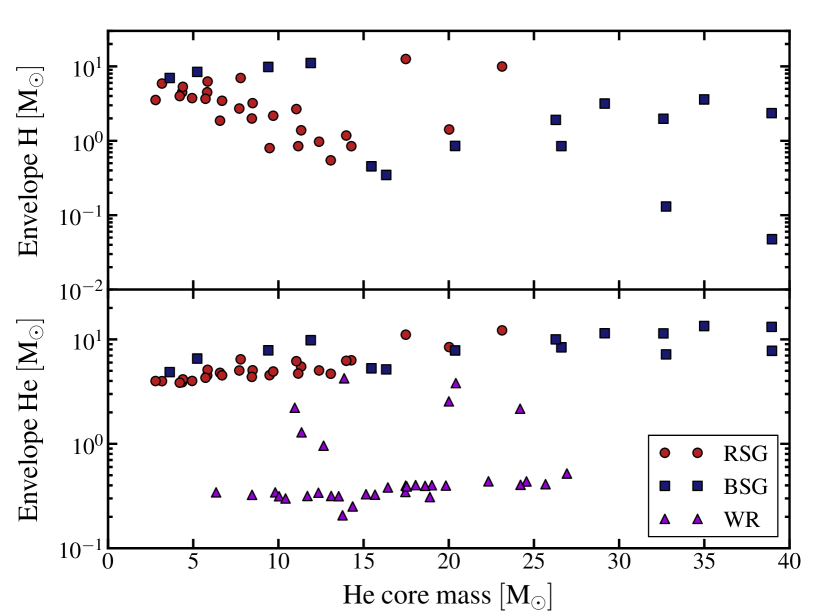
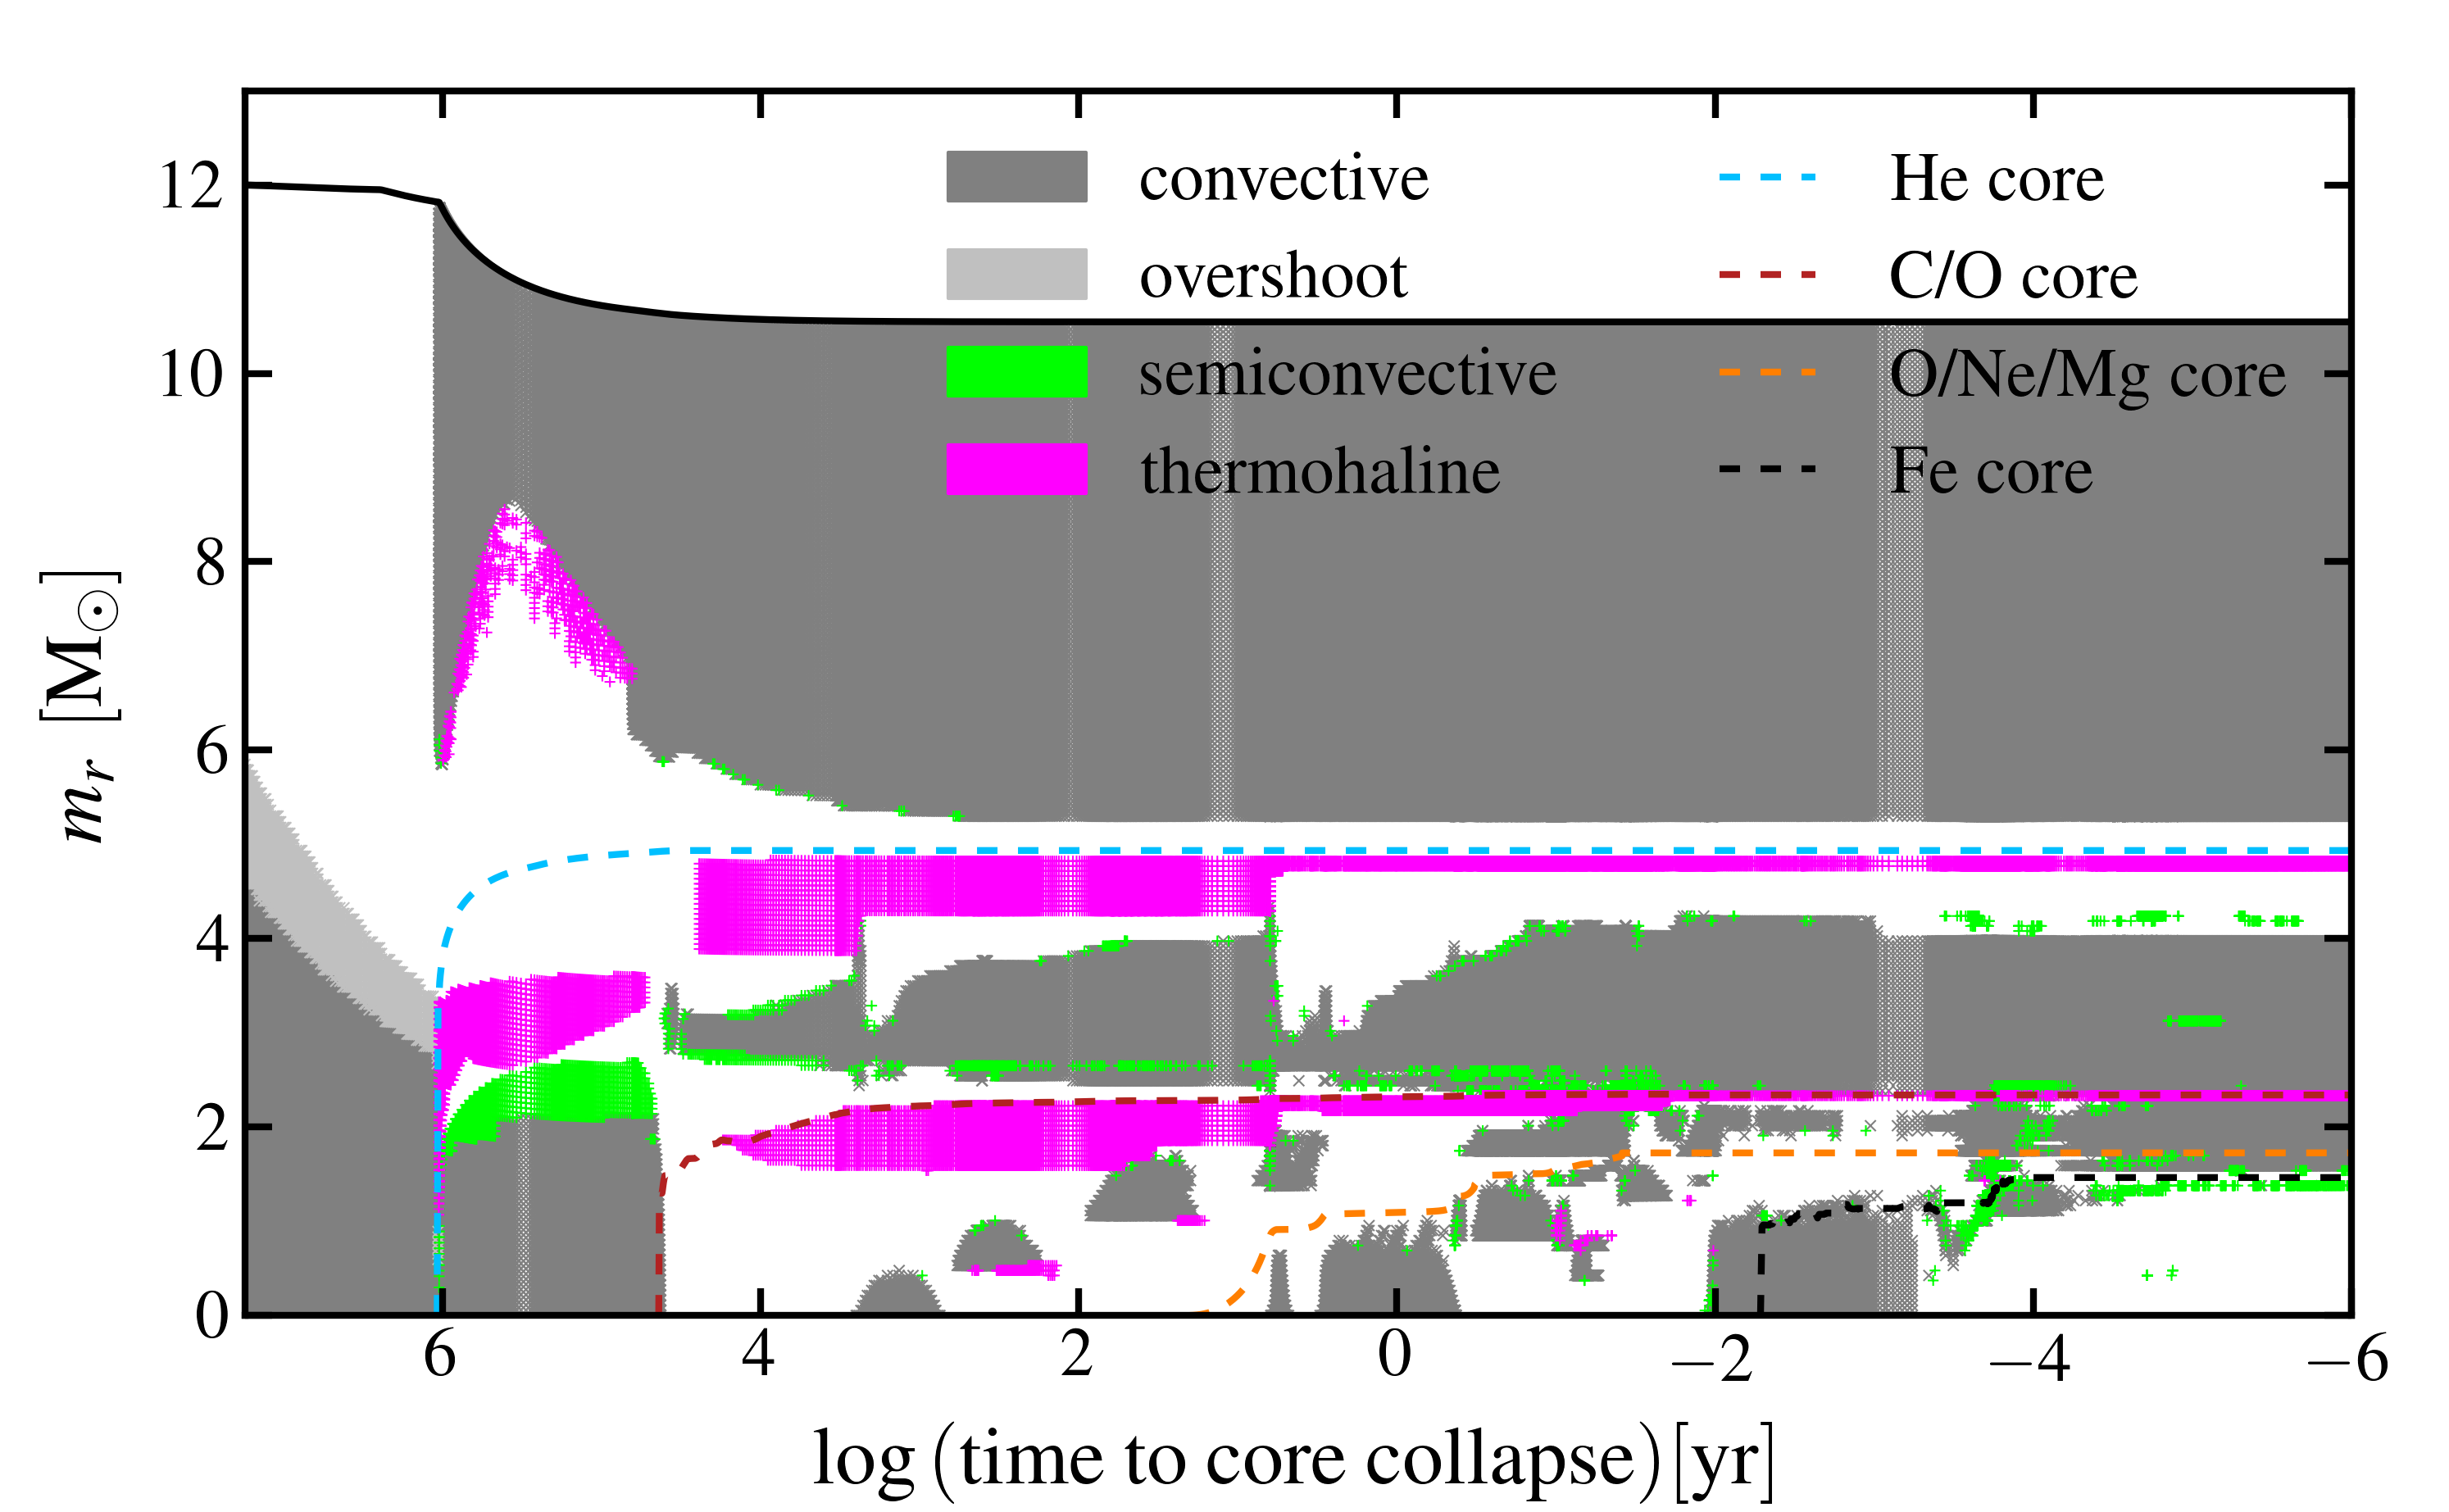
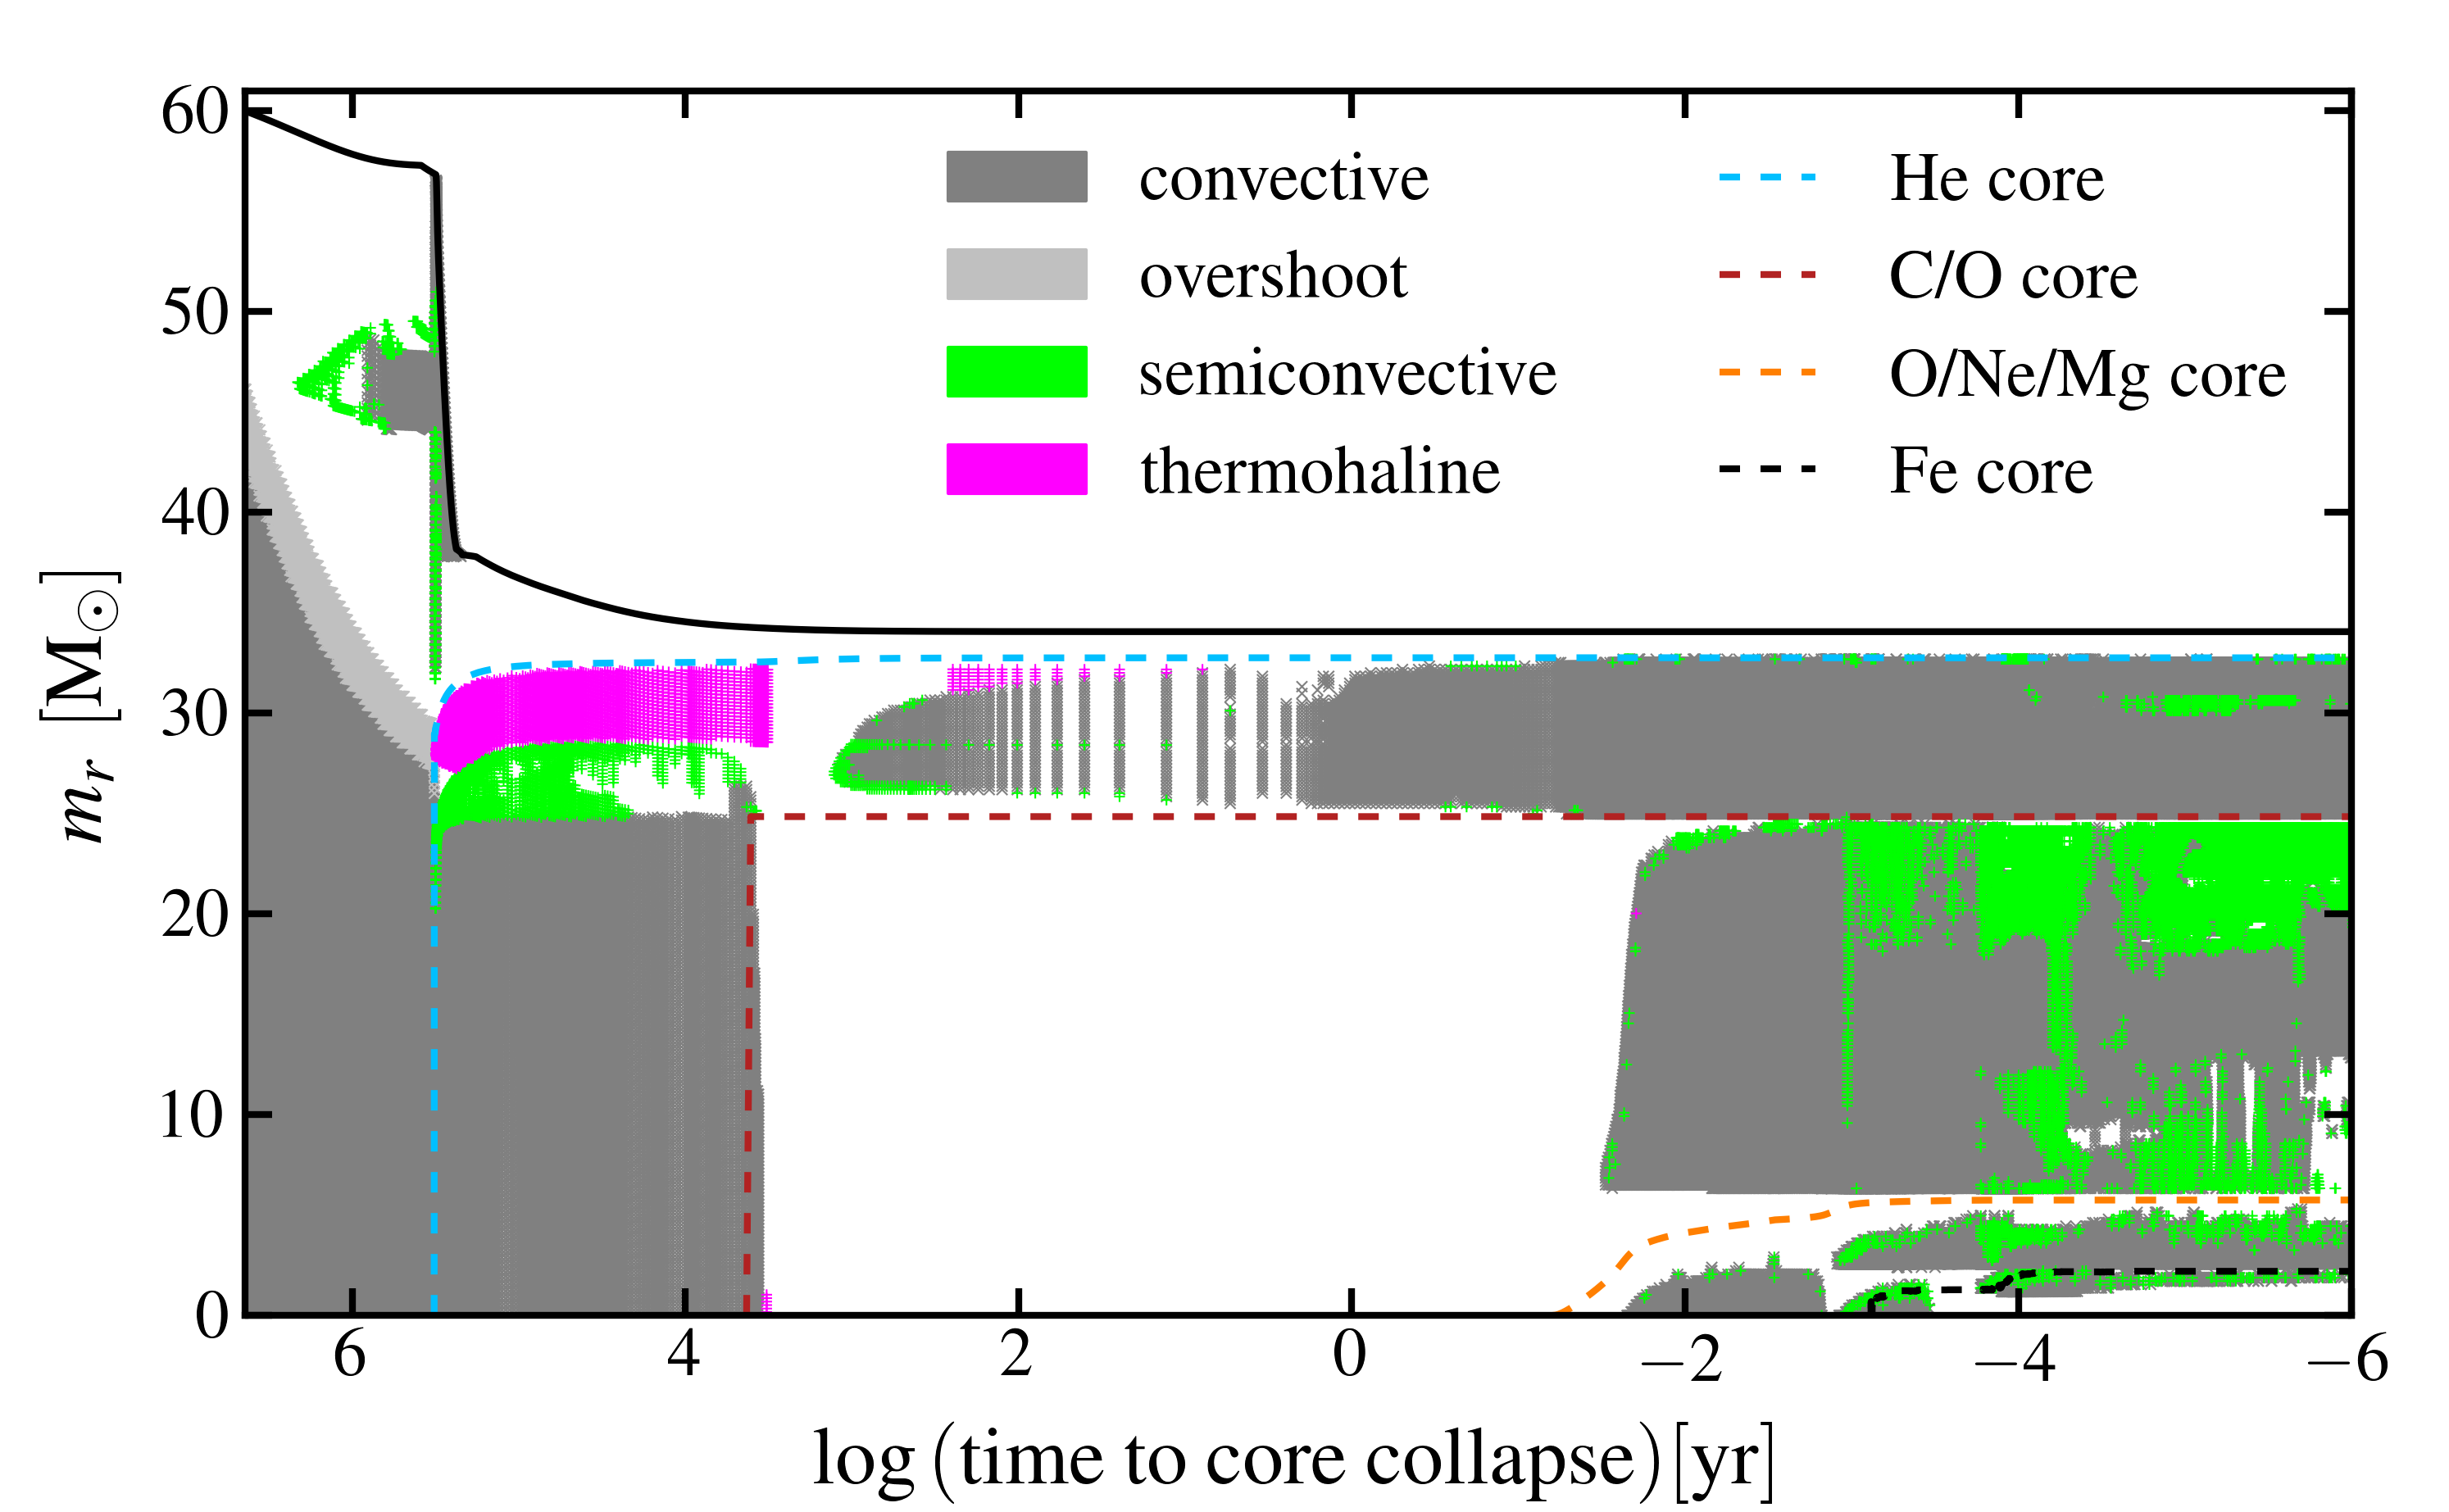
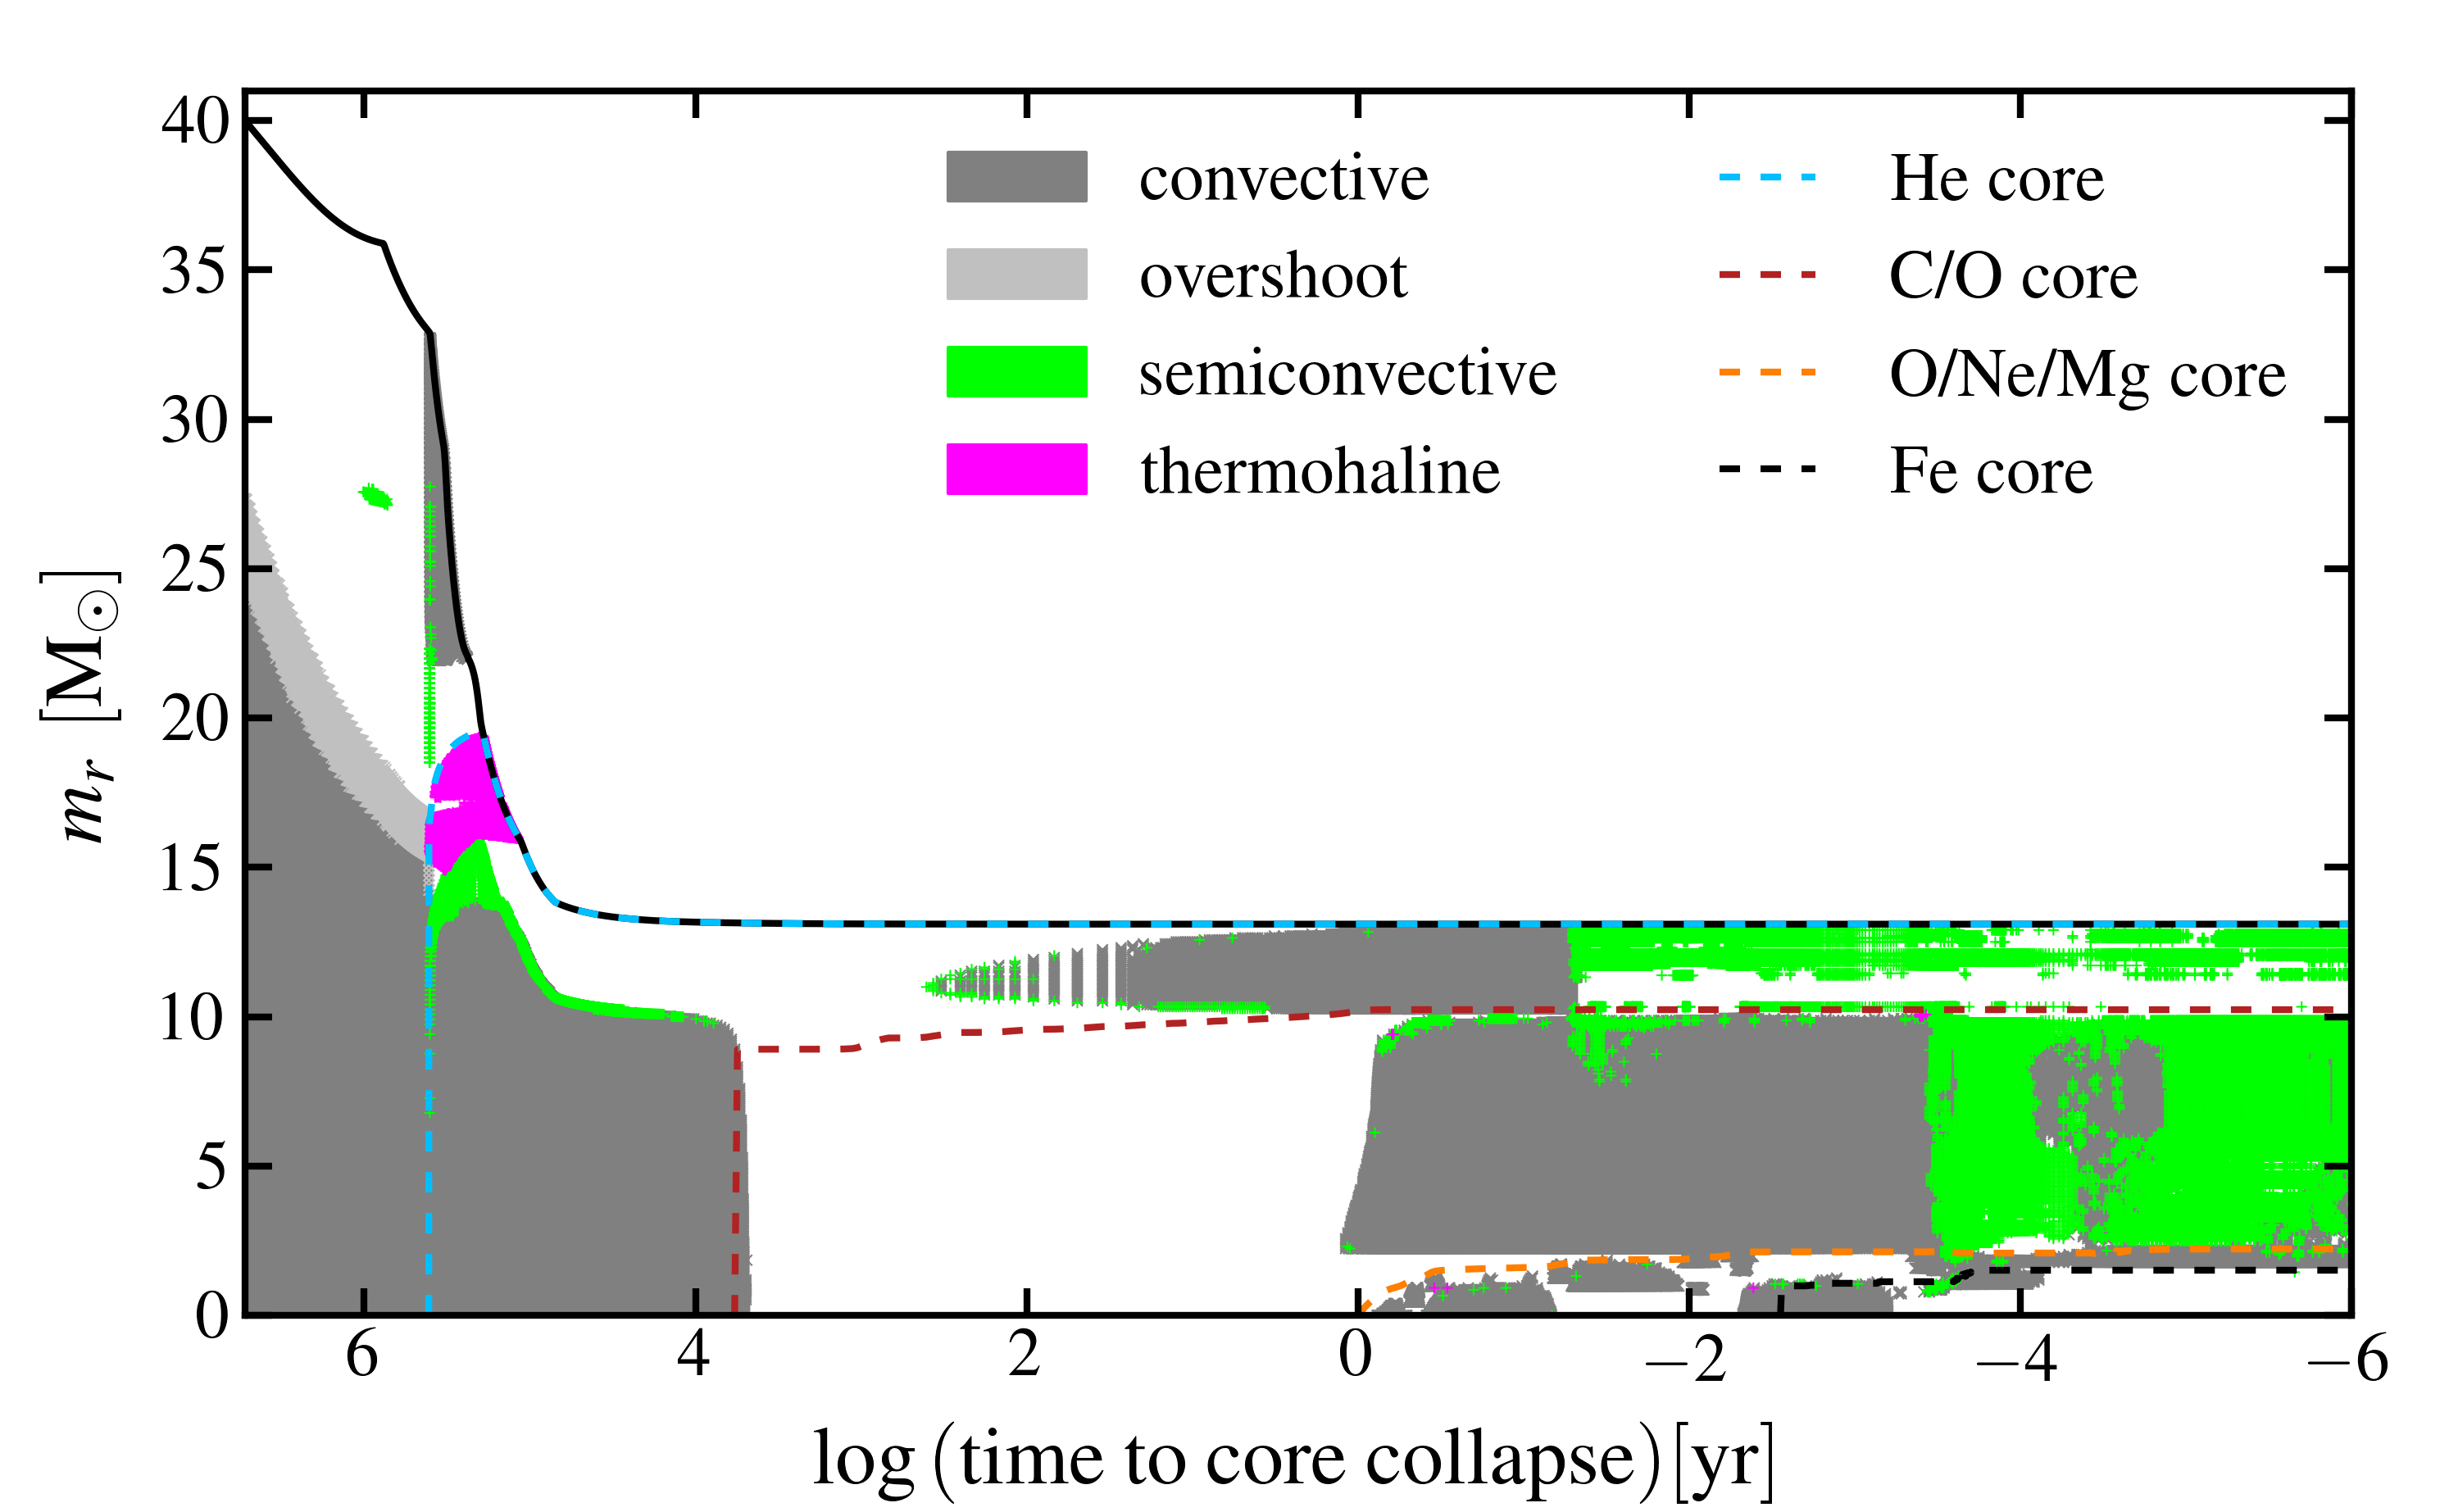
Table LABEL:tab:mods in Appendix B summarizes the properties of our grid of evolutionary calculations for a total of 76 progenitor models. The table gives the initial values for mass, metallicity, and rotation, as well as the mass loss scheme, and shows how these map to final core masses, burning timescales, and our progenitor classifications. Progenitor classifications are based on the structure of the final model prior to core collapse:
-
•
Red supergiant (RSG): hydrogen envelope and .
-
•
Blue supergiant (BSG): hydrogen envelope and .
-
•
Wolf-Rayet (WR): a star that has lost its hydrogen envelope.
These classifications correspond to stars with final radii for RSGs, for BSGs and for WRs. The hydrogen and helium envelope masses for all of our progenitors are shown in Figure 4 as a function of helium core mass just prior to core collapse (we define the He core mass to be the total stellar mass within the mass coordinate where the hydrogen mass fraction first drops below ). Although none of the progenitors lose their helium envelopes prior to core collapse, several of our WR progenitors have sufficiently low helium envelope masses that they might produce Type Ic SNe upon explosion (based on Hachinger et al. 2012).
Broadly, we find that our solar metallicity progenitors with become WR stars, lower ZAMS mass solar metallicity stars generally produce RSGs, and low-metallicity stars produce BSGs. At fixed , moderate rotation produces bigger helium core masses through mixing, while the largest initial rotation values lead to smaller cores due to the rotational enhancement of the stellar wind.
Figures 5, 6 and 7 show examples of the convective history, plotted against , where is time to core collapse, for each of our progenitor categories. Fig. 5 shows the history of a 12 M⊙, solar metallicity, slowly rotating progenitor that becomes a RSG; Fig. 6 shows a 60 M⊙, 0.1 Z⊙, non-rotating progenitor that becomes a BSG; Fig. 7 shows a 40 M⊙, solar metallicity, non-rotating progenitor that makes a WR star. In these diagrams, stellar mass is plotted against the time to core collapse, in years, so that each plot shows the convective history from the ZAMS to seconds from core collapse (). The mass extent of each convection zone in the star is marked by the darker gray shaded regions, overshoot mixing (on the main sequence only) is shown in light gray, semiconvection in green, and thermohaline mixing in magenta. Also plotted are the mass boundaries of the He, C/O, O/Ne/Mg, and iron cores as a function of time to core collapse. For the He, C/O and O/Ne/Mg cores, these boundaries are determined by the first mass coordinate interior to the surface (or the previous mass boundary) where hydrogen, helium or carbon drops below a mass fraction of . For the iron core, the boundary is determined by the first mass coordinate inward from the boundary of the O/Ne/Mg core where the total mass fraction of iron-group elements rises above 0.5.
In massive stellar envelopes, radiation pressure provides a significant fraction of the pressure support even when the opacity is set by electron-scattering (Kippenhahn & Weigert, 1990). Significant opacity enhancements due to transitions of iron at and the recombination of HeII () and H () lead to regions of the stellar envelope where the Eddington luminosity is locally exceeded and gas pressure and density inversions can result (Paxton et al., 2013). In order to evolve through these computationally difficult stages of evolution, we employ the “enhanced mixing length theory” described in Paxton et al. (2013), which may crudely account for an energy transport mechanism not present in our 1-D models, such as the development of porosity (Shaviv, 2001; Owocki et al., 2004). We thus sacrifice accuracy in the surface evolution in favor of completing the core evolution all the way to core collapse. This implies, however, that our progenitor classifications (RSG, BSG, and WR) have significant uncertainties (as do, however, all analogous results in the literature!).
IV. Results
We present the results of our calculations by core burning phase: carbon, neon, oxygen, and silicon burning. Since burning timescales can vary by more than an order of magnitude, decreasing for increasing core mass, this does not uniformly map onto time to core collapse for all progenitors (see §V).
In order for convectively excited waves to drive mass-loss in a SN progenitor at any given time, they must satisfy the following conditions:
| (super-Eddington) | ||||
| (leakage) | ||||
| (outflow) |
Since the spectrum of wave excitation declines above (Lecoanet & Quataert, 2013), we focus on examining the above conditions for waves with throughout each burning phase. For each of the core burning phases, the characteristic , so we focus on waves with since these plausibly carry much of the excited wave luminosity and are the most likely to satisfy the leakage condition (see eqn. 3).
For the majority of the shell burning phases, the characteristic . Assuming the g-mode propagation cavity is determined by the radii and where , the leakage timescale (see eqn. 3) varies as for fixed frequency, since for a wave with degree is given by . Given this increase in with , we conclude that waves excited by shell convection are less likely to satisfy the leakage condition. Thus, we do not specifically address the potential for wave-driven mass loss from shell convection phases, but do provide the total wave energy reservoirs excited by these convective shells in Figs. 11 and 13.
Each of the following subsections presents the results of our calculations as follows. We begin by considering each of the super-Eddington, leakage, and outflow conditions in turn. If the most efficiently excited waves in a given progenitor fail either of the first two conditions, there is unlikely to be any significant energy transported from the core to the stellar envelope (i.e., the excited wave energy damps to neutrinos in the core). However, if the progenitor hosts waves that satisfy the super-Eddington and leakage conditions but fail the outflow conditions, there is still a possibility that the energy carried out to the envelope could affect the envelope structure prior to core collapse by e.g., inflating or partially unbinding it. When considering the outflow conditions, there is some uncertainty in whether energy damps radiatively or in the convection zone in some cases. We believe that due to uncertainties in the mixing scheme (i.e., the convective criterion, semiconvection and overshoot), the exact location of the convective boundaries are uncertain at the local scale height level. Thus, for models where is within one scale height interior to , we consider the waves to be damping within the convection zone.
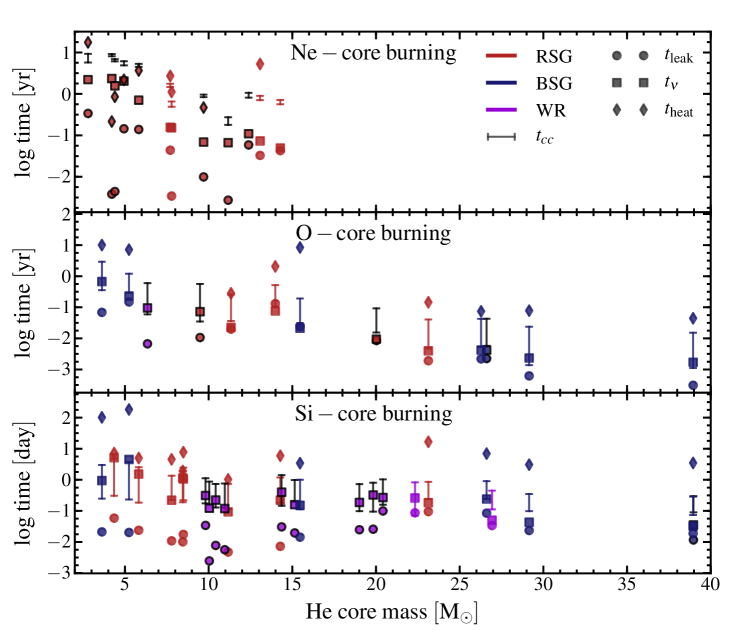
To quantitatively illustrate the timescale competition associated with the leakage and outflow conditions, Figure 8 shows , , , and as a function of He core mass for neon (top), oxygen (middle) and silicon (bottom) fusion (these are the three burning phases of most interest, as we show in the remainder of this section). For clarity, we show only a random 1/3 of our stellar models with core convection in the given burning phase. All timescales plotted are wave-energy-weighted averages over the duration of the burning phase.666In the average we exclude points (i.e., times) that deviate from the median by more than roughly 3 times the dispersion about the median. This excludes outliers that otherwise strongly bias the average, particularly during silicon burning where there is more fluctuation in the stellar structure that leads to significant temporal variation in . For now, the key point of Figure 8 is that in most models, many of the key timescales that determine the efficacy of wave-driven mass loss are comparable to each other to within a factor of . Success or failure thus hinges on modest changes in core and envelope structure that change the relevant timescales by factors of . We discuss these in more detail in the following sections.
For progenitors where at least the super-Eddington and leakage conditions are met, we examine the total wave energy reservoir excited during each phase. This is given by the integral of the wave luminosity over the phase of interest:
| (13) |
While we use the above form for our calculations, it is useful to look at an approximate form of eqn. 13 that highlights the important contributions:
| (14) |
where is the nuclear luminosity for a given burning phase and the total energy released through fusion during the phase.
We regard the determination of the wave energy reservoir as the most definitive conclusion of our work. Our arguments regarding mass loss rates and ejecta masses rely heavily on assumptions about how outflows develop in super-Eddington atmospheres (see §II.3), which are as yet not satisfactorily understood.
Finally, for progenitors where all conditions for wave-driven mass loss are met, we estimate the potential unbound mass, , using eqn. 11. This represents an upper limit in the sense that we assume that the outflow taps into the full reservoir of wave energy to produce an outflow (it is not strictly an upper limit because of uncertainties in calculating e.g., and ). We also calculate the radius, , unbound material can reach by core collapse, given simply by .
Our calculations of the relevant timescales for tunneling and sound-crossing in the envelope rely on accurate determinations of the Brunt-Väisälä frequency to determine the relevant radii (; see Fig. 1) and the group travel time for the excited g-modes. As the Brunt-Väisälä frequency requires numerical differentiation and depends on the implementation of mixing in the stellar interior (in that composition gradients enter into the Brunt-Väisälä frequency), our results are affected by numerical noise. Over the course of each burning phase, we evaluate the timescales given in the leakage and outflow conditions for at least time-steps for each progenitor. We consider any progenitor in which at least 50 per cent of the wave energy excited during a given phase satisfies the super-Eddington, leakage, and outflow conditions as capable of generating wave-driven mass loss throughout that phase. On the other hand, progenitors that fail this 50 per cent criterion are considered incapable of wave-driven mass loss for the given phase.
In the following, we organize our results by helium core mass at core collapse (rather than ZAMS mass), as this is the best indicator for the time and energy-scales of the late burning phases (e.g., Woosley et al., 2002).
A summary of all of our wave-driven mass loss calculations is given in Table LABEL:tab:res in Appendix B. We present a detailed discussion of each of the advanced burning phases in the sections that follow.
IV.1. Carbon-burning
Carbon burning is the least interesting of the advanced burning phases from the perspective of wave excitation and subsequent wave-driven mass loss. The nuclear luminosity is generally only slightly larger than the Eddington luminosity and the characteristic mach numbers are the smallest of the post-He burning phases. Furthermore, only progenitors that produce the smallest helium cores (which includes some of the high ZAMS mass progenitors simulated with high mass loss rates) experience convective core carbon burning. The exact helium core mass cutoff depends on the physics implemented in the stellar evolution code, especially the choice of reaction rate and the mixing parameters. For large helium core masses, the carbon abundance after helium burning is not large enough for the carbon burning luminosity to exceed the neutrino losses in the core, and carbon is burned radiatively (see e.g., Woosley et al., 2002).
For our MESA star calculations, employing the Kunz et al. (2002) rate, convective core carbon burning occurs only for He-core masses below for non-rotating progenitors. A few of the rotating progenitors with larger helium cores experience convective core carbon burning due to the combination of rotationally enhanced mixing and mass loss. Independent of mass, carbon does burn convectively in a shell after being exhausted in the core; lower core mass progenitors have multiple distinct shell burning phases separated in time (see e.g., Fig. 5).
While core carbon burning excites of wave energy over the course of the burning phase, none of the progenitors produce a super-Eddington wave luminosity during this phase of evolution. Fig. 9 shows propagation diagrams and plots of the key luminosities for three core carbon-burning models, one of each of our progenitor classes. The top panel shows the Brunt-Väisälä frequency (solid blue line), Lamb frequencies for and (green, solid and dashed lines, respectively) and the range of propagating g-mode frequencies (given by ) predominantly excited during the core carbon-burning phase (red, shaded span) plotted against the left axis; the convective mach number is plotted against the right axis as the dashed grey line. A range of g-mode frequencies is shown to capture variation during the burning phase.
The bottom panels show the local luminosities important in the physics of wave excitation and damping: the radiative luminosity () is shown as the solid red line; the neutrino luminosity () in solid black; convective luminosity () in solid magenta; the maximum possible convective luminosity () in dashed magenta; the damping luminosity for radiation () in dashed teal; and the range of excited during this phase as the blue, shaded span. All progenitors that undergo convective core carbon burning are qualitatively similar, in that throughout the phase. Thus, wave-driven mass loss is unlikely to arise from core carbon burning.
IV.2. Neon burning
As for core carbon burning, only lower mass models (helium core masses in this case) have a distinct convective core neon burning phase. This is shown in Fig. 5 as the short core convection phase just after the growth of the carbon depleted core () and similarly in Fig. 7 (). Also similar to core carbon burning, the mass fraction in Ne left behind by earlier phases decreases with core mass, so that the net nuclear luminosity, and thus the wave luminosity, decreases with increasing core mass. Thus, only 43 of our 76 progenitors have distinct core neon burning phases.
All neon burning RSG and BSG progenitors excite gravity waves that meet the leakage condition, but only models with helium core masses generate a super-Eddington wave luminosity during core neon burning. For the compact WR progenitors, core-Ne burning predominantly excites waves with frequencies in the stellar envelope, which are thus unlikely to tunnel out of the stellar core. This leaves 27 of the 43 core neon burning progenitors where waves are likely to transport energy out of the core and into the stellar envelope.
Figure 10 shows the propagation diagrams and luminosity plots as in Fig. 9, but with on the abscissa rather than , in order to show the envelope behavior. The top right panel showing the propagation diagram for the WR progenitor also shows the acoustic cutoff frequency, , in the envelope (dashed, cyan line) to demonstrate its magnitude in comparison to the excited g-mode frequencies. That is also reflected in the bottom right panel where at all radii; this is equivalent to (see eqns. 6 and 7). This representative example demonstrates that convectively excited waves in WR progenitors during core neon burning are likely reflected before reaching the envelope. For the giant progenitors, for the excited g-modes and roughly follows the Lamb frequency (so it is not shown). In giants that satisfy the super-Eddington and leakage conditions, waves likely tunnel out of the core and deposit their energy at .
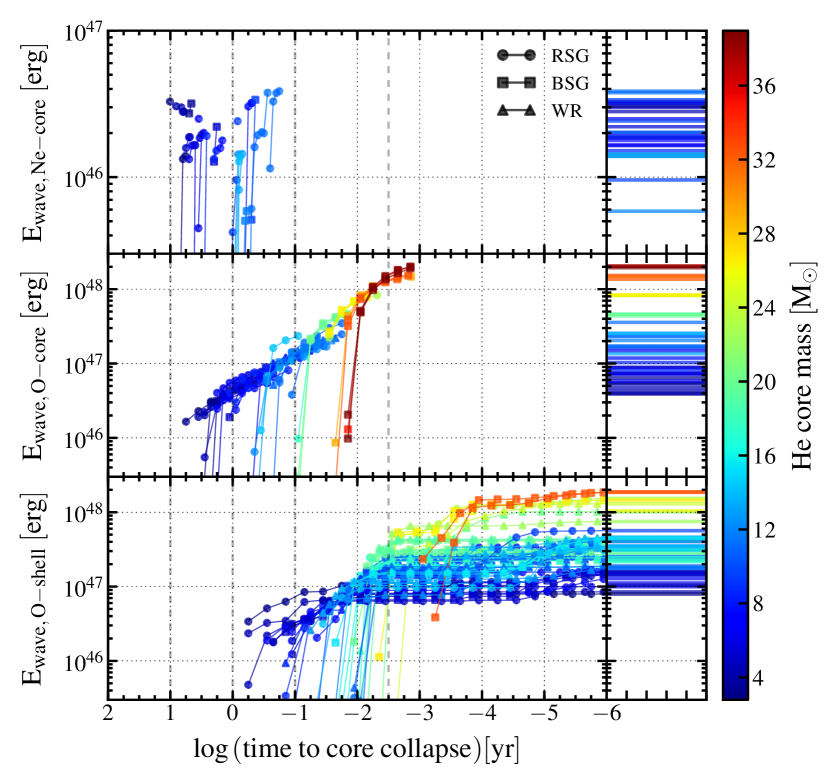
The upper panels of Fig. 11 show the total energy released in waves during core neon burning for all progenitors that satisfy the super-Eddington and leakage conditions. In the upper left panel, the integral in eqn. 13, evaluated from the start of the burning phase to a given , is plotted every . The total (cumulative) energy liberated over the whole burning phase for each model is shown as a horizontal line in the upper right panel. The colors represent the helium core mass, according to the colorbar at the far right of the plot, and the symbols represent the progenitor type, with circles representing RSGs, squares BSGs, and triangles WRs. There are no strong trends in during core neon burning.
For all progenitors that satisfy the super-Eddington and leakage conditions (giants), waves reach interior to , on a timescale (since ). For four of the RSGs, is within one scale height of the envelope convection zone; we consider the timescale for driving an outflow from these few progenitors to be . However, the majority, 23, reach in the radiative zone scale heights from the outer convection zone and must heat the stellar material to drive convection and eventually an outflow. Calculating over the region from to the base of the envelope convection zone , we find 14 of the remaining 23 models have , leading to the conclusion that wave-driven mass loss is plausible in these 14 progenitors. The remaining nine stars would reach collapse with of wave energy still attempting to work its way through the envelope.
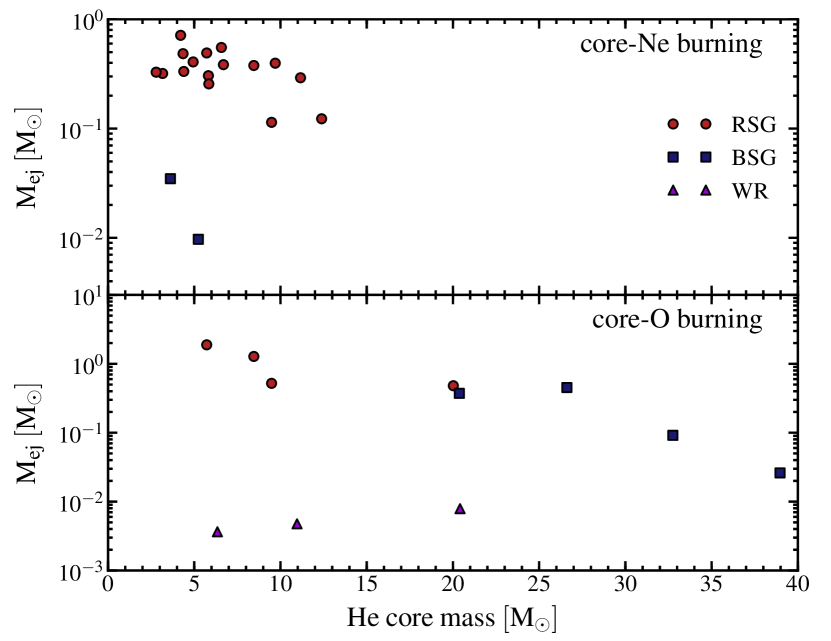
The upper panel of Fig. 12 shows our estimate of (see eqn. 11) for the 18 progenitors (out of 43 convective core-Ne burning and 76 total progenitors) where wave-driven mass loss is possible during core neon burning. Our RSG progenitors, having the most weakly bound envelopes, are capable of producing the largest wave-driven mass loss events, with . The two core-Ne burning BSGs capable of driving outflows can produce . If launched during core-Ne fusion, traveling at the escape velocity at , , this ejecta can reach distances of prior to core collapse. Lower mass progenitors, with their smaller helium cores, longer burning timescales, and tendency to form giants, are capable of producing the most massive and extended wave-driven circumstellar environments during Ne fusion.
IV.3. Oxygen burning
Core oxygen burning is convective for all progenitors, but occurs over a range of timescales (see Table LABEL:tab:mods, and Woosley et al., 2002); the burning timescale depends primarily on helium core mass, with the smallest cores () having core oxygen burning for and the largest () for . For all the progenitors considered here, the burning produces a super-Eddington wave luminosity during the majority of core oxygen burning.
In all but five of the 42 RSG and BSG progenitors, convectively excited waves can transport energy from the core to the envelope. As expected from eqn. 3, those that fail are biased towards larger values of . For the WRs, only three out of 34 compact progenitors have energy-bearing waves with frequencies above the envelope acoustic cutoff during core oxygen burning. This leaves a total of 40 (37 giants and 3 WRs), a little more than half of the progenitors, capable of transporting wave energy from the core to the envelope during core oxygen burning.
The middle panel of Fig. 11 shows the wave energy reservoir during core oxygen burning for these 40 progenitors, while the bottom panel shows the wave energy from shell oxygen burning. There is a factor of 50 increase in the wave energy reservoir from core oxygen burning as the helium core mass increases from . This increase arises partially from each of the contributions outlined in eqn. 14. As core mass increases, the time averaged mach number during the oxygen core burning increases by a factor of , the total nuclear energy liberated varies by a factor of , and the ratio of the convective to nuclear luminosities varies by a factor of . While the ratio varies only slightly, the ratio varies from due to the change in burning timescale and thus .
During the short core oxygen burning phase, fewer progenitors host waves capable of heating the stellar envelope on a timescale shorter than the time to core collapse. Only one of the 40 progenitors with waves capable of transporting a super-Eddington luminosity to the envelope has and can drive an outflow via radiatively damped waves. Four others excite waves that reach , but have , so that they can drive an outflow on the sound crossing time at , which is characteristically on the order of minutes. Finally, six giants have waves with less than one scale height from the envelope convection zone; for these, we assume the deposited wave energy can immediately drive convection into the envelope zone and drive an outflow on a timescale . In total, 11 of our 76 progenitors are capable of generating wave-driven mass loss during the core oxygen burning phase; these 11 span all three progenitor categories, as well as our full range of initial masses, metallicities and rotation rates.
The lower panel of Fig. 12 shows our estimate of for the 11 progenitors capable of wave-driven mass loss during core oxygen burning. As during core-Ne burning, the weakly bound envelopes of the giant progenitors are most susceptible to large mass-loss events. During core-O burning, RSGs may produce , BSGs may liberate , and WRs . Given the similar timescales and assumed envelope structures for oxygen and neon fusion, the outflow velocities and the radii reached by the ejecta during core-O burning are similar to those during Ne burning, with ejecta reaching at speeds of .
IV.4. Silicon burning
The silicon burning phase is the most uncertain of those considered here. During this late stage, burning and convective timescales become comparable, likely invalidating the treatment used in most stellar evolution codes, including MESA star (e.g., Woosley et al., 2002). Furthermore, the reaction network uses many pseudo-reactions to simulate the actual high-dimensional nucleosynthetic network (though development is underway to improve upon this; Paxton, private communication). These uncertainties may affect the luminosities and stellar structure during silicon burning. In addition, we find that the wave leakage timescale (eq. 3) is much more variable from timestep to timestep during silicon burning, due in part to the existence of multiple non-overlapping convection zones that cause large fluctuations in the Brunt-Väisälä frequency.
In our MESA star models, silicon burns convectively in the core for all progenitors, over timescales of for the smallest cores down to for the largest. The most luminous burning phase, core silicon burning produces a significantly super-Eddington wave luminosity in all progenitors, . The characteristic excitation frequency, , increases from during carbon burning to during this last phase. At these high frequencies, convectively excited waves now exceed the acoustic cutoff frequency in all compact progenitors. This is a key difference between silicon fusion and earlier burning phases.
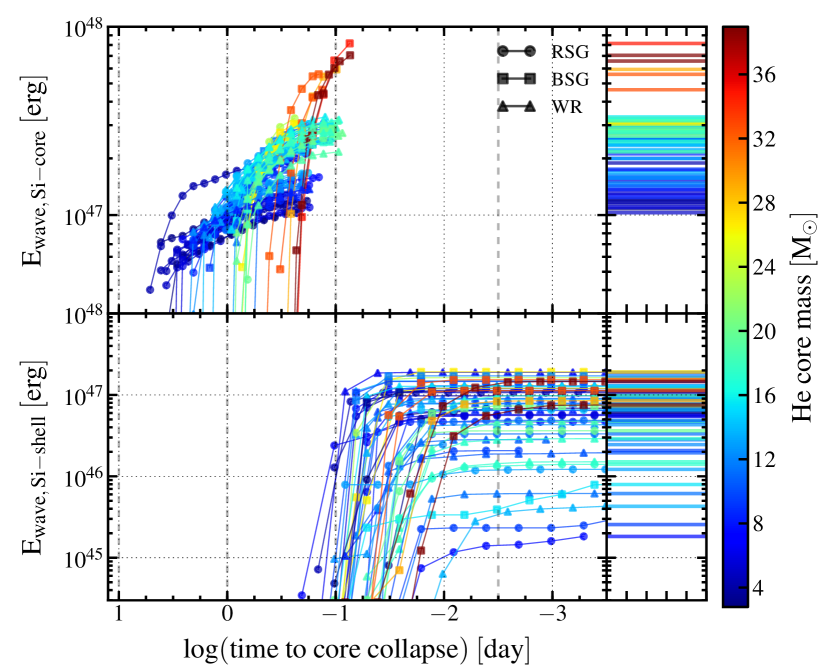
With the compact progenitors exciting waves above the acoustic cutoff frequency, many more of our progenitors transport energy from the core to the surface during core silicon burning than during the previous phases: 70 of 76. Figure 13 shows the wave energy reservoir for these 70 progenitors during core silicon burning. There is a roughly monotonic relationship between and helium core mass, as in the case of core oxygen burning, but the range in is smaller at a factor of .
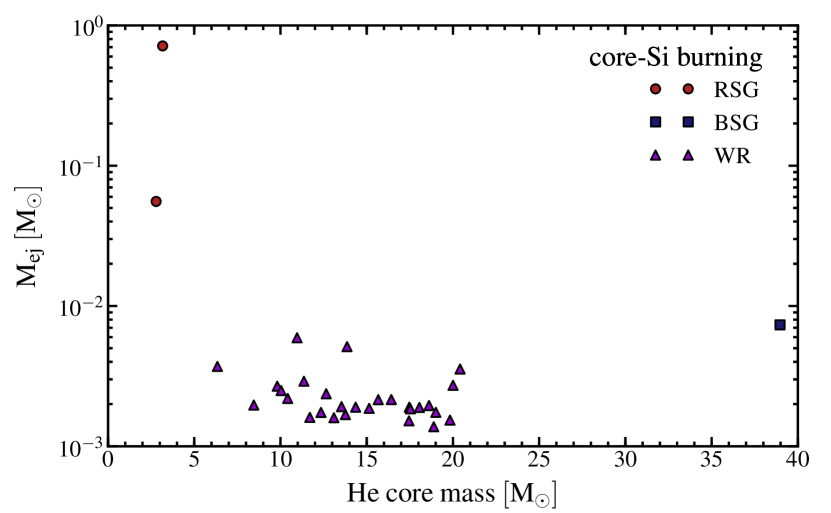
Thirty-one of the seventy progenitors that satisfy the super-Eddington and leakage conditions also satisfy the outflow conditions. Of these, the majority, 28, are WR progenitors which now host convectively excited waves with frequencies above the acoustic cutoff, as described above. In these, and one BSG progenitor, waves reach before , likely generating outflows on the sound crossing time at , which is minute. Only two RSG progenitors host waves that satisfy the outflow conditions; one where is within one scale height of the envelope convection zone, and one where is in the radiative zone and . Despite the very short time to core-collapse, , the several order of magnitude increase in during silicon fusion sufficiently decreases for this one progenitor.
Figure 14 shows the mass, , that can be unbound by waves excited during core-Si burning. As during previous phases, there is a clear delineation in between giants and WRs due to differences in the envelope binding energy. While two RSGs are capable of heating the stellar material and potentially driving an outflow prior to core collapse, there is not enough time for any unbound mass to travel beyond the progenitor photosphere, which is already . However, for the WR progenitors, wave energy deposited in the envelope during Si burning has the potential to inflate these compact progenitors to giants extending out to , in the day leading up to collapse. This may have important implications for the appearance of a subsequent SNe.
V. Discussion and conclusions
In Quataert & Shiode (2012), we argued that vigorous core convection in late stages of stellar evolution (Ne fusion and later) can excite a super-Eddington energy flux in outgoing internal gravity waves, potentially leading to substantially enhanced mass loss in the last year to decade of stellar evolution. The ultimate energy source for this mass loss is the prodigious fusion luminosities in the cores of massive stars during their neutrino-cooled phases.
In this work, we have surveyed SN progenitors with initial masses from , metallicities from 0 (Population III) to solar and rotation up to 80 per cent of breakup in search of those most susceptible to wave-driven mass loss. This grid of stellar models likely provides a reasonable sample of the range of possible helium core masses and progenitor structures produced during single star evolution. Binary evolution may lead to qualitatively different progenitors. Moreover, the mapping from ZAMS properties to late-stage stellar properties is uncertain because it depends on details of mass and angular momentum loss throughout stellar evolution.
For many progenitors, we find that waves excited after core carbon exhaustion can carry a super-Eddington luminosity and deposit out in the stellar envelope. Depending on the uncertain physics of super-Eddington stellar envelopes, this may lead to strong wave-driven mass loss in about 20 per cent of the progenitors surveyed. While a detailed comparison to SN rates depends on the initial mass function, the connection between ZAMS and helium core masses, and the subset of massive stars that can explode, we note that the rate of wave-driven mass loss we find is comparable to the rate of Type IIn SNe, which are per cent of core collapse SNe (Li et al., 2011).
There are several physical properties of the stellar progenitor that determine whether or not wave-driven mass loss is likely (see §II). In those progenitors we have surveyed where wave-driven mass loss appears disfavored, the most common reasons are (1) the wave energy is thermalized by dissipation deep in the star where the timescale to generate a convection zone that carries energy to the stellar surface (; eq. 9) is longer than the time to core collapse, (2) for compact WR-like progenitors, the core convective frequency during neon and oxygen burning is below the acoustic cutoff frequency of the stellar envelope; waves excited by core convection thus cannot propagate out into the stellar envelope.
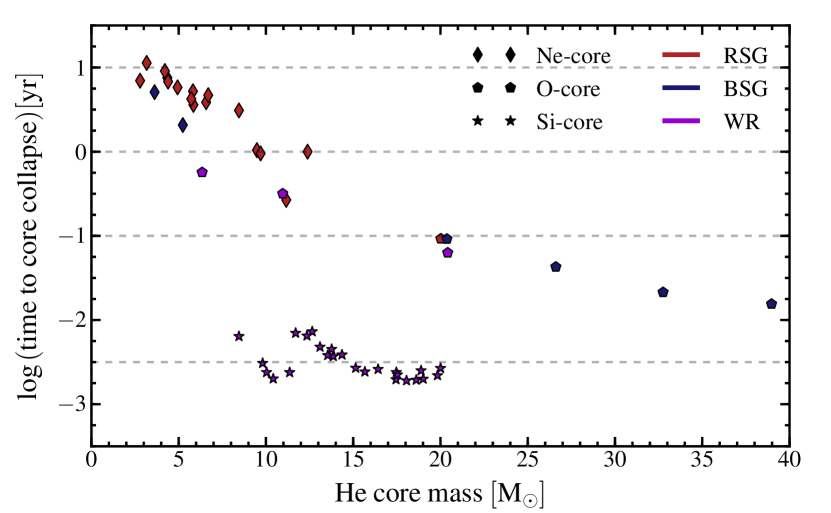
Given that the wave luminosity excited by core carbon fusion is never super-Eddington, we find that the earliest core burning phase that might lead to wave-driven mass loss is neon fusion. Figure 15 shows the earliest potential onset of wave-driven mass loss () as a function of helium core mass. For the lowest core masses, the onset of super-Eddington wave luminosities may be as early as before core collapse. Figure 15 also highlights the well known (e.g., Woosley et al., 2002) correlation between burning duration (and thus ) and core mass, which is one of the key features of our specific mass loss mechanism. For wave-driven mass loss events, the timing of a pre-SN outburst can be used to place a rough upper limit on the helium core mass of the progenitor, which can in turn be constrained by modeling the associated SN. For example, a burst of mass loss that occurs more than a month prior to core collapse requires a progenitor with a helium core mass . However, the complex interplay between mixing and mass loss, each dependent on both rotation and metallicity, makes the further inference from helium core mass to ZAMS mass, metallicity and rotation much less certain. Even the surface luminosity and effective temperature at a given helium core mass are uncertain because of difficulties modeling near-Eddington stellar envelopes (e.g., Paxton et al. 2013; Suárez-Madrigal et al. 2013; see also §III).
Table LABEL:tab:res in Appendix B summarizes the results of our calculations. For each model, the time to core collapse () for each of the neon, oxygen and silicon burning phases is given whenever these phases occur convectively. The wave energy reservoir () for each burning phase is given for models in which convectively excited waves can tunnel out of the core and carry a super-Eddington luminosity into the envelope. Finally, when this excited wave energy can plausibly drive an outflow on a timescale shorter than , we present the estimated ejecta mass (), escape velocity () at the point where a wind is plausibly launched (i.e., ), and the radius that ejecta reaches prior to explosion (). These results are also summarized in Figs. 11—15. As noted earlier in the paper, the ejecta energetics are more robust than the ejecta mass or radius because the former “only” depends on the physics of wave excitation, propagation and damping while the latter also depend on the physics of outflows under super-Eddington conditions.
We find that lower mass stars are the most likely to produce significant circumstellar ejecta via wave-driven mass loss during neon and oxygen fusion. In more massive stars, wave-driven mass loss during neon/oxygen fusion is also possible but occurs preferentially at lower metallically, . This is because massive solar metallically stars become WR stars prior to core-collapse with our mass-loss prescriptions. The convectively excited waves during oxygen and neon fusion in most WR progenitors have frequencies below the acoustic cutoff frequency of the stellar envelope, thus suggesting that the convectively excited waves from the core cannot efficiently heat the stellar envelope. We note, however that the wave frequencies in our models are only a factor of few below the acoustic cutoff frequency (e.g., the top right panel of Fig. 10). In a small minority of our WR progenitors we thus find that wave-driven mass loss during core neon and oxygen fusion may be possible (e.g., the , , and and , and models in Table LABEL:tab:res).
Progenitors with small helium cores are susceptible to the earliest mass loss events, up to prior to core collapse (Fig. 15). This is important because mass ejection in the year to decade prior to core-collapse places the resulting ejecta at radii AU at explosion. At these radii, the shock produced by the interaction between the SN and the previously ejected matter is particularly radiatively efficient, thus enabling circumstellar interaction to efficiently power luminous SNe. In all cases, the lower binding energy of the stellar envelope in blue and red super-giants implies that these progenitors are the most likely to produce very massive ejecta prior to core-collapse.
During silicon burning in the last few days of stellar evolution, there is not enough time for wave energy deposition in super-giant progenitors to significantly alter the stellar radius, though the wave energy may modify the structure of the stellar envelope. However, wave excitation and damping during Si burning can inflate nominally compact WR progenitors to giant radii (). The key difference relative to neon and oxygen fusion, during which WR progenitors are less likely to have significant wave-driven mass loss, is that the convection is far more vigorous during silicon fusion. This excites higher frequency waves that exceed the acoustic cutoff frequency of the envelope. The end result of wave energy deposition during silicon fusion in WR progenitors would likely be a core-collapse SN spectroscopically classified as Type Ibc (i.e, a compact star) but with early thermal emission more characteristic of extended shock-heated stellar envelopes.
The success of the neutrino mechanism for core-collapse SNe hinges on a competition between neutrino heating of the post accretion shock material and the ram pressure of the accreting matter (e.g., Burrows & Goshy 1993). Any process that decreases the accretion rate in the first sec after core bounce can aide the explosion. The energy in convectively-excited waves that break and dissipate just outside the silicon-burning core is almost certainly significantly larger than the energy that makes its way to the stellar envelope. Moreover, this redistribution of energy occurs for all stellar progenitors. It is likely that the dissipated energy modifies the stellar density profile relative to existing pre-SN models: e.g., at a radius of cm the deposition of ergs of wave energy during silicon burning could double the radius of . Whether this is sufficient to significantly aide the onset of explosion remains to be seen. This effect can be crudely taken into account in 1D stellar evolution models or more self-consistently modeled using multi-dimensional hydrodynamic simulations (e.g., Meakin & Arnett 2006; Arnett & Meakin 2011).
V.1. Comparison to observed systems
Here we discuss the application of our results to Type IIn and Type IIb SNe, the latter of which appear to arise from both compact and extended progenitors (Chevalier & Soderberg, 2010). In addition, there are three SNe with observed pre-SN outbursts: the Type Ibn 2006jc (Foley et al., 2007; Pastorello et al., 2007), the Type IIn 2009ip (e.g., Mauerhan et al., 2013; Fraser et al., 2013; Margutti et al., 2013), and the Type IIn 2010mc/PTF 10tel (Ofek et al., 2013b). We briefly address each of these systems here.
V.1.1 Type IIn SNe
Type IIn SNe are characterized by the presence of narrow lines in their spectra, indicative of interaction between the outgoing SN shockwave and a dense circumstellar medium (CSM; see Filippenko 1997 for a review). Based on the timescale of the observed shock interaction and the measured CSM wind velocities, significant mass loss must have taken place within about a decade of collapse, with mass loss rates exceeding the line-driven wind maximum around (e.g., Kiewe et al., 2012). Some IIn also show evidence of continued interaction signatures and light echoes from dust shells that imply elevated mass loss rates during or even before the carbon burning phase, prior to core collapse (Fox et al., 2011; Kochanek, 2011; Fox et al., 2013).
Our wave-driven mass loss mechanism is broadly consistent with the early time observations of Type IIn SNe that imply high density CSM extending to . Progenitors with the smallest helium core masses, , are most likely to produce these types of CSM environments via waves driven by convective neon and oxygen burning (see Fig. 15 & Table LABEL:tab:res). However, our wave-driven mass loss mechanism cannot produce the more extended CSM that must result from winds launched more than a decade prior to core-collapse. These winds must be driven during core carbon burning (or even helium burning in some cases) when waves excited by core convection do not carry enough luminosity to significantly affect the stellar envelope.
The majority of massive stars are in close binaries, many of which will interact and undergo mass transfer during their lifetime (Sana et al., 2012). As a result, it is likely that interaction between close binary companions also plays a role in the enhanced pre-explosion mass loss inferred in many Type IIn SNe (see §V.2).
V.1.2 Type IIb SNe
Chevalier & Soderberg (2010) argued that Type IIb SNe appear to arise from both compact () and much more extended progenitors (). Empirically, this division manifests itself as an approximate dichotomy in radio emission and early thermal SN emission, consistent with significant differences in the progenitor radius and the strength of the pre-SN wind. SNe 1993j and SNe 2011dh are examples of Type IIbs from extended progenitors (Aldering et al., 1994; Bersten et al., 2012; Van Dyk et al., 2013). We suggest that this difference between compact and extended progenitors is caused by efficient wave energy deposition and ensuing mass loss in a subset of Type IIb progenitors. The most plausible alternative interpretation is that the hydrogen envelope masses are systematically smaller in the compact Type IIb progenitors (Chevalier & Soderberg, 2010). Tests of this hypothesis and/or evidence for (or limits on) pre-SN outbursts would provide tests of the importance of wave energy deposition in inflating the stellar radii of Type IIb SNe progenitors.
V.1.3 Type Ibn: SN 2006jc
Two years before its ultimate explosion in October 2006, an amateur astronomer recorded a luminous outburst at the same position as SN 2006jc (Foley et al., 2007; Pastorello et al., 2007). SN 2006jc is classified as Type Ibn, indicating that it lacks hydrogen in its spectrum (though some was detected at late times) and has relatively narrow lines. The progenitor is plausibly a He-rich WR star, perhaps recently transitioned from an LBV phase (to explain the weak signatures of hydrogen at late times).
While the precursor event was not well studied, the interaction between the SN ejecta and the pre-existing circumstellar material has enabled estimates of the mass-loss from this precursor. Through observations of x-rays (from the shock interaction), helium emission and p-cygni lines, and newly formed hot dust, several authors have estimated that the He-rich pre-SN ejecta has a velocity and total ejecta mass (Immler et al., 2008; Smith, 2008; Anupama et al., 2009). The inferred ejecta energetics, velocities, and masses are reasonably consistent with what we would expect from wave-driven mass loss in WR progenitors during neon and/or oxygen fusion (see Figs 11 & 12). However, none of the WR progenitors in our grid of stellar models produce wave-driven mass loss earlier than months prior to core collapse. In particular, we find that significant wave-driven mass loss 2 years prior to core collapse occurs only in stars with low He core masses, which are blue or red super-giants with extended hydrogen-rich envelopes in our calculations (Figs. 4 & 15). We believe that the need for a low He core mass () to explain wave-driven mass loss 2 years prior to core collapse is robust but it is quite possible that the absence of WR progenitors at this He core mass in our grid of stellar models is simply a shortcoming of our mass loss prescriptions or our restriction to single star (vs. binary) evolution.
V.1.4 Type IIn: SN 2009ip
The SN 2009ip is distinguished by the multiple observed outbursts, which occur three years, one year and two months prior to core collapse (Mauerhan et al. 2013; though its status as a “true” core-collapse event is still under debate, see Fraser et al. 2013). Based on shock interaction with the ejecta, Ofek et al. (2013a) estimate that of material was ejected over the last three years, at speeds of , reaching from the progenitor at the time of explosion. In pre-explosion imaging, Mauerhan et al. (2013) find a blue, progenitor, from which they infer a ZAMS mass.
As with SN 2006jc, the long pre-collapse outburst timescales for the first two outbursts of SN 2009ip would imply a low core mass in the wave-driven mass loss model, . In our calculations these progenitors are an order of magnitude too faint at core collapse, relative to the pre-explosion images. However, pre-explosion imaging of stars that undergo dramatic late-time mass loss may already catch the star in a state that is not well-described by any existing stellar evolutionary models (this worry is less acute for more typical Type IIp progenitors).
V.1.5 Type IIn: SN 2010mc/PTF 10tel
The pre-SN outburst from SN 2010mc, which occurred 40 days prior to core collapse, matches our models closest of the three observed examples (as argued by Ofek et al. 2013b). The precursor for this SN radiated and expelled at speeds of . The 40 M⊙ sub-solar metallicity progenitors we have simulated generate comparable wave-driven events during core oxygen-burning.
V.2. Directions for future work
The conditions we have investigated in this paper are necessary for wave-driven mass loss during late stages of stellar evolution, but it not yet clear if they are sufficient. Further calculations, including hydrodynamic simulations like those of Meakin & Arnett (2006), are necessary to investigate the excitation, propagation, and damping of waves in SN progenitors. Both multi-dimensional hydrodynamic simulations (like those by, e.g., Rogers et al., 2006; Browning et al., 2004) and observations (e.g., Shiode et al. 2013) would provide valuable constraints on the spectrum of wave excitation and thus how much of the full wave energy reservoir can reach the stellar envelope. The principal uncertainty is that only low spherical harmonic degree modes ( a few) can efficiently tunnel from the stellar core to the envelope, so the energetics of wave-driven mass loss depends critically on the fraction of the internal gravity wave power in low degree modes. This in turn likely depends on the convective mach number, the stellar rotation rate (specifically the Rossby number of the convection) and the structure of the convective-radiative transition region. It is possible that no stellar progenitors excite sufficiently low modes in late stages of stellar evolution to power significant mass loss.
The restriction to low modes is also the reason that we have focused on wave excitation by core fusion rather than shell fusion (though Figs 11 & 13 quantify the energetics of shell fusion in our progenitors). Wave excitation by shell fusion is more likely to excite high modes because the size of the convective eddies are limited by the thickness of the shell. On the other hand, waves excited by shell fusion have less of a ‘barrier’ to tunnel through to reach the stellar envelope. Our estimates suggest that core fusion is nonetheless the most promising site for waves capable of powering significant mass loss, but a more definitive conclusion on this question will require fully understanding the power-spectrum of waves excited by stellar convection.
Multi-dimensional hydrodynamical simulations are also needed to better understand the behavior of super-Eddington stellar envelopes. Some authors, including Soker (2013), have suggested that envelope inflation is a more likely outcome than mass ejection or the formation of a super-Eddington wind, which we favor (Shaviv, 2001; Owocki et al., 2004, have also argued for the latter). It is unclear how critical this distinction is: SN ejecta interacting with a significantly inflated (but bound) stellar envelope will produce emission via “circumstellar” interaction similar to that produced by interaction with an unbound outflow.
Since most massive stars are in binary systems, a clear area for future research is the interplay between wave-driven mass loss (and/or radius inflation) and Roche-lobe overflow in close binary systems (see Soker 2013). Mass transfer in a binary may determine the radius of the progenitor at core collapse and influence how much mass is ejected from the binary system during episodes of efficient wave energy deposition in the stellar envelope.
Some of our progenitors are susceptible to wave-driven mass loss at multiple stages during their evolution to collapse. However, at each phase, we have investigated our 1-D stellar evolution model without any enhanced mass loss during prior phases. Future efforts to quantify the potential effect of wave-driven mass loss on the subsequent evolution of a star are necessary to understand the full evolution of progenitors that experience pre-SN outbursts. It is unclear how wave-driven mass loss events would affect the future evolution of the stellar core and envelope, and thus any potential further wave-driven mass loss.
Throughout our investigation, we have ignored the effect of rotation on the excitation, propagation and damping of waves. This is likely to be a rather poor approximation in many cases, especially for our rapidly rotating progenitors. The excitation of modes depends on the statistical properties of convection, which are different in rapidly rotating stars. Rotation also modifies the efficiency of chemical mixing, affects the shape of wave propagation cavities, and can introduce critical damping layers (e.g., Rogers et al., 2012) that might inhibit waves from reaching the stellar surface. We will investigate these effects in future work.
Acknowledgments
We thank Bill Paxton for invaluable support with MESA. We also thank David Arnett, Lars Bildsten, Matteo Cantiello, Dan Kasen, Tony Piro, and Nathan Smith for fruitful discussions. JS would like to thank the organizers and attendees of the Workshop on Outstanding Problems in Massive Star Research - The Final Stages in Minneapolis, MN in 2012 for useful discussions. This work was partially supported by a Simons Investigator award from the Simons Foundation to EQ, the David and Lucile Packard Foundation, and the Thomas and Alison Schneider Chair in Physics at UC Berkeley. Further support was provided by NASA Headquarters under the NASA Earth and Space Science Fellowship Program - Grant 10-Astro10F-0030.
Appendix A: Massive star models
We use version 4789 of the MESA star stellar evolution code (Paxton et al., 2011, 2013) to construct evolutionary sequences of massive stars from the zero-age main sequence (ZAMS) to core collapse. We employed four separate inlists to evolve each progenitor from start to finish.777These will be made available, in full, on http://mesastar.org. The first generates ZAMS models. For masses below 30 M⊙, we use the following non-default parameters
with
for non-solar metallicities and
for rotating models. Above 30 M⊙, we read in an analogous (in terms of rotation and metallicity) 30 M⊙ model stopped at Lnuc_div_L_upper_limit = 0.1 and use
instead of create_pre_main_sequence_model = .true.. The next inlist evolves the ZAMS models through the main sequence using
with overshoot above the H-burning core turned on as during the pre-MS evolution above. The envelope is allowed to more efficiently mix using the “enhanced MLT” scheme with okay_to_reduce_gradT_excess = .true. and velocities are limited to the stellar core using
Resolution is increased by 0.4 in all transition regions. The mass loss schemes are either
or
with Dutch_wind_eta set as described in §III. For rotating models, the diffusion coefficients for rotational mixing are set as the following
The models are stopped when they reach the end of the MS, controlled by the parameters
Beyond the MS, we turn off the overshoot by setting
and evolve the models to central carbon exhaustion at
Finally, we run the models from neon and oxygen burning to core collapse at lower resolution by setting mesh_delta_coeff = 1.0.
This procedure works uninterrupted for the majority of our model grid. However, in some cases it was necessary to change a few of MESA star’s other parameters to aid convergence. For massive stars in which the envelope convection zone reaches deep down towards the hydrogen burning shell during post-ms evolution, we sometimes needed to increase dH_div_H_limit to allow relatively large changes in fractional hydrogen abundance due to the changing mesh at the convective boundary. In a few cases, we needed to increase solver tolerances (tol_correction_norm and tol_max_correction) to ten or 30 times the default during the final evolutionary phases to reach core collapse.
Appendix B: Model Parameters and Results
| Mass Loss∗∗ | Class† | Convective (radiative) core burning time∗∗∗ | |||||||||||||
|---|---|---|---|---|---|---|---|---|---|---|---|---|---|---|---|
| H [Myr] | He [Myr] | C [yr] | Ne [yr] | O [yr] | Si [day] | ||||||||||
| 0.8 (v+dj) | RSG | ||||||||||||||
| 0.8 (v+dj) | RSG | ||||||||||||||
| 0.8 (v+dj) | RSG | ||||||||||||||
| 0.8 (v+dj) | RSG | ||||||||||||||
| 0.6 (v+dj) | RSG | ||||||||||||||
| 0.6 (v+dj) | RSG | ||||||||||||||
| 0.6 (v+dj) | RSG | ||||||||||||||
| 0.8 (v+dj) | BSG | ||||||||||||||
| 0.8 (v+dj) | RSG | ||||||||||||||
| 0.8 (v+dj) | RSG | ||||||||||||||
| 0.8 (v+dj) | RSG | ||||||||||||||
| 0.6 (v+dj) | RSG | ||||||||||||||
| 0.6 (v+dj) | RSG | ||||||||||||||
| 0.8 (v+dj) | BSG | ||||||||||||||
| 0.8 (v+dj) | RSG | ||||||||||||||
| 0.8 (v+dj) | RSG | ||||||||||||||
| 0.8 (v+dj) | RSG | ||||||||||||||
| 0.6 (v+dj) | RSG | ||||||||||||||
| 0.6 (v+dj) | RSG | ||||||||||||||
| 0.6 (v+dj) | WR | ||||||||||||||
| 0.8 (v+dj) | BSG | ||||||||||||||
| 0.8 (v+dj) | RSG | ||||||||||||||
| 0.8 (v+dj) | RSG | ||||||||||||||
| 0.8 (v+dj) | RSG | ||||||||||||||
| 0.6 (v+dj) | RSG | ||||||||||||||
| 0.6 (v+dj) | RSG | ||||||||||||||
| 0.6 (v+dj) | WR | ||||||||||||||
| 0.8 (v+dj) | BSG | ||||||||||||||
| 0.8 (v+dj) | RSG | ||||||||||||||
| 0.8 (v+dj) | RSG | ||||||||||||||
| 0.8 (v+dj) | WR | ||||||||||||||
| 0.6 (v+dj) | BSG | ||||||||||||||
| 0.6 (v+dj) | BSG | ||||||||||||||
| 0.6 (v+dj) | WR | ||||||||||||||
| 0.8 (v+dj) | RSG | ||||||||||||||
| 0.8 (v+dj) | RSG | ||||||||||||||
| 0.8 (v+dj) | BSG | ||||||||||||||
| v+n | WR | ||||||||||||||
| 0.8 (v+dj) | WR | ||||||||||||||
| 0.6 (v+dj) | WR | ||||||||||||||
| 0.6 (v+dj) | WR | ||||||||||||||
| 0.6 (v+dj) | WR | ||||||||||||||
| 0.8 (v+dj) | RSG | ||||||||||||||
| 0.8 (v+dj) | BSG | ||||||||||||||
| 0.8 (v+dj) | BSG | ||||||||||||||
| 0.8 (v+dj) | WR | ||||||||||||||
| v+n | WR | ||||||||||||||
| 0.6 (v+dj) | WR | ||||||||||||||
| 0.6 (v+dj) | WR | ||||||||||||||
| 0.6 (v+dj) | WR | ||||||||||||||
| 0.8 (v+dj) | BSG | ||||||||||||||
| 0.8 (v+dj) | BSG | ||||||||||||||
| 0.8 (v+dj) | BSG | ||||||||||||||
| v+n | WR | ||||||||||||||
| 0.8 (v+dj) | WR | ||||||||||||||
| 0.6 (v+dj) | WR | ||||||||||||||
| 0.6 (v+dj) | WR | ||||||||||||||
| 0.6 (v+dj) | WR | ||||||||||||||
| 0.8 (v+dj) | BSG | ||||||||||||||
| 0.8 (v+dj) | BSG | ||||||||||||||
| 0.8 (v+dj) | BSG | ||||||||||||||
| v+n | WR | ||||||||||||||
| 0.8 (v+dj) | WR | ||||||||||||||
| 0.6 (v+dj) | WR | ||||||||||||||
| 0.6 (v+dj) | WR | ||||||||||||||
| 0.6 (v+dj) | WR | ||||||||||||||
| 0.8 (v+dj) | WR | ||||||||||||||
| v+n | WR | ||||||||||||||
| 0.6 (v+dj) | WR | ||||||||||||||
| 0.6 (v+dj) | WR | ||||||||||||||
| 0.6 (v+dj) | WR | ||||||||||||||
| 0.8 (v+dj) | WR | ||||||||||||||
| v+n | WR | ||||||||||||||
| 0.6 (v+dj) | WR | ||||||||||||||
| 0.6 (v+dj) | WR | ||||||||||||||
| 0.6 (v+dj) | WR | ||||||||||||||
| . | |||||||||||||||
| ∗∗Here, “vdj” is shorthand for the Vink et al. (2001) and de Jager et al. (1988) mass loss prescription combination and the dimensionless efficiency factor is | |||||||||||||||
| shown as a prefactor; “v+n” denotes the Vink et al. (2001) and Nieuwenhuijzen & de Jager (1990) mass loss prescription combination. | |||||||||||||||
| †We define “RSG” as a progenitor that retains its hydrogen envelope and has at core collapse, “BSG” as progenitor with a hydrogen envelope | |||||||||||||||
| and , and a “WR” as a progenitor without hydrogen. | |||||||||||||||
| ‡Helium core mass at core infall; same as the “He core mass” plotted on the abcissa of figs. 4, 12, 14, and 15 | |||||||||||||||
| ∗∗∗Burning lifetimes are determined based on the time it takes for burning to reduce the central abundance of the main fuel below . Except for Ne, | |||||||||||||||
| which does not fully deplete before core oxygen burning, for which we estimate the lifetime based on the start of Ne burning to the start of O burning. Note that | |||||||||||||||
| the lifetime of the central convection zone, when one exists, may be shorter than the lifetime of the burning phase given here (integrated energies relevant for | |||||||||||||||
| excited waves span only the convective lifetime). | |||||||||||||||
| core Ne burning | core O burning | core Si burning | ||||||||||||||||||
|---|---|---|---|---|---|---|---|---|---|---|---|---|---|---|---|---|---|---|---|---|
| Mass Loss | Class | |||||||||||||||||||
| 0.8 (v+dj) | RSG | |||||||||||||||||||
| 0.8 (v+dj) | RSG | |||||||||||||||||||
| 0.8 (v+dj) | RSG | |||||||||||||||||||
| 0.8 (v+dj) | RSG | |||||||||||||||||||
| 0.6 (v+dj) | RSG | |||||||||||||||||||
| 0.6 (v+dj) | RSG | |||||||||||||||||||
| 0.6 (v+dj) | RSG | |||||||||||||||||||
| 0.8 (v+dj) | BSG | |||||||||||||||||||
| 0.8 (v+dj) | RSG | |||||||||||||||||||
| 0.8 (v+dj) | RSG | |||||||||||||||||||
| 0.8 (v+dj) | RSG | |||||||||||||||||||
| 0.6 (v+dj) | RSG | |||||||||||||||||||
| 0.6 (v+dj) | RSG | |||||||||||||||||||
| 0.8 (v+dj) | BSG | |||||||||||||||||||
| 0.8 (v+dj) | RSG | |||||||||||||||||||
| 0.8 (v+dj) | RSG | |||||||||||||||||||
| 0.8 (v+dj) | RSG | |||||||||||||||||||
| 0.6 (v+dj) | RSG | |||||||||||||||||||
| 0.6 (v+dj) | RSG | |||||||||||||||||||
| 0.6 (v+dj) | WR | |||||||||||||||||||
| 0.8 (v+dj) | BSG | |||||||||||||||||||
| 0.8 (v+dj) | RSG | |||||||||||||||||||
| 0.8 (v+dj) | RSG | |||||||||||||||||||
| 0.8 (v+dj) | RSG | |||||||||||||||||||
| 0.6 (v+dj) | RSG | |||||||||||||||||||
| 0.6 (v+dj) | RSG | |||||||||||||||||||
| 0.6 (v+dj) | WR | |||||||||||||||||||
| 0.8 (v+dj) | BSG | |||||||||||||||||||
| 0.8 (v+dj) | RSG | |||||||||||||||||||
| 0.8 (v+dj) | RSG | |||||||||||||||||||
| 0.8 (v+dj) | WR | |||||||||||||||||||
| 0.6 (v+dj) | BSG | |||||||||||||||||||
| 0.6 (v+dj) | BSG | |||||||||||||||||||
| 0.6 (v+dj) | WR | |||||||||||||||||||
| 0.8 (v+dj) | RSG | |||||||||||||||||||
| 0.8 (v+dj) | RSG | |||||||||||||||||||
| 0.8 (v+dj) | BSG | |||||||||||||||||||
| v+n | WR | |||||||||||||||||||
| 0.8 (v+dj) | WR | |||||||||||||||||||
| 0.6 (v+dj) | WR | |||||||||||||||||||
| 0.6 (v+dj) | WR | |||||||||||||||||||
| 0.6 (v+dj) | WR | |||||||||||||||||||
| 0.8 (v+dj) | RSG | |||||||||||||||||||
| 0.8 (v+dj) | BSG | |||||||||||||||||||
| 0.8 (v+dj) | BSG | |||||||||||||||||||
| 0.8 (v+dj) | WR | |||||||||||||||||||
| v+n | WR | |||||||||||||||||||
| 0.6 (v+dj) | WR | |||||||||||||||||||
| 0.6 (v+dj) | WR | |||||||||||||||||||
| 0.6 (v+dj) | WR | |||||||||||||||||||
| 0.8 (v+dj) | BSG | |||||||||||||||||||
| 0.8 (v+dj) | BSG | |||||||||||||||||||
| 0.8 (v+dj) | BSG | |||||||||||||||||||
| v+n | WR | |||||||||||||||||||
| 0.8 (v+dj) | WR | |||||||||||||||||||
| 0.6 (v+dj) | WR | |||||||||||||||||||
| 0.6 (v+dj) | WR | |||||||||||||||||||
| 0.6 (v+dj) | WR | |||||||||||||||||||
| 0.8 (v+dj) | BSG | |||||||||||||||||||
| 0.8 (v+dj) | BSG | |||||||||||||||||||
| 0.8 (v+dj) | BSG | |||||||||||||||||||
| v+n | WR | |||||||||||||||||||
| 0.8 (v+dj) | WR | |||||||||||||||||||
| 0.6 (v+dj) | WR | |||||||||||||||||||
| 0.6 (v+dj) | WR | |||||||||||||||||||
| 0.6 (v+dj) | WR | |||||||||||||||||||
| 0.8 (v+dj) | WR | |||||||||||||||||||
| v+n | WR | |||||||||||||||||||
| 0.6 (v+dj) | WR | |||||||||||||||||||
| 0.6 (v+dj) | WR | |||||||||||||||||||
| 0.6 (v+dj) | WR | |||||||||||||||||||
| 0.8 (v+dj) | WR | |||||||||||||||||||
| v+n | WR | |||||||||||||||||||
| 0.6 (v+dj) | WR | |||||||||||||||||||
| 0.6 (v+dj) | WR | |||||||||||||||||||
| 0.6 (v+dj) | WR | |||||||||||||||||||
| ∗A value is given whenever burning occurs convectively, otherwise is given. | ||||||||||||||||||||
| †Wave energy excited in units of ; a value is given whenever convectively excited waves meet the super-Eddington and leakage conditions, otherwise is given. | ||||||||||||||||||||
| ‡A value is given whenever the super-Eddington, leakage and outflow conditions are met, otherwise is given. | ||||||||||||||||||||
References
- Aldering et al. (1994) Aldering G., Humphreys R. M., Richmond M., 1994, AJ, 107, 662
- Anupama et al. (2009) Anupama G. C., Sahu D. K., Gurugubelli U. K., Prabhu T. P., Tominaga N., Tanaka M., Nomoto K., 2009, MNRAS, 392, 894
- Arnett et al. (2009) Arnett D., Meakin C., Young P. A., 2009, ApJ, 690, 1715
- Arnett & Meakin (2011) Arnett W. D., Meakin C., 2011, ApJ, 733, 78
- Bersten et al. (2012) Bersten M. C. et al., 2012, ApJ, 757, 31
- Brott et al. (2011) Brott I. et al., 2011, A&A, 530, A115
- Browning et al. (2004) Browning M. K., Brun A. S., Toomre J., 2004, ApJ, 601, 512
- Burrows & Goshy (1993) Burrows A., Goshy J., 1993, ApJ, 416, L75
- Chevalier (2012) Chevalier R. A., 2012, ApJ, 752, L2
- Chevalier & Soderberg (2010) Chevalier R. A., Soderberg A. M., 2010, ApJ, 711, L40
- Clayton (1984) Clayton D. D., 1984, Principles of stellar evolution and nucleosynthesis. Chicago: The University of Chicago Press
- de Jager et al. (1988) de Jager C., Nieuwenhuijzen H., van der Hucht K. A., 1988, A&AS, 72, 259
- Filippenko (1997) Filippenko A. V., 1997, ARA&A, 35, 309
- Foley et al. (2007) Foley R. J., Smith N., Ganeshalingam M., Li W., Chornock R., Filippenko A. V., 2007, ApJ, 657, L105
- Fox et al. (2011) Fox O. D. et al., 2011, ApJ, 741, 7
- Fox et al. (2013) Fox O. D., Filippenko A. V., Skrutskie M. F., Silverman J. M., Ganeshalingam M., Cenko S. B., Clubb K. I., 2013, ArXiv e-prints
- Fraser et al. (2013) Fraser M. et al., 2013, ArXiv e-prints
- Fynbo et al. (2005) Fynbo H. O. U. et al., 2005, Nature, 433, 136
- Gal-Yam (2012) Gal-Yam A., 2012, Science, 337, 927
- Ginzburg & Balberg (2012) Ginzburg S., Balberg S., 2012, ApJ, 757, 178
- Goldreich & Kumar (1990) Goldreich P., Kumar P., 1990, ApJ, 363, 694
- Grevesse & Sauval (1998) Grevesse N., Sauval A. J., 1998, Space Sci. Rev., 85, 161
- Hachinger et al. (2012) Hachinger S., Mazzali P. A., Taubenberger S., Hillebrandt W., Nomoto K., Sauer D. N., 2012, MNRAS, 422, 70
- Imbriani et al. (2005) Imbriani G. et al., 2005, European Physical Journal A, 25, 455
- Immler et al. (2008) Immler S. et al., 2008, ApJ, 674, L85
- Kiewe et al. (2012) Kiewe M. et al., 2012, ApJ, 744, 10
- Kippenhahn & Weigert (1990) Kippenhahn R., Weigert A., 1990, Stellar Structure and Evolution. Berlin: Springer Publishing House
- Kochanek (2011) Kochanek C. S., 2011, ApJ, 743, 73
- Kunz et al. (2002) Kunz R., Fey M., Jaeger M., Mayer A., Hammer J. W., Staudt G., Harissopulos S., Paradellis T., 2002, ApJ, 567, 643
- Lecoanet & Quataert (2013) Lecoanet D., Quataert E., 2013, MNRAS, 430, 2363
- Li et al. (2011) Li W. et al., 2011, MNRAS, 412, 1441
- Margutti et al. (2013) Margutti R. et al., 2013, ArXiv e-prints
- Mauerhan et al. (2013) Mauerhan J. C. et al., 2013, MNRAS, 430, 1801
- Meakin & Arnett (2006) Meakin C. A., Arnett D., 2006, The Astrophysical Journal, 637, L53, (c) 2006: The American Astronomical Society
- Moriya & Tominaga (2012) Moriya T. J., Tominaga N., 2012, ApJ, 747, 118
- Murphy et al. (2004) Murphy J. W., Burrows A., Heger A., 2004, ApJ, 615, 460
- Nieuwenhuijzen & de Jager (1990) Nieuwenhuijzen H., de Jager C., 1990, A&A, 231, 134
- Ofek et al. (2013a) Ofek E. O., Lin L., Kouveliotou C., Younes G., Göǧüş E., Kasliwal M. M., Cao Y., 2013a, ApJ, 768, 47
- Ofek et al. (2010) Ofek E. O. et al., 2010, ApJ, 724, 1396
- Ofek et al. (2013b) Ofek E. O. et al., 2013b, Nature, 494, 65
- Owocki et al. (2004) Owocki S. P., Gayley K. G., Shaviv N. J., 2004, ApJ, 616, 525
- Pastorello et al. (2007) Pastorello A. et al., 2007, Nature, 447, 829
- Paxton et al. (2011) Paxton B., Bildsten L., Dotter A., Herwig F., Lesaffre P., Timmes F., 2011, ApJS, 192, 3
- Paxton et al. (2013) Paxton B. et al., 2013, ArXiv e-prints
- Piro & Chang (2008) Piro A. L., Chang P., 2008, ApJ, 678, 1158
- Press (1981) Press W. H., 1981, ApJ, 245, 286
- Quataert & Shiode (2012) Quataert E., Shiode J., 2012, MNRAS, 423, L92
- Rakavy et al. (1967) Rakavy G., Shaviv G., Zinamon Z., 1967, ApJ, 150, 131
- Rogers & Iglesias (1992) Rogers F. J., Iglesias C. A., 1992, ApJS, 79, 507
- Rogers et al. (2006) Rogers T. M., Glatzmaier G. A., Jones C. A., 2006, ApJ, 653, 765
- Rogers et al. (2012) Rogers T. M., Lin D. N. C., Lau H. H. B., 2012, ApJ, 758, L6
- Sana et al. (2012) Sana H. et al., 2012, Science, 337, 444
- Shaviv (2001) Shaviv N. J., 2001, Monthly Notices of the Royal Astronomical Society, 326, 126, (c) 2001 The Royal Astronomical Society
- Shiode et al. (2013) Shiode J. H., Quataert E., Cantiello M., Bildsten L., 2013, MNRAS, 430, 1736
- Smith (2008) Smith N., 2008, in IAU Symposium, Vol. 250, IAU Symposium, Bresolin F., Crowther P. A., Puls J., eds., pp. 193–200
- Smith & Arnett (2013) Smith N., Arnett D., 2013, ArXiv e-prints
- Smith & McCray (2007) Smith N., McCray R., 2007, ApJ, 671, L17
- Soker (2013) Soker N., 2013, ArXiv e-prints
- Spruit (2002) Spruit H. C., 2002, A&A, 381, 923
- Suárez-Madrigal et al. (2013) Suárez-Madrigal A., Krumholz M., Ramirez-Ruiz E., 2013, ArXiv e-prints
- Unno et al. (1989) Unno W., Osaki Y., Ando H., Saio H., Shibahashi H., 1989, Nonradial oscillations of stars, 2nd ed. Tokyo: University of Tokyo Press
- Van Dyk et al. (2013) Van Dyk S. D. et al., 2013, ApJ, 772, L32
- Vink et al. (2001) Vink J. S., de Koter A., Lamers H. J. G. L. M., 2001, A&A, 369, 574
- Woosley et al. (2002) Woosley S. E., Heger A., Weaver T. A., 2002, Reviews of Modern Physics, 74, 1015