Evolution of the Superconductivity Dome in the two dimensional Hubbard Model
Abstract
In a recent publication [Chen et al., Phys. Rev. B 86, 165136 (2012)], we identified a line of Lifshitz transition points separating the Fermi liquid and pseudogap regions in the hole-doped two dimensional Hubbard model. Here we extend the study to further determine the superconducting transition temperature in the phase diagram. By means of large-scale dynamical cluster quantum Monte Carlo simulations, we are able to identify the evolution of the -wave superconducting dome in the hole-dope side of the phase diagram, with next-nearest-neighbor hopping (), chemical potential and temperature as control parameters. To obtain the superconducting transition temperature , we employ two-particle measurements of the pairing susceptibilities. As goes from positive to negative values, we find the -wave projected irreducible pairing vertex function is enhanced, and the curvature of its doping dependence changes from convex to concave, which fixes the position of the maximum superconducting temperature at the same filling () and constraints the dome from precisely following the Lifshitz line. We furthermore decompose the irreducible vertex function into fully irreducible, charge and spin components via the parquet equations, and consistently find that the spin component dominates the pairing vertex function in the doping range where the dome is located. Our investigations deepen the understanding of the phase diagram of the two dimensional Hubbard model, and more importantly pose new questions to the field. For example, we found as goes from positive to negative values, the curvature of the pairing strength as a function of doping changes from convex to concave, and the nature of the dominant fluctuations changes from charge degree of freedom to spin degree of freedom. The study of these issues will lead to further understanding of the phase diagram of the two dimensional Hubbard model and also the physics of the hole-doped cuprate high temperature superconductors.
pacs:
74.40.Kb, 71.10.Fd, 74.72.-h, 71.10.HfI Introduction
The phase diagram of the hole-doped two-dimensional Hubbard model in the strongly correlated regime contains many interesting features resembling those observed in the high- cuprate superconductors Norman (2013); Anderson et al. (2004). At a qualitative level, it is accepted that the generic ingredients of the cuprate physics are captured by the one band Hubbard model on the square lattice Phillips and Jarrell (2010); Alloul (2013). For example, the Fermi surface reconstruction is observed in the study of the Hubbard model on the square lattice as the doping concentration is varied Chen et al. (2011, 2012). Starting from the overdoped Fermi liquid, with an electron-like Fermi surface, quadratic resistivity in temperature and well-defined quasiparticles, the system exhibits around optimal doping for the temperature regime studied a vanishing quasiparticle weight on the Fermi surface and a linear resistivity, reminiscent of a marginal Fermi liquid Varma et al. (1989); Varma (1999). At smaller doping concentrations, the system enters a pseudogap region where the density of states is further suppressed close to the Fermi level, and the topology of the Fermi surface changes to hole-like. Eventually at half-filling, a Mott gap opens and antiferromagnetic order sets in.
Among the many interesting questions concerning the phase diagram of the hole-doped Hubbard model on a square lattice, the presence of the -wave superconducting dome, as observed in the cuprate superconductors, is the central one. It is commonly accepted that the physics of cuprates is due to moderate to strong electronic correlations. Therefore, any study of low-temperature properties faces the difficulty that one cannot employ conventional perturbative methods to obtain reliable information. In this paper, we address the existence of a -wave superconductivity dome in the Hubbard model directly using large-scale dynamical cluster quantum Monte Carlo simulations Hettler et al. (1998, 2000); Jarrell et al. (2001); Maier et al. (2005). Based on the understanding obtained in this and previous numerical works Macridin et al. (2006); Vidhyadhiraja et al. (2009); Mikelsons et al. (2009); Liebsch and Tong (2009); Khatami et al. (2010); Lin et al. (2010); Gull et al. (2010); Sakai et al. (2010); Yang et al. (2011); Galanakis et al. (2011); Chen et al. (2011, 2012); Sordi et al. (2012); Sakai et al. (2012); Gull et al. (2013), we furthermore map the evolution of the -wave superconductivity dome in the parameter space of the phase diagram.
In order to put this work into the proper perspective, it is worthwhile to recapitulate our knowledge about the phase diagram of the two-dimensional Hubbard model. Using large-scale dynamical cluster quantum Monte Carlo simulations, the phase diagram of the two-dimensional Hubbard model near quantum critical filling (optimal filling or doping) was mapped out in a series of numerical works Macridin et al. (2006); Vidhyadhiraja et al. (2009); Mikelsons et al. (2009); Khatami et al. (2010); Yang et al. (2011); Galanakis et al. (2011); Chen et al. (2011, 2012). The control parameters are the next-nearest-neighbor hopping (), chemical potential (or doping concentration) and temperature. At positive , there is a first-order phase separation transition occurring at finite temperature. The two phases being separated are an incompressible Mott liquid and a compressible Mott gas; these two phases are adiabatically connected to the pseudogap and the Fermi liquid states at . The first order line of coexistence terminates at a second order point where the charge susceptibility diverges Macridin et al. (2006); Mikelsons et al. (2009); Khatami et al. (2010); Galanakis et al. (2011). As , this critical point extrapolates continuously to zero temperature and thus becomes the quantum critical point (QCP) underneath the superconducting dome Yang et al. (2011). Above the QCP, a V-shaped quantum critical region separates the pseudogap and the Fermi liquid phases Vidhyadhiraja et al. (2009); Chen et al. (2011).
When the next-nearest-neighbor hopping becomes negative, , which is relevant for the hole-doped cuprates, the physics becomes more interesting Chen et al. (2011, 2012). We find at , as the doping concentration varies from the overdoped to the underdoped regime, the Fermi surface changes its topology from electron-like with complete Fermi surface to hole-like with a pseudogap in the anti-nodal direction. Such a topological transition in the Fermi surface is a Lifshitz transition Lifshitz (1960); Yamaji et al. (2006); Imada et al. (2010, 2011); Chen et al. (2012). It is furthermore concomitant with a van Hove singularity in the density of states crossing the Fermi level at a doping which occurs very close to (if not at) the quantum critical point. Interestingly, we find the quantum critical phenomena prevail along the line of Lifshitz transition for negative . The temperature dependence of the correlation effects close to the van Hove singularities, and its influence on quantities like the quasiparticle fraction and the pairing polarization are very different from those found in the traditional van Hove scenarios Hirsch and Scalapino (1986); Markiewicz (1997).
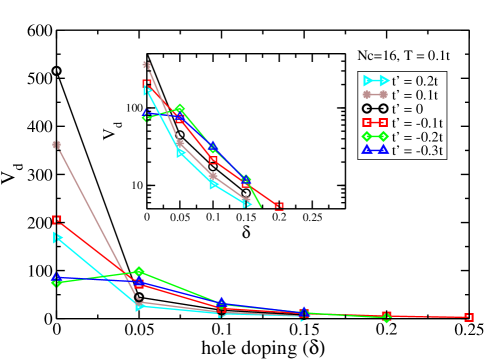
A schematic phase diagram based on these studies is provided in Fig. of Ref. Chen et al., 2012. However, the position of the superconducting dome and its evolution in the negative side of the phase diagram have not been addressed. From our previous work Yang et al. (2011); Chen et al. (2012) we understand that the formation of the -wave superconducting dome is due to two competing factors: the effective pairing strength and the -wave pairing bubble . When , decreases monotonically as a function of doping while the shows algebraic divergence () near the quantumcritical doping (Lifshitz doping) and a much slower dependence in the pseudogap and Fermi liquid regions. The combined effect of the monotonic decay of and the algebraic divergence of results in the maximum of the dome occurring near the critical doping.
In this paper we extend the study of the -wave pairing and the superconducting dome to the negative side of the phase diagram. To this end, we include extensive two-particle measurements into the dynamical cluster quantum Monte Carlo simulations. This allows to measure the -wave pairing susceptibility directly, and obtains the superconducting transition temperature from its divergence. We find that the superconducting dome is located around the quantum critical doping, and furthermore follows its evolution into negative values. The evolution of the dome is subtle, in the sense that its peak stays close to the same filling (), whereas the whole dome moves outside towards higher doping, following the direction of the Lifshitz line. The -wave projected irreducible pairing vertex function (the effective pairing strength ) is enhanced as changes from positive to negative values, in the under- and optimal-doped regions. The doping dependence of the effective pairing strength, changes its curvature from convex to concave as goes to negative values, which fixes the position of the maximum superconducting temperature (the peak of the dome) at the same filling () and constraints the dome from precisely following the Lifshitz line. Therefore, the asymmetry of the superconducting dome becomes more pronounced when goes to negative values due to the non-trivial doping dependence of . The vertex decomposition via parquet equations furthermore reveals that in the negative side of the phase diagram, the effective pairing strength is dominated by magnetic fluctuations associated with the antiferromagnetic order at momentum transfer .
The paper is organized as follows. Section II outlines the model and the methods used in this study: the dynamical cluster approximation (DCA) with weak-coupling continuous-time quantum Monte Carlo (CTQMC) as its cluster solver. We explain in detail how the two-particle vertex function and its decomposition has been included into our DCA/CTQMC simulations. Section III and IV contain our numerical results and discussion, beginning with -wave pairing susceptibility and the evolution of the superconducting dome as a function of , and followed by a detailed account of the irreducible pairing vertex function and its decomposition via parquet equations. We then provide results on the cluster spin susceptibility at a fixed filling and various . We use a schematic quantum critical phase diagram of the model to summarize our results. We end with conclusions and an overview of open questions in Section V.
II Formalism
The model we study in this paper is the Hubbard model on a square lattice
| (1) |
where is the creation (annihilation) operator for electrons with wavevector and spin , is the chemical potential, is the number operator, is the on-site Coulomb repulsion, and the bare dispersion is given by
| (2) |
with and being the hopping amplitudes between nearest and next-nearest-neighbor sites respectively.
We use the DCA Hettler et al. (1998, 2000) with interaction-expansion CTQMC Rubtsov et al. (2005) as a cluster solver. The DCA is a mean-field theory on clusters that maps the lattice of the original system onto a periodic cluster of size ( is the dimensionality) embedded in a self-consistently determined host. The spatial short-ranged correlations (up to ) are treated explicitly while the long-ranged correlations are taken into account in a mean-field approximation. In this paper we study cluster sizes of and , and compared results with other cluster sizes in previous studies Maier et al. (2006a); Vidhyadhiraja et al. (2009); Mikelsons et al. (2009); Khatami et al. (2010); Galanakis et al. (2011); Yang et al. (2011); Chen et al. (2011, 2012). The energy unit is , and the interaction strength is set as . The interaction-expansion CTQMC solver treats the temporal correlations, especially important for quantum criticality, for all cluster sizes. In our simulation, we can achieve temperatures as low as () before a serious minus-sign problem renders the data untrustable.
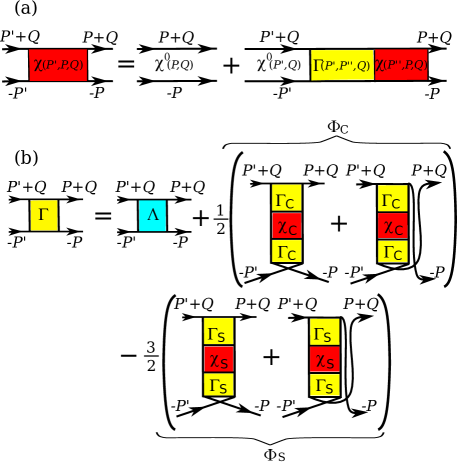
The self-consistent loop of the DCA is built at the single-particle level, hence we can obtain the lattice Green function and self-energy , and perform their analytical continuation using the Maximum Entropy Method (MEM) Jarrell and Gubernatis (1996); Wang et al. (2009); Chen et al. (2011, 2012) to obtain the real-frequency single-particle quantities such as , , local density of states and spectral function . However, to obtain various susceptibilities and vertex functions, we need to go to the two-particle level in our DCA/CTQMC simulations. To this end, we measure the two-particle Green function, , where the four-momentum notation and are introduced, with , are momentum points on the cluster, and and are fermionic and bosonic Matsubara frequencies, respectively. From the two-particle Green function, we extract the irreducible vertex function, , via the Bethe-Salpeter equation. Fig. 1 (a) demonstrates an example of the Bethe-Salpeter equation in the particle-particle pairing channel. The bare bubble entering the Bethe-Salpeter equation is obtained from the fully dressed single-particle Green function, coarse-grained from lattice to cluster. Once we have the irreducible vertex, , the lattice susceptibility can be calculated from , where the summation is over all the frequency and momentum indices. Since the square lattice Hubbard model exhibits -wave superconductivity, the lattice -wave susceptibility, , is obtained by projecting the pairing susceptibility with the -wave form factor via . The superconducting transition temperature can be determined by extrapolating to zero.
To further explore the pairing mechanism, we decompose the irreducible pairing vertex , by means of the parquet equation Bulut et al. (1993); Maier et al. (2006a); Yang et al. (2009, 2011); Chen et al. (2013), into three independent contributions, , as shown in Fig. 1 (b). These three contributions are the fully irreducible vertex , the charge () component , and the spin () component . We further project both sides of the equation with the -wave form factor. For example, the effective -wave pairing strength, is given by . Such vertex decomposition approach tells which component contributes most to the irreducible pairing vertex. One important point to note is that as we have controlled information about the two particle vertex function in momentum and frequency, we do not need to assume any kind of pairing mechanism a priori, but can numerically identify the channel which is dominant in the pairing interaction. This is a qualitative improvement over typical effective weak-coupling approaches where one channel (usually spin) is always assumed to dominate. As it will become clear later, we have obtained convincing numerical evidence that, at , the spin component not only dominates but also has the maximum value with the momentum transfer , revealing that the superconducting pairing strength is mainly due to the antiferromagnetic fluctuations.
III Results
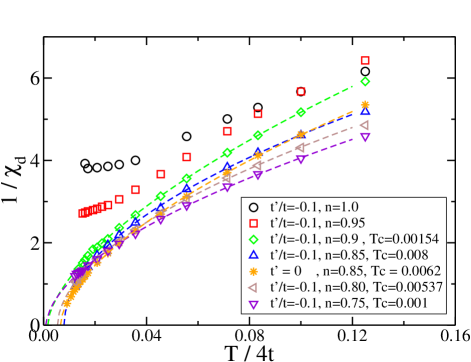
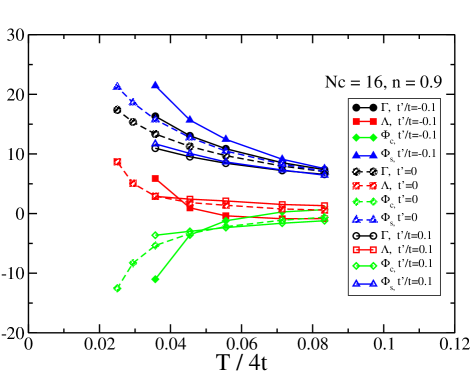
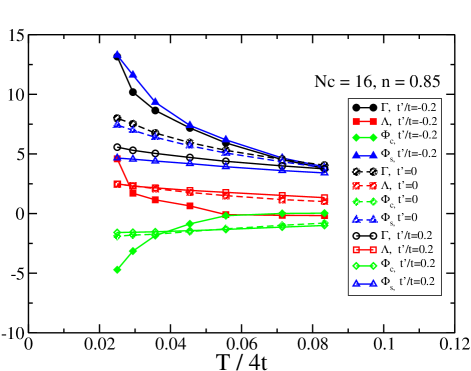
The left panel of Fig. 2 displays the -wave pairing susceptibility for and doping concentration varying from half-filling to overdoped. Also, results for at are shown. At or close to half-filling, , , where the system is inside the insulating or the pseudogap regions, the pairing susceptibility does not diverge at low temperatures. By increasing the doping beyond the pairing susceptibility becomes diverging at a finite . The value of grows as the doping level changes from underdoped toward optimal doping at filling . For higher doping, decreases and the -wave superconducting dome eventually takes shape. Interestingly, above the optimal doping, we have observed marginal Fermi liquid behavior with self-energy linear on frequency and resistivity linear on temperature Mikelsons et al. (2009); Chen et al. (2011, 2012).
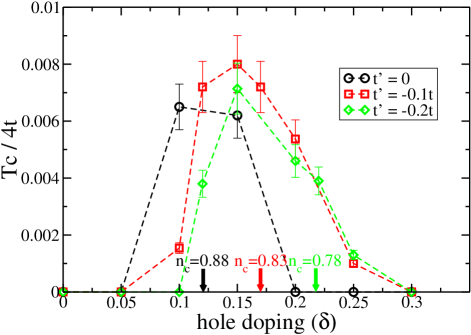
The right panel of Fig. 2 shows the extrapolated as function of doping for , and . Two interesting observations can be made. First, as becomes negative, the -wave superconducting transition temperature increases, while the highest occurs around . For more negative values of , e.g., , , decreases. Therefore, the superconducting dome evolves into a mountain-type volume in the vs phase diagram. Second, we find that as becomes more negative, the superconducting dome moves slightly towards higher doping. At first glance, this behavior seems to resemble the one of the Lifshitz line identified in Ref. Chen et al., 2012. The Lifshitz line traces those values of doping and where the interaction-induced van Hove singularity crosses the Fermi level. Note we have pointed out the correspond quantum critical Lifshitz fillings, , for , and by bold arrows in the right panel of Fig. 2. Naively, one would expect the Lifshitz filling to be associated with the maximum pairing interaction and transition temperature. However, inspecting the behavior more quantitatively, the maximum of the dome actually stay close to n=0.85 and does not fully follow the Lifshitz line. We thus have to conclude that the interaction-induced van Hove singularity alone does not determine the superconducting transition, at least not the position of the highest transition temperature.
To understand this behavior, we explore the projected irreducible -wave pairing vertex, , as function of doping for various using a site cluster and temperature (Figure 3). Since is the effective pairing strength, the BCS condition is roughly equivalent to the divergence of the -wave pairing susceptibility Maier et al. (2006b); Yang et al. (2011). In our previous work Yang et al. (2011); Chen et al. (2012), we found that at decays monotonically as a function of doping, forming a convex function. has an algebraic temperature dependence at the quantum critical filling and is much less sensitive to temperature at other fillings. The combined doping dependence of and gives rise to the superconducting dome at with its peak located close to the quantum critical filling. Here, as shown in Fig. 3, we find that develops a more complicated doping dependence for different values of . In general, it is largest at half-filling and decays to smaller values at larger doping. However, displays non-trivial features in the underdoped and optimally doped regions. The inset to Fig. 3, where the data are presented in semi-log fashion, shows that for doping , , and the value of systematically increases when goes from positive to negative values. In particular, at and , the value of is larger than that at half filling. The curvature of the doping dependence of the effective pairing strength, , changes from a convex function for to a concave one for . However, the enhancement of stops beyond , and starts to strongly decrease also as a function of .
Putting all these observations together, it is evident that develops a non-trivial landscape as function of and . At half-filling, is largest for , and decays as increases. This behavior is easily understood as introduces frustration into the system and suppresses the tendency towards antiferromagnetic order. This symmetry is destroyed for finite doping. In the underdoped and optimally doped region, is enhanced as goes from positive to negative values, and finally decays once becomes very negative. Furthermore, the doping dependence of , changes from a convex to a concave function for negative . We think the concave curvature of at negative is responsible for the fixed position of the peak in the superconducting dome at different . In addition, the faster decay of with doping at negative , due to its concave nature, actually constraints the dome to be further pushed to higher doping, even though the Lifshitz line moves towards higher doping at negative . The different behaviors of for positive and negative reflects the previous observation that in lieu of superconductivity the states in those two regions are fundamentally different. For example for n=0.85, the system is a Fermi liquid state for , while it resides in the pseudogap phase for Chen et al. (2012).
To furthermore explore the pairing mechanism, we performed a decomposition of the irreducible pairing vertex via the parquet equations Maier et al. (2006a); Yang et al. (2009); Chen et al. (2013) as described in section II. The results are shown in Fig. 4. The left panel is the vertex decomposition for filling and , and . The behavior of is consistent with the one of from Fig. 3. For a fixed temperature, increases as changes from to , and the increase becomes enhanced at lower temperatures. The dominant contribution to for , and comes from the magnetic component . The same observations hold for the right panel of Fig. 4, which corresponds to a filling . In fact, we also find from the vertex decomposition that the momentum dependence of is peaked at the momentum transfer , associated with the antiferromagnetic fluctuations of the square lattice Maier et al. (2006a).
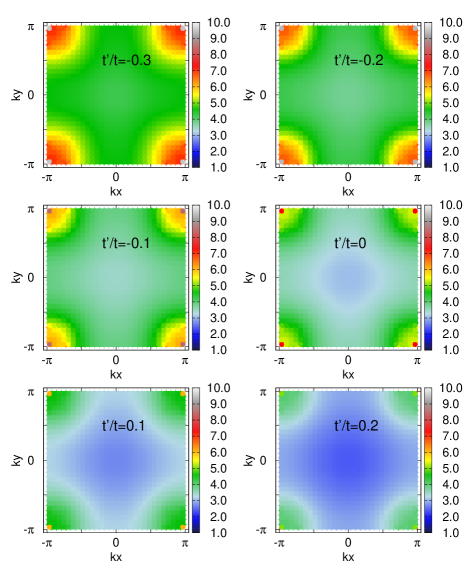
To clearly demonstrate the difference in the antiferromagnetic fluctuations at and , we measure the cluster spin susceptibility for , filling (doping ), and temperature , and we interpolate throughout the entire Brillouin Zone (BZ). The results are shown in Fig. 5. As one can see, becomes stronger as goes from positive () to negative () values, i.e. the antiferromagnetic fluctuations are indeed stronger for the negative side. Together with the findings for the pairing strength and the decomposition of the irreducible pairing vertex into its different components, the behavior of the spin susceptibility makes the picture clearer. As mentioned previously, the system is a conventional Fermi liquid for , but in the pseudogap phase for . Obviously, the different physical properties are intimately connected with the spin fluctuations, as Fig. 5 shows. From Fig. 4 of our previous publication Chen et al. (2012), we learned that the Fermi surface for is electron-like at and hole-like at . The electron-like Fermi surface does not occupy the regions in the BZ close to and , hence the system cannot respond to the antiferromagnetic fluctuations; however, for the hole-like Fermi surface, regions close to and are occupied, and the electrons there can couple to the antiferromagnetic fluctuation efficiently. From the vertex decomposition in Fig. 4 we also know that the antiferromagnetic fluctuations are strongest at the momentum transfer connecting and . Hence, for the system at optimal filling is a stable Fermi liquid, whereas for it is already inside the pseudogap region with electrons at the antinodal to momenta coupled strongly by antiferromagnetic fluctuations.
Previous studies Honerkamp and Salmhofer (2001) have suggested that for strongly negative () and close the so-called van-Hove filling, a ferromagnetic phase with a tendency towards p-wave superconductivity might appear. It surely is interesting to investigate whether this weak coupling prediction for large negative values of is still valid in the strongly correlated system we study here.
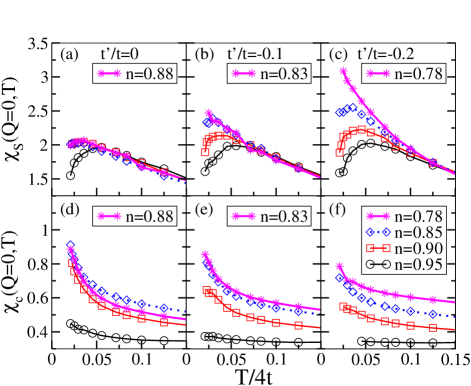
To further probe our model we calculate the bulk spin and charge susceptibilities. Fig. 6 (a), (b) and (c) show the bulk spin susceptibility, , at different , and and fillings and the corresponding quantum critical Lifshitz filling at that value of , . Panels (d), (e), and (f) display for the same values of and filling. The maximum of the bulk spin susceptibility is used to determine the pseudogap temperature Alloul et al. (1989); Vidhyadhiraja et al. (2009); Sordi et al. (2012). One can see in all the three cases, is highest close to half-filling (), and gradually reduces as the doping increases. The lines with star symbols correspond to the Lifshitz filling Chen et al. (2012), , at which the Fermi surface changes its topology from electron-like to hole-like. As we have pointed out previously Chen et al. (2012), the slope of as a function of doping becomes less steep as goes to negative values, which means that the quantum critical region in the phase diagram becomes wider on the negative side; it is also interesting that for negative , for the Lifshitz doping seems to diverge as . If this behavior is followed in an extended temperature region, it would be consistent with a marginal Fermi liquid picture. The divergence of in Fig. 6 (c), as well as the enhanced antiferromagnetic fluctuations observed in Fig. 5, convey the picture that as goes from positive to negative values, the dominant fluctuations in the pseudogap and superconducting regions change in a very subtle manner. At , charge fluctuations are strongest close to the maximum of the superconducting dome, as evident from the diverging charge susceptibility, , in Fig. 6 (d). However, at , the charge susceptibility at all fillings including is suppressed, and at the same time the spin susceptibility becomes more diverging. This observation is consistent with our previous results, Khatami et al. (2010); Chen et al. (2012) where we showed that charge fluctuations indeed dominate in the vicinity of the finite temperature classical critical points for . However, as becomes negative, charge fluctuations are suppressed in the doping region corresponding to the superconducting and pseudogap states. In these parameter regime, spin fluctuations become greatly enhanced, and from Fig. 4 we see the spin component dominates the pairing interaction. Such a change of dominant fluctuations from charge to spin, as changes sign, is highly non-trivial and needs further analysis and understanding.
IV Discussion
Quantum criticality is one of the driving forces behind many of the unconventional superconductors known today. Most prominent examples are the heavy fermions based on lanthanide or actinide inter-metallics Stewart (1984); Loehneysen et al. (1997) and possibly also the iron pnictides Walmsley et al. (2013); Shibauchi et al. (2013). For the latter materials, the QCP has been unambiguously identified as driven by spin fluctuations, although the precise mechanism – Hertz-Millis type spin-waves Hertz (1976); Millis (1993) or Coleman-Si type local quantum criticality Abrahams and Si (2011); Gegenwart et al. (2008) – has not been unanimously settled yet.
The situation is even worse in the case of cuprate high- superconductors. Here, all experimental evidence points towards a QCP just below the dome, but its nature is completely open. There are several competing scenarios. Varma, for example, favors a loop-current type QCP, based on the analysis of the marginal Fermi liquid in terms of symmetry arguments He and Varma (2012); Varma (2013). The success of the spin-fluctuation approach to explain both the superconducting dome and the anomalous features above it would point towards a spin-wave type QCP, but in the region of optimal doping there is no real evidence for something along that line. Others propose some hidden control parameter, driving the system off the QCP at the physically relevant values Sachdev (2012); Sachdev et al. (2012); Vojta (2009). Finally, the Lifshitz transition scenario Hackl and Vojta (2010), possibly supported by the stripes sometimes observed Vojta (2012), is another candidate.
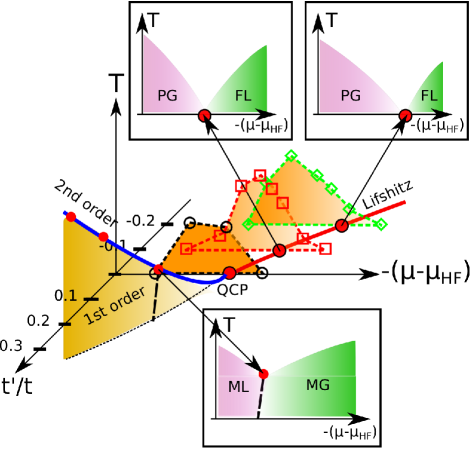
Based on our DCA/CTQMC simulations for the two-dimensional Hubbard model, we can support a combination of the latter two scenarios. As presented in the schematic phase diagram of Fig. 7, for we indeed find a line of phase transitions between a Mott liquid and a Mott gas. The interesting point is that the QCP for this phase transition lies right at , and is continued by a line of Lifshitz points for , separating pseudogap and Fermi liquid regions. For not too large the system can still take advantage of the quantum fluctuations present in the vicinity of the QCP, which usually leads to superconductivity. The somewhat counter-intuitive observation however is, that the dome does not follow the Lifshitz line, but has a much weaker dependence in doping. Such a complicated behavior could however be understood by studying the pairing strength (see Fig. 3). The curvature of the doping dependence of changes from convex to concave function as changes its sign. This fixes the position of the peak of the superconducting dome to the same optimal filling of for all studied. On the other hand, the faster decay of at higher doping due to its concave curvature constraints the dome to extend to higher doping at negative , although the Lifshitz line does so. Along the Lifshitz line, we furthermore observe that the spin fluctuations become enhanced over the charge fluctuations (see Fig. 6), which are dominant at .
We interpret this behavior in terms of the vicinity to the Mott liquid present at , which favors local moment formation and hence enhanced spin fluctuations in two-dimensions. For superconductivity is inhibited by the presence of the Mott liquid, which is adiabatically connected to the pseudogap phase for , where the superconductivity can survive longer (left of the Lifshitz line in Fig. 7). This is due not only to the quantum critical fluctuations associated with the QCP, but a cooperation of incipient quasiparticle formation in the pseudogap phase together with surviving spin fluctuations from the latter. It is noteworthy that the Lifshitz line actually seems to be the line where superconductivity terminates or becomes dramatically suppressed; right to the Lifshitz line there are well-developed quasiparticle, but no strong enough fluctuations to support superconductivity.
V Conclusion
Using large-scale dynamical cluster quantum Monte Carlo simulations, we map out the phase diagram of the two dimensional Hubbard model in the vicinity of the quantum critical filling. The control parameters of our simulation are temperature , chemical potential, and the next-nearest-neighbor hopping . We also include extensive two-particle measurements into the simulations to measure the -wave pairing susceptibility directly. We can determine the superconducting transition temperature by extrapolating the inverse of the -wave pairing susceptibility to zero. Then we find the superconducting dome is located around the quantum critical Lifshitz doping, and furthermore follow its evolution to the negative side of the phase diagram. However, the evolution of the dome is subtle, since its peak stays close to the same filling (), whereas the whole dome moves towards higher doping, following the trend of the Lifshitz line. The -wave projected irreducible pairing vertex function or effective pairing strength is enhanced as changes from positive to negative values in the under- and optimal-doped regions. The doping dependence of the effective pairing strength, changes its curvature from convex to concave as goes to negative values, which fixes the position of the maximum superconducting temperature at a filling of and further restricts the dome from following the Lifshitz line. The vertex decomposition via parquet equations furthermore reveals that in the negative side of the phase diagram, the effective pairing strength is dominated by magnetic fluctuations associated with the antiferromagnetic order at momentum transfer . Many interesting questions still remain, particularly, the reason of the changing curvature of the effective pairing strength , and the change on the character of the dominant fluctuations from charge at to spin at , and require further detailed investigations.
Acknowledgements.
We would like to thank Ka-Ming Tam, Pablo Rodriguez, and Karlis Mikelsons for useful conversations. We thank Joseph Betouras, Jan Zannen, Henri Alloul, Zheng-Yu Weng and Alejandro Muramatsu for valuable discussions. This work is supported by NSF grants OISE-0952300 and DMR-0706379, and the NSF EPSCoR Cooperative Agreement No. EPS-1003897 with additional support from the Louisiana Board of Regents. TP acknowledges support by the DFG through the collaborative research center CRC 602 and the research unit FOR 1807. Supercomputer support was provided by the NSF Extreme Science and Engineering Discovery Environment (XSEDE) under grant number DMR100007, the Louisiana Optical Network Initiative, and HPC@LSU computing resources.References
- Norman (2013) M. R. Norman, arXiv:1302.3176 (2013).
- Anderson et al. (2004) P. W. Anderson, P. A. Lee, M. Randeria, T. M. Rice, N. Trivedi, and F. C. Zhang, J. Phys. Condens. Matter 16, R755 (2004).
- Phillips and Jarrell (2010) P. Phillips and M. Jarrell, Phys. Rev. Lett. 105, 199701 (2010).
- Alloul (2013) H. Alloul, arXiv:1302.3473 (2013).
- Chen et al. (2011) K.-S. Chen, S. Pathak, S.-X. Yang, S.-Q. Su, D. Galanakis, K. Mikelsons, M. Jarrell, and J. Moreno, Phys. Rev. B 84, 245107 (2011).
- Chen et al. (2012) K.-S. Chen, Z. Y. Meng, T. Pruschke, J. Moreno, and M. Jarrell, Phys. Rev. B 86, 165136 (2012).
- Varma et al. (1989) C. M. Varma, P. B. Littlewood, S. Schmitt-Rink, E. Abrahams, and A. E. Ruckenstein, Phys. Rev. Lett. 63, 1996 (1989).
- Varma (1999) C. M. Varma, Phys. Rev. Lett. 83, 3538 (1999).
- Hettler et al. (1998) M. H. Hettler, A. N. Tahvildar-Zadeh, M. Jarrell, T. Pruschke, and H. R. Krishnamurthy, Phys. Rev. B 58, R7475 (1998).
- Hettler et al. (2000) M. H. Hettler, M. Mukherjee, M. Jarrell, and H. R. Krishnamurthy, Phys. Rev. B 61, 12739 (2000).
- Jarrell et al. (2001) M. Jarrell, T. Maier, C. Huscroft, and S. Moukouri, Phys. Rev. B 64, 195130 (2001).
- Maier et al. (2005) T. Maier, M. Jarrell, T. Pruschke, and M. H. Hettler, Rev. Mod. Phys. 77, 1027 (2005).
- Macridin et al. (2006) A. Macridin, M. Jarrell, and T. Maier, Phys. Rev. B 74, 085104 (2006).
- Vidhyadhiraja et al. (2009) N. S. Vidhyadhiraja, A. Macridin, C. Sen, M. Jarrell, and M. Ma, Phys. Rev. Lett. 102, 206407 (2009).
- Mikelsons et al. (2009) K. Mikelsons, E. Khatami, D. Galanakis, A. Macridin, J. Moreno, and M. Jarrell, Phys. Rev. B 80, 140505 (2009).
- Liebsch and Tong (2009) A. Liebsch and N.-H. Tong, Phys. Rev. B 80, 165126 (2009).
- Khatami et al. (2010) E. Khatami, K. Mikelsons, D. Galanakis, A. Macridin, J. Moreno, R. T. Scalettar, and M. Jarrell, Phys. Rev. B 81, 201101 (2010).
- Lin et al. (2010) N. Lin, E. Gull, and A. J. Millis, Phys. Rev. B 82, 045104 (2010).
- Gull et al. (2010) E. Gull, M. Ferrero, O. Parcollet, A. Georges, and A. J. Millis, Phys. Rev. B 82, 155101 (2010).
- Sakai et al. (2010) S. Sakai, Y. Motome, and M. Imada, Phys. Rev. B 82, 134505 (2010).
- Yang et al. (2011) S.-X. Yang, H. Fotso, S.-Q. Su, D. Galanakis, E. Khatami, J.-H. She, J. Moreno, J. Zaanen, and M. Jarrell, Phys. Rev. Lett. 106, 047004 (2011).
- Galanakis et al. (2011) D. Galanakis, E. Khatami, K. Mikelsons, A. Macridin, J. Moreno, D. A. Browne, and M. Jarrell, Phil. Trans. R. Soc. A 369, 1670 (2011).
- Sordi et al. (2012) G. Sordi, P. Sémon, K. Haule, and A.-M. S. Tremblay, Phys. Rev. Lett. 108, 216401 (2012).
- Sakai et al. (2012) S. Sakai, G. Sangiovanni, M. Civelli, Y. Motome, K. Held, and M. Imada, Phys. Rev. B 85, 035102 (2012).
- Gull et al. (2013) E. Gull, O. Parcollet, and A. J. Millis, Phys. Rev. Lett. 110, 216405 (2013).
- Lifshitz (1960) I. M. Lifshitz, Sov. Phys. JETP 11, 1130 (1960).
- Yamaji et al. (2006) Y. Yamaji, M. Takahiro, and M. Imada, Phys. Soc. Jpn. 75, 094719 (2006).
- Imada et al. (2010) M. Imada, T. Misawa, and Y. Yamaji, J. Phys.: Condens. Matter 22, 164206 (2010).
- Imada et al. (2011) M. Imada, Y. Yamaji, S. Sakai, and Y. Motome, Ann. Phys. 523, 629 (2011).
- Hirsch and Scalapino (1986) J. E. Hirsch and D. J. Scalapino, Phys. Rev. Lett. 56, 2732 (1986).
- Markiewicz (1997) R. S. Markiewicz, J. Phys. Chem. Solids 58, 1179 (1997).
- Rubtsov et al. (2005) A. N. Rubtsov, V. V. Savkin, and A. I. Lichtenstein, Phys. Rev. B 72, 035122 (2005).
- Maier et al. (2006a) T. A. Maier, M. S. Jarrell, and D. J. Scalapino, Phys. Rev. Lett. 96, 047005 (2006a).
- Jarrell and Gubernatis (1996) M. Jarrell and J. Gubernatis, Physics Reports 269, 133 (1996), ISSN 0370-1573.
- Wang et al. (2009) X. Wang, E. Gull, L. de’ Medici, M. Capone, and A. J. Millis, Phys. Rev. B 80, 045101 (2009).
- Bulut et al. (1993) N. Bulut, D. Scalapino, and S. White, Phys. Rev. B 47, 6157(R) (1993).
- Yang et al. (2009) S. X. Yang, H. Fotso, J. Liu, T. A. Maier, K. Tomko, E. F. D’Azevedo, R. T. Scalettar, T. Pruschke, and M. Jarrell, Phys. Rev. E 80, 046706 (2009).
- Chen et al. (2013) K. S. Chen, Z. Y. Meng, U. Yu, S. Yang, M. Jarrell, and J. Moreno, Phys. Rev. B 88, 041103 (2013).
- Maier et al. (2006b) T. A. Maier, M. Jarrell, and D. J. Scalapino, Phys. Rev. B 74, 094513 (2006b).
- Honerkamp and Salmhofer (2001) C. Honerkamp and M. Salmhofer, Phys. Rev. Lett. 87, 187004 (2001).
- Alloul et al. (1989) H. Alloul, T. Ohno, and P. Mendels, Phys. Rev. Lett. 63, 1700 (1989).
- Stewart (1984) G. R. Stewart, Rev. Mod. Phys. 56, 755 (1984).
- Loehneysen et al. (1997) H. V. Loehneysen, F. Huster, S. Mock, A. Neubert, T. Pietrus, M. Sieck, O. Stockert, and M. Waffenschmidt, Physica B-Condensed Matter 230, 550 (1997).
- Walmsley et al. (2013) P. Walmsley, C. Putzke, L. Malone, I. Guillamón, D. Vignolles, C. Proust, S. Badoux, A. I. Coldea, M. D. Watson, S. Kasahara, et al., Phys. Rev. Lett. 110, 257002 (2013).
- Shibauchi et al. (2013) T. Shibauchi, A. Carrington, and Y. Matsuda, arXiv:1304.6387 (2013).
- Hertz (1976) J. A. Hertz, Phys. Rev. B 14, 1165 (1976).
- Millis (1993) A. J. Millis, Phys. Rev. B 48, 7183 (1993).
- Abrahams and Si (2011) E. Abrahams and Q. Si, J. Phys.: Condens. Matter 23, 223201 (2011).
- Gegenwart et al. (2008) P. Gegenwart, Q. Si, and F. Steglich, Nature Physics 4, 186 (2008).
- He and Varma (2012) Y. He and C. M. Varma, Phys. Rev. B 85, 155102 (2012).
- Varma (2013) C. M. Varma, arXiv:1307.1494 (2013).
- Sachdev (2012) S. Sachdev, Lecture Notes in Physics 843, 1 (2012).
- Sachdev et al. (2012) S. Sachdev, M. A. Metlitski, and M. Punk, Journal of Physics: Condensed Matter 24, 294205 (2012).
- Vojta (2009) M. Vojta, Adv. Phys. 58, 699 (2009).
- Hackl and Vojta (2010) A. Hackl and M. Vojta, New J. Phys. 12, 105011 (2010).
- Vojta (2012) M. Vojta, Physica C 481, 178 (2012).