Local stresses in the Janssen granular column
Abstract
We study experimentally the distribution of local stresses in a granular material confined inside a vertical cylinder. We use an image correlation technique to measure the displacement field of the container induced by the forces exerted by the grains on the inner wall. We describe an optimization procedure based on the linear theory of elastic shells to deduce the distribution of these forces from the measured displacement field. They correspond to the stress field of the granular material close to the container’s inner wall. We first confirm the validity of Janssen’s description for various experiments, including the influence of the beads diameter and the effect of an additional mass on top of the granular column. We then apply this method to determine the stress field during the gravity driven discharge of a silo through an aperture.
I Introduction
The stress distribution in a granular material is a complex problem illustrated by two canonical experiments: the sandpile and the silo. In 1829, Huber-Burnand Huber-Burnand (1829) noticed that an egg covered with several inches of sand was able to support a mass of iron weighing fifty-five pounds without breaking, prefigurating the studies of forces repartition in granular materials Smid and Novosad (1981). The importance of the construction history on stress distributions under sandpiles was then demonstrated Vanel et al. (1999). In 1895, Janssen Sperl (2006) quantified the saturation of the bottom pressure in a granular material confined in a vertical container. The so-called Janssen’s law defines the typical pressure saturation length, accounting for friction of the grains on the container’s wall.
The practical interest in avoiding the damage and collapse of silos Dogangun et al. (2009); Zhong et al. (2001) has motivated numerous studies. More recently, the confined granular column has been extensively studied as the simplest experimental setup to test the influence of many parameters on the repartition of stresses in granular materials. The hypothesis of fully mobilized friction Evesque and de Gennes (1998); de Gennes (1999), the effects of humidity Bertho et al. (2004) and the motion of the wall of the silo Bertho et al. (2003) have been assessed through careful experiments. Such experiments have been used as tests to validate continuous models of granular materials, as oriented stress linearity (OSL) Vanel and Clément (1999); Vanel et al. (2000) or elastic Ovarlez et al. (2003); Ovarlez and Clément (2005); Goldenberg and Goldhirsch (2005) theories.
In all these studies on confined granular materials, stresses all along the container’s wall were inferred from the measurement of the apparent mass at the bottom of the column. The total shear stress on the column was obtained directly by measuring the mass of the lateral wall Perge et al. (2012). Apart from numerical results Landry et al. (2003), direct measurements of local stresses remain scarce. In a recent work, the local force network in a 2D silo was directly measured with photoelastic particles Wambaugh et al. (2010). The conclusions from these experiments are puzzling, showing significant deviations from Janssen-like models. This clearly indicates that direct measurements of stresses for static confined granular material are still needed.
We propose here a different method to directly measure the stresses at the wall by tracking the minute deformation of the silo. We follow an idea proposed by Janssen in his original paper: it was the intention of the author to determine the side pressure of the corn directly in the experiments by using a side lid pushed against the silo’s walls. However in his experimental setup, he noticed that accurate results could not be obtained Sperl (2006).
In addition to the static Janssen’s law, the dynamics of confined granular material have also been studied extensively. The flow rate of the gravity driven discharge of a granular column in a silo is described by Beverloo’s law Beverloo et al. (1961). Even though well verified experimentally Mankoc et al. (2007), the physical meaning of this Beverloo’s law, sometimes described as a consequence of Janssen’s law Andréotti et al. (2011), remains unclear. The recent measurements of the pressure profile in the outlet plane of a discharging silo have shown that the flow-rates are not controlled by the local stress conditions Perge et al. (2012). The local displacement field of the grains exhibits complex patterns, such as shear zones close to the wall Pouliquen and Gutfraind (1996); MiDi (2004). Diffusive-wave spectroscopy experiments show the existence of slow collective rearrangements in addition to fast grain collisions Menon and Durian (1997). The friction mobilization at the silo’s wall during the discharge must also be described to understand collapse events Gutiérrez et al. (2009). Measurements of local stresses in confined granular materials are thus also required to gain insight into the physics of Beverloo’s law.
The paper is organized as follows. In Section II, we recover Janssen’s law from mass measurement at the bottom of silos with different elastic moduli. For the given set of parameters used in this study, there is no dependence of the saturation mass with the mechanical properties of the container. This leads to an experimental setup to measure wall deformations and infer the stress distribution in the granular material close to the wall, detailed in Section III. The technique is validated against indirect results for quasi-static experiments in Section IV-A. We finally use this method to gain insight into the evolution of local stresses distribution during the discharge of granular matter through an aperture.
II Janssen’s law in a soft container
II.1 Material and setup
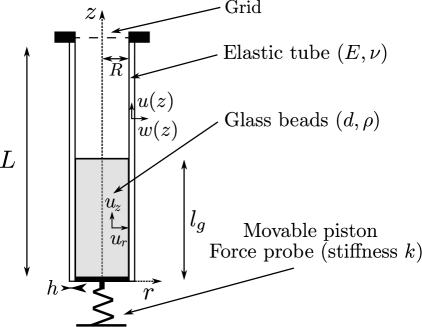
Experiments were performed in elastomer cylindrical tubes and compared to a reference experiment in a rigid tube made of Poly(methyl methacrylate) (PMMA). We used silos of radius mm, thickness mm made of shore 8 (Young’s modulus MPa) and shore 32 (MPa) PolyVinylSiloxane (PVS) or PMMA (GPa). The tubes are clamped at the top and free to move at the bottom (Fig. 1). The granular material stands on a movable piston connected to a force probe to measure the apparent mass at the bottom of the silo. The grains are dry, non-cohesive and slightly polydisperse () glass beads of diameter mm (unless otherwise specified) and density . The PVS tubes are dusted with talc powder to prevent any adhesion between the grains and the wall of the silo. The static friction coefficient between the glass beads and the PMMA and PVS was measured using the sliding angle of a three-bead tripod. We found for the PMMA tube, (resp. ) for the shore 32 (resp. shore 8) PVS tube. In the following, the static friction coefficients are thus assumed to be the same in all experiments. The dynamic friction coefficient was measured with the same apparatus : once set into motion, the angle is slightly reduced until the three-bead tripod eventually stops. This leads to for the shore 8 PVS tube. All the experiments were performed at room temperature and at a relative humidity of at least twice to ensure repeatibility.
II.2 Saturation mass at the bottom of the silo.
A mass of beads is poured through a mm grid. Rain filling provides reproducible dense piling (with volume fraction ). The piston is then moved downwards at constant speed , to mobilize the friction of the grains on the wall. The apparent mass is measured as a function of time (Inset Fig. 2) and decreases until it reaches a plateau, noted , when the friction at the wall is at the Coulomb threshold as described in Vanel et al. (2000); Ovarlez et al. (2003). We plot as a function of the mass of beads filling the tube (Fig. 2). The apparent mass increases with until reaching a plateau noted .
At equilibrium, three forces resist the weight of a slice of height , where is the gravitational acceleration. The upper part of the granular material applies a force , the lower part , and friction on the wall , where , and are average stresses in the grains on the radial direction. Assuming that the shear stress follows Coulomb law at the threshold, wall friction can be rewritten as . Finally, Janssen assumed a constant redistribution of stresses , leading to the equilibrium equation . The solution is :
| (1) |
where is the bottom of the tube. The apparent mass at the bottom of the tube is finally :
| (2) |
where is the measured saturation mass and is the mass of grains filling the tube. Fitting the experimental data with Janssen’s model (solid line Fig. 2), we find g, leading to .

The evolution of the apparent mass as a function of the mass of beads filling the tube follows Janssen’s law and, for our experimental parameters, does not depend on the elasticity of the silo. Indeed, the only quantity that can be changed in Janssen’s model accounting for the elasticity of the silo is the radius resulting from the pressure of the grains on the tube. Therefore, in the limit of small deflections, , the stress distribution will not be affected. More quantitatively, the pressure applied on the wall scales as . The radial displacement of an elastic tube subjected to this pressure can be written as Timoshenko and S. Woinowsky-Krieger (1964). Thus the ratio scales as , which is less than in our experiment. Previous studies have shown that the apparent mass is very sensitive to the compaction Vanel and Clément (1999), thus the radial displacement of the tube has to be small enough not to change the initial compaction. This can be written as , where is the diameter of the glass beads.
Before describing the method to measure local stresses in the granular material, we compare these experimental results to the prediction of a model that assumes isotropic elasticity for the grains.
II.3 Isotropic elasticity model
Assuming isotropic elasticity for the granular material, with Young’s modulus and Poisson’s ration , Ovarlez et. al. Ovarlez and Clément (2005) showed numerically a strong dependence of the saturation mass with the ratio . More quantitatively, we can follow the analytical description given in Ovarlez and Clément (2005), adding the elasticity of the tube. Far from the free surface and from the piston, both stresses and strains of the granular material should be independent of the coordinate . The non-zero terms of the strain tensor can be written as a function of the radial and longitudinal displacements:
| (3) |
In this asymptotic regime, the equilibrium equations
| (4) |
are solved by assuming Hooke’s law for the granular material:
| (5) |
where , and is the Kronecker symbol, and with the boudary conditions This yields the radial and longitudinal displacements:
| (6a) | ||||
| (6b) | ||||
with the radial displacement of the tube. Setting to in Eqs. 6, we recover the displacements given in Ovarlez and Clément (2005). The displacement is related to the pressure acting on the tube:
| (7) |
Finally, the saturation mass takes the form:
| (8) |
where is the saturation mass considering a rigid tube. Experimentally, we varied the ratio by a factor , and did not see any evidence of this dependence. The isotropic elasticity description is thus insufficient to describe confined granular material and we need to consider anisotropy or elliptic theories, as pointed out in Ovarlez and Clément (2005). Nevertheless, the stress distribution in the granular material appears to be the same inside a rigid or soft container, which leads to the method for measuring local stresses detailed in the next section.
III Evaluation of local stresses
III.1 Experimental setup
The saturation of pressure with depth in a granular column is a consequence of friction of the granular material on the silo’s inner wall. We propose to measure the resulting displacement field of the outer wall of the silo to reconstruct the stress field of the granular material close to the wall. Although difficult to estimate for industrial silos Zhong et al. (2001), we will show that such displacements may be obtained by using soft elastomer containers. As shown in Fig. 2, there is no perceptible effect of the elasticity of the silo in our experiments, we thus use the shore 8 tube in the following.
Quasi-static experiments –
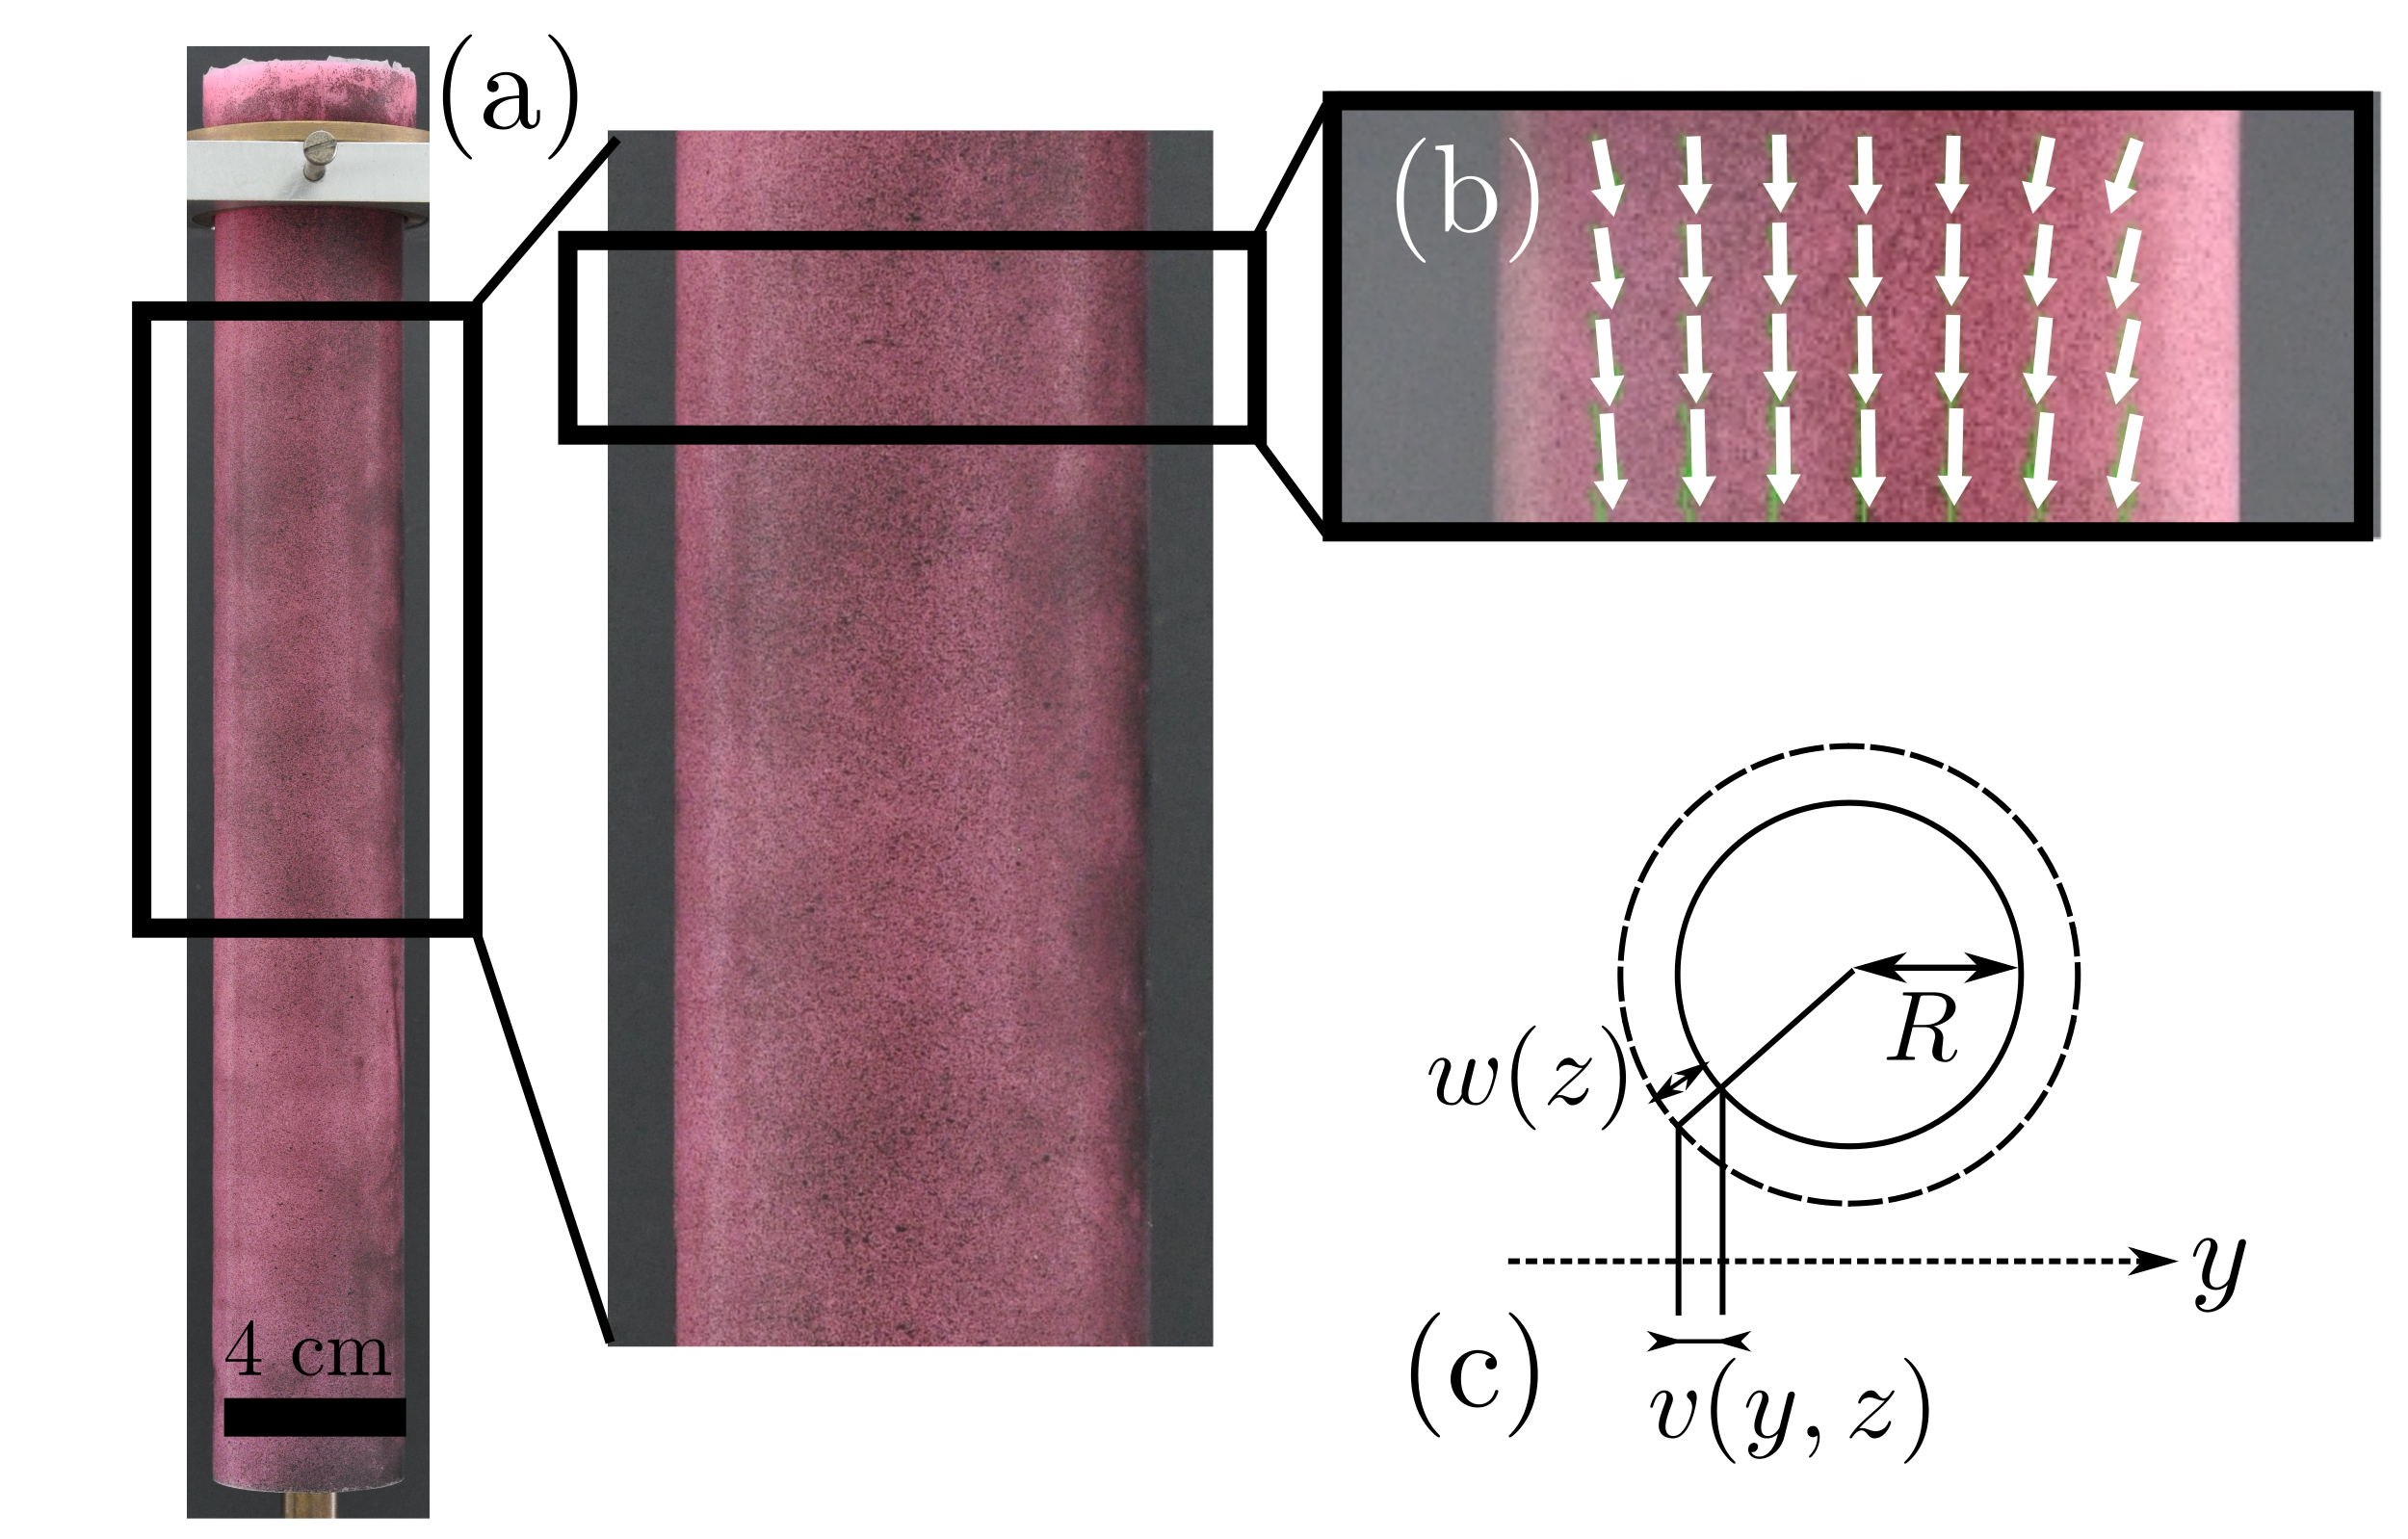
We use the procedure described in Section II.B. The PVS tubes are additionally sputtered with black paint, as shown on Fig. 3. Displacements were obtained by correlating a picture of the tube, taken as the apparent mass reaches the Janssen’s plateau, with a reference picture of the empty tube 111Pictures were taken using a Nikon D200 SLR camera, with a resolution of 4288x2848 pixels. A pixel size is about 0.05 mm. The cross-correlation of the two pictures (PIVlab Thielicke and Stamhuis with Matlab) leads to the displacement field defined on Fig. 1 and Fig. 3. These displacement fields are finally converted into the radial and longitudinal components of the displacement so that and , respectively.
Discharge experiments – The piston is replaced by a fixed cylinder of radius mm slightly smaller than the radius of the tube to avoid friction. A conical hole of minimal diameter mm, maximal diameter mm and angle drilled into the cylinder is closed by a plug (see Inset Fig. 8). Once the tube is rain filled with grains, the plug is removed and the mass of grains flowing outside the tube is recorded as a function of time. The displacement field is obtained by performing the cross-correlation between a reference picture of the empty tube and pictures taken at a given time after releasing the plug. The displacement field is obtained as in the quasi-static experiment.
A typical result of the image correlation is shown on Fig. 4(a,b). The tube is stretched axially as the grains pull on the wall. The radial displacement is positive in the filled region because of the pressure of the grains, and negative above because of Poisson’s effect (the tube being clamped at the top). The radial and longitudinal displacements are direct consequences of the shear stress and radial stress inside the grains, close to the wall. In the following, we will note and to ease legibility, keeping in mind that these quantities are local and not averaged like in the Janssen model. A refined Janssen model accounting for the radial dependence leads to the same qualitative behavior Rahmoun et al. (2008). We recall in the next paragraph the linear theory of cylindrical elastic shells, which link the applied forces on the container’s inner wall to the displacement field.
III.2 A model for the deformation of the silo
III.2.1 Cylindrical shells equations
We use the linear theory of elastic cylindrical shells Timoshenko and S. Woinowsky-Krieger (1964) to describe the deformation of the silo 222In the thin shell limit , and for axisymetric deformations, the non-linear term in axial strain can be neglected in the limit , which is the case in our experiments. For axisymmetric deformations, the non-zero values of the strain and curvature tensors are written in terms of axial and radial displacement:
| (9) |
The moment and in-plane stress are given by Hooke’s law:
| (10) | |||
| (11) | |||
| (12) |
Finally, the in-plane and out-of-plane equilibrium equations are:
| (13) | |||
| (14) |
where is the pressure acting on the interior face of the tube (positive towards the exterior) and the axial volume force (positive upwards). In the case of a tube filled with granular materials, the pressure is given by . Grains also apply a shear stress on the tube which can not be accounted for directly in shells equations. However, we can note that a shear force acting on a height of tube, , is equivalent to an axial volume force , where .
For given functions and , solving the equilibrium equations 13 and 14 with appropriate boundary conditions leads to the axial and radial displacements. We do not solve the equations over the entire length of the tube, as the upper part () deformation corresponds to the stretching of an empty shell 333Except close to the upper clamped boundary., a state completely described by and . In the following, the boundary conditions considered are , , and a free edge at the bottom, where . The values and are obtained experimentally.
We now describe the optimization procedure to solve the inverse problem, i.e. once knowing the displacement field, finding the shear stress and pressure in the granular material close to the wall.
III.2.2 Optimization procedure
The portion of the tube filled with grains, , is discretized into elements. The values of the functions and at the nodes constitute the unknowns of our inverse problem, and the values of the functions in each element are interpolated from these points. For a given set of unknowns, the boundary value problem (Eq. 13,14) is solved by a collocation method (Matlab’s bvp4c solver) Kierzenka and Shampine (2001), leading to the displacement field . The squared deviation of this field from the experimental measurement is then computed. The procedure is repeated by changing the values of the unknowns until the squared deviation is minimal, using Levenberg-Marquardt or Active-Set algorithms (Matlab’s lsqnonlin Levenberg (1944) and fmincon Waltz et al. (2006) functions). The initial guess for the unknowns is set to zero. We checked that the converged solution does not depend on the initial guess. A typical result of the optimization procedure is shown on Fig. 4.
There is a unique solution to the linear system of equations (6,7). Thus in principle, increasing leads to better evaluations of the functions and . However, large values of greatly increase computational cost, and are more likely to lead to local minima. Therefore, we use small values of , and repeat the entire optimization procedure (typically a hundred times) for random location of the discretization nodes along the filled region of the tube. This allows to assess the values of the unknown functions everywhere along the tube in a computationally effective way. For each optimization procedure, the value of is selected as the minimal value above which the unknown functions do not change (when increasing only leads to noisy results).

IV Experimental results
In the first part of this section, we measure the shear stress and pressure acting on the wall in the quasi-static experiments using the optimization procedure described in the previous section. As friction is expected to be fully mobilized, we can reduce the number of unknowns by considering , where is an additional unknown. Note that the optimization procedure has also been carried out for the quasi-static experiments without the hypothesis of fully mobilized friction, leading to identical results.
In a second part, we measure the evolution of stresses during discharge experiments. As the friction state is in this case unknown, we look at the values of the shear stress and pressure separately, assuming Coulomb friction law:
| (15) |
where is taken as the static friction coefficient measured experimentally.
IV.1 Local stresses in Janssen granular column.
IV.1.1 Stress distribution as a function of height
We use the optimization procedure described above to evaluate the shear stress at the wall, for different filling masses. The shear stress increases with depth, from zero at the free surface to a saturation value (Fig. 5). The saturation length is of the order of the tube diameter, independant of the filling mass and in agreement with Janssen’s law. The difference between the weight of the total column and the force on the wall is in agreement with the bottom weight measurement . As expected, if the filling length is smaller ( mm), stresses do not reach the saturation value. We obtained a friction coefficient , consistent with the static friction coefficient measured independantly.
The saturation value of the stresses can be compared to theoretical predictions. Assuming a non-cohesive material, equality of internal and beads/wall friction angles, and a Mohr-Coulomb criterion, the stress ratio at the wall can be written as Rahmoun et al. (2008):
| (16) |
with . This leads to Pa, in excellent agreement with the measured value Pa. The experimental results shown on Fig. 5 are in very good agreement with an exponential saturation behavior and Eq. 16 444Eq. 1 can not be used directly for comparison to our results shown in Fig. 5 and 6, as stresses in the Janssen’s model are averaged along the radial direction. We thus used the exponential behavior with a parameter , and Eq. 16 to fit our experimental results.. Measuring locally the stresses all along the granular column thus directly confirms the Janssen description, i.e. the exponential saturation of the stresses (Eq. 1), while previous studies inferred the validity of the model from the evolution of the apparent mass at the bottom of the column (Eq. 2).

IV.1.2 Influence of beads diameter
We measure the stress field for the same filling length and three different bead diameters (Fig. 6). We do not see any influence of bead diameter on the distribution of local stresses, as expected in the limit Bratberg et al. (2005); Qadir et al. (2010) for quasi-static experiments. One can note that, near the piston ( mm), the stresses are slightly smaller than the saturation value, due to the boundary effect, as it was reported numerically Ovarlez and Clément (2005).

IV.1.3 Effect of an overload
Adding a weight on top of a granular media does not change the forces at the bottom of the pile as noted by Huber-Burnand. This effect was studied quantitatively in the Janssen column Ovarlez et al. (2003); Wambaugh et al. (2010) where the additional weight is redistributed by friction to the wall. A steel cylinder of radius slightly smaller than the radius of the tube and mass g is added on top of a granular column of mass g previously fully mobilized. Once the overload is added, the piston is slightly moved downwards until reaching saturation again. The stress distribution with and without the overload are plotted in Fig. 7. The shear stress is maximum at the top of the column and decreases with depth to the same value than whitout the overload. The additional shear stress at the wall, plotted in dashed line, decreases from the free surface to the bottom of the granular column. Most of the weight of the overload is screened after a typical distance of the order of the tube diameter, which is again consistent with Janssen’s description.

The stress distributions in the quasi-static experiments confirm the validity of Janssen’s description for confined granular materials. They complement another experimental study of the evolution of stresses in a 2D silo with photoelastic beads Wambaugh et al. (2010). The fluctuations reported in such experiments, showing force networks in the silo, are in our case averaged close to the wall by the size of the cross-correlation windows between two pictures. However, the mean-field approach we developed could be applied to higher resolution pictures on smaller areas of the tube to track local fluctuations of stresses in the granular material at the wall. The maximum resolution would be limited by the size of the cross-correlation window which depends on the typical scale of the sputtering pattern, but also by the elasticity of the tube which imposes a typical scale of the order of the thickness.
IV.2 Local stresses during a discharge
We use the same technique to determine the stress field along the silo during a gravity driven discharge. The flow rate is found to be constant () in agreement with Berverloo’s law. In this experiment, after rain filling the silo, we do not mobilize friction, as in the quasi-static experiment, but directly remove the plug. In this case, the friction state is unknown and we evaluate the shear stresses and wall pressure separately. At the top, the tube is clamped and at the bottom the tube is free to move while the drilled cylinder in the outlet plane is fixed (Inset Fig. 8). We measure the displacement field as a function of time and apply the optimization method to a subset of two images : the reference image when the tube is empty and another at a given time after the plug was removed. We obtain independently the shear stress and wall pressure along the granular column for each time.
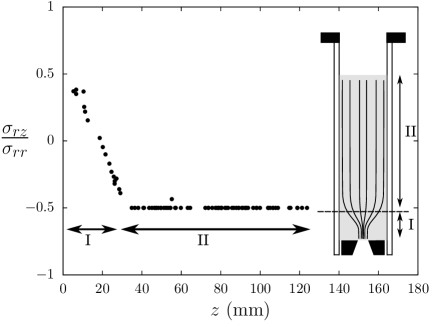
As the friction is not mobilized before the discharge, we first need to measure the stress ratio along the tube. This ratio is plotted just after the plug is removed (Fig. 8 for s). In an upper region mm (region II), the grains slide downwards at the wall ( (Eq. 15)), while in the lower region mm (region I), there is no relative motion of the grains on the silo’s wall. As the bottom part of the tube is not yet moving at this time, this indicates that the grains stand on the fixed cylinder in a still region, which is consistent with the observations of previous discharge experiments Perge et al. (2012): the streamlines go towards the center of the granular column close to the outlet plane (as sketched in the Inset Fig. 8). The length of the region I is of the order of the tube radius. A displacement of a few grains diameters ( mm) is enough to mobilize friction on the whole column. At larger time ( s), as the tube and the grains move simultaneously, the stress ratio is more difficult to interpret.
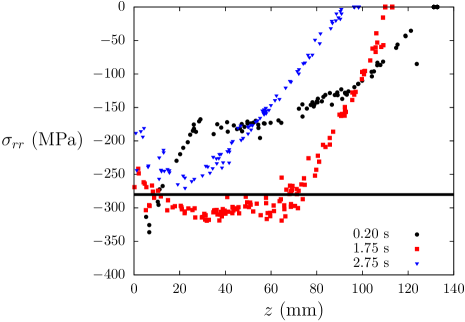
The radial stress along the tube is plotted on Fig. 9. At short time (), only a part of the grain mass is screened by the friction at the wall, and the pressure saturates at a lower value than the one observed in the quasi-static experiment. Close to the fixed cylinder at the bottom ( mm), grains can not slide on the wall, and the pressure increases. At larger times, the friction is fully mobilized along the tube and we recover a profile caracteristic of Janssen’s saturation as in the quasi-static experiment, including the pressure decrease at the bottom, due to a boundary effect. For , the pressure increases exponentially along the tube and saturates at the value obtained in the quasi-static experiment. This description remains valid during the rest of the discharge, as the free surface of the granular column moves downwards. At , the grain mass in the column decreases significantly and the saturating pressure is therefore smaller.
The evolution of the radial stress at two different fixed positions along the tube (z=60 mm and 90 mm) is plotted on Fig. 10. The pressure acting on the wall starts to increase as until reaching the saturation value , obtained in the quasi-static experiments. It then decreases to zero while the tube is discharging. More precisely, if we assume that the pressure profile follows Janssen’s law, with as in the quasi-static experiments (Fig. 5), we can compute the evolution of the pressure at a given point along the tube :
| (17) |
with . The experimental measurements are in good agreement with this description (solid and dashed lines on Fig. 10) for , typical time after which friction is fully mobilized. For , the Janssen’s description is not relevant as the friction is undetermined. The typical timescale for full mobilization should depend on the radius of the tube and on the outlet diameter and is found to be very short in our experiments.

These experimental measurements of the stresses in a granular material during a gravity driven discharge show that soon after the beginning of the discharge, the stress profile close to the container’s wall follows Janssen’s law (except close to the outlet plane) almost until the end of the discharge.
V Conclusion
The stress repartition in a confined granular column is classically infered from the saturation of the apparent mass at the bottom of the silo.
We measured the apparent mass as a function of filling mass in soft elastomer containers after full mobilisation of friction and recovered a unique profile described by Janssen’s theory.
We show that this experimental evidence is not compatible with an isotropic elasticity description for a granular column.
We developed an experimental technique to measure the local stress field at the wall of a granular material confined in a vertical container.
We validated this method against indirect measurement of the stress distribution in a granular column in a quasi-static experiment.
The local stress distribution is found to be in agreement with Janssen’s law. The beads diameter was found to have no influence on the stress profiles.
The local distribution of additional stresses in the presence of an overload was determined.
Inferring local informations in a granular material from the resulting displacements of the container is a new method which could be used in a wide range of granular problems, to measure stresses under sandpiles, to track local stresses fluctuations in a granular column, or to evaluate the stress distribution in a Couette granular experiment. It could naturally be extended to study complex fluids rheology. The method developped could be applied to study other mechanical problems, as for example plant growth under constraints Kolb et al. (2012).
We measured the evolution of stresses in time for gravity driven discharge experiments. We found that, starting from an unknown friction state, a displacement of a few grain diameters is enough to mobilize friction on the whole column. After a short transient the pressure is found to be the same as the one observed in the quasi-static experiment. Eventually, we showed that the stress evolution in time is well described assuming Janssen’s exponential saturation and Beverloo’s constant mass flow rate.
Acknowledgements We thank E. Kolb for the lend of experimental devices, G. Lagubeau for initial discussion, J. Bico, P. Jop, E. Reyssat and L. Pugnaloni for careful proofreading of the draft.
References
- Huber-Burnand (1829) Huber-Burnand, Ann. d. Phys. 92, 316 (1829).
- Smid and Novosad (1981) J. Smid and J. Novosad, Proc. Powtech. Conference. Int. Chem. Eng. Symp. 63, 1 (1981).
- Vanel et al. (1999) L. Vanel, D. Howell, D. Clark, R. P. Behringer, and E. Clément, Phys. Rev. E 60, 5040 (1999).
- Sperl (2006) M. Sperl, Granular Matter 8, 59 (2006).
- Dogangun et al. (2009) A. Dogangun, Z. Karaca, A. Durmus, and H. Sezen, J. Perform. Constr. Fac. 23, 65 (2009).
- Zhong et al. (2001) Z. Zhong, J. Ooi, and J. Rotter, Eng. Struct. 23, 756 (2001).
- Evesque and de Gennes (1998) P. Evesque and P.-G. de Gennes, C. R. Acad. Sci. Paris 326, 761 (1998).
- de Gennes (1999) P. G. de Gennes, Rev. Mod. Phys. 71, 374 (1999).
- Bertho et al. (2004) Y. Bertho, T. Brunet, F. Giorgiutti-Dauphiné, and J.-P. Hulin, Europhys. Lett. 67, 955 (2004).
- Bertho et al. (2003) Y. Bertho, F. Giorgiutti-Dauphiné, and J.-P. Hulin, Phys. Rev. Lett. 90, 144301 (2003).
- Vanel and Clément (1999) L. Vanel and E. Clément, Eur. Phys. J. B 11, 525 (1999).
- Vanel et al. (2000) L. Vanel, P. Claudin, J.-P. Bouchaud, M. Cates, E. Clément, and J. Wittmer, Phys. Rev. Lett. 84, 1439 (2000).
- Ovarlez et al. (2003) G. Ovarlez, C. Fond, and E. Clément, Phys. Rev. E 67, 060302 (2003).
- Ovarlez and Clément (2005) G. Ovarlez and E. Clément, Eur. Phys. J. E 16, 421 (2005).
- Goldenberg and Goldhirsch (2005) C. Goldenberg and I. Goldhirsch, Nature 435, 188 (2005).
- Perge et al. (2012) C. Perge, M. Aguirre, P. Gago, L. Pugnaloni, D. Le Tourneau, and J.-C. Géminard, Phys. Rev. E 85, 021303 (2012).
- Landry et al. (2003) J. Landry, G. Grest, L. Silbert, and S. Plimpton, Phys. Rev. E. 67, 041303 (2003).
- Wambaugh et al. (2010) J. F. Wambaugh, R. R. Hartley, and R. P. Behringer, Eur. Phys. J. E 32, 134 (2010).
- Beverloo et al. (1961) W. A. Beverloo, H. A. Leniger, and J. Van de Velde, J. Chem. Eng. Sci. 15, 260 (1961).
- Mankoc et al. (2007) C. Mankoc, A. Janda, R. Arévalo, J. Pastor, I. Zuriguel, A. Garcimartin, and D. Maza, Granular Matter 9, 407 (2007).
- Andréotti et al. (2011) B. Andréotti, Y. Forterre, and O. Pouliquen, Les milieux granulaires: entre fluide et solide (EDP Sciences/CNRS Edition, Paris, 2011).
- Pouliquen and Gutfraind (1996) O. Pouliquen and R. Gutfraind, Phys. Rev. E 53, 552 (1996).
- MiDi (2004) G. MiDi, Eur. Phys. J. E 14, 341 (2004).
- Menon and Durian (1997) N. Menon and D. J. Durian, Science 275, 1920 (1997).
- Gutiérrez et al. (2009) G. Gutiérrez, P. Boltenhagen, J. Lanuza, and E. Clément, in Traffic and granular flow 07, Eds. Appert-Rolland, C., Chevoir, F., Gondret, P.,Lassarre S., Lebacque, J., Schreckenberg, M. (Springer, Berlin, 2009) pp. 517–523.
- Timoshenko and S. Woinowsky-Krieger (1964) S. Timoshenko and S. S. Woinowsky-Krieger, Theory of Plates and Shells (McGraw-Hill, New York, 1964).
- (27) W. Thielicke and E. Stamhuis, PIVlab - Time-Resolved Digital Particle Image Velocimetry Tool for MATLAB, http://pivlab.blogspot.fr/.
- Rahmoun et al. (2008) J. Rahmoun, G. Millet, and G. de Saxcé, J. Stat. Mech. P06011, 1742 (2008).
- Kierzenka and Shampine (2001) J. Kierzenka and L. Shampine, ACM Trans. Math. Soft. 27, 299 (2001).
- Levenberg (1944) K. Levenberg, Quaterly Applied Math. 2, 164 (1944).
- Waltz et al. (2006) R. Waltz, J. Morales, J. Nocedal, and D. Orban, Mathematical Programming 107, 391 (2006).
- Bratberg et al. (2005) I. Bratberg, K. Maloy, and A. Hansen, Eur. Phys. J. E 18, 245 (2005).
- Qadir et al. (2010) A. Qadir, H. Guo, X. Liang, Q. Shi, and G. Sun, Eur. Phys. J. E 31, 311 (2010).
- Kolb et al. (2012) E. Kolb, C. Hartmann, and P. Genet, Plant and Soil 360, 19 (2012).