Dislocations Plasticity Avalanches in phase transitions
Determination of the universality class of crystal plasticity
Abstract
Although scaling phenomena have long been documented in crystalline plasticity, the universality class has been difficult to identify due to the rarity of avalanche events, which require large system sizes and long times in order to accurately measure scaling exponents and functions. Here we present comprehensive simulations of two-dimensional dislocation dynamics under shear, using finite-size scaling to extract scaling exponents and the avalanche profile scaling function from time-resolved measurements of slip-avalanches. Our results provide compelling evidence that both the static and dynamic universality classes are consistent with the mean-field interface depinning model.
pacs:
61.72.Ffpacs:
62.20.fqpacs:
64.60.av1 Introduction
Crystalline materials deform in a plastic, irreversible manner at sufficiently high stresses. Bulk continuum theories successfully reproduce several macroscopic features of plastic flow such as the stress-strain curve and work-hardening [1]. This success is mainly due to the fluctuations averaging out at macroscopic scales and therefore deformation appears to be smooth in time and homogeneous in space.
At microscopic scales crystal deformation is both spatially inhomogeneous and intermittent in time. Topological defects such as dislocations move intermittently, causing the material to slip in discrete steps. Those defects interact with each other via long-range elastic interactions, mediated through the material and respond collectively to external stresses, giving slip avalanches. These slip avalanches are characterized by long-range correlations in space and time giving avalanche sizes distributed according to power-laws for several orders of magnitude [2, 3, 4, 5, 6, 7, 8, 9, 10, 11].
Despite intense computational efforts to predict a complete set of universal (i.e., detail-independent) power-law exponents, there is an ongoing debate about their values and the corresponding universality class of systems that share the same exponents. Several previous discrete dislocation dynamics simulations have reported contradictory results for static and dynamic power law exponents [11, 12, 13]. (We call properties “dynamic” if they resolve the dynamics during the propagation of an individual avalanche, and “static” if they do not.) Here we present a consistent picture that strongly supports the claim that both the statics and the dynamics of crystal plasticity simulations agree with mean-field theory predictions [11, 14], and therefore they both belong to the mean-field interface depinning universality class of all systems that share the same exponents. Knowing the values of these exponents is important for applications. For example the dynamical depinning exponent [13] describes how quickly a crystal deforms as a function of stress, and the power spectra [12] can be used to obtain information about the deformation mechanism and material failure from non-destructive acoustic emission experiments. Also, the power law exponents do not depend on material details, so they are an ideal quantity for testing the predictions of the simple coarse grained models against experiments.
| exponent | extracted | MFT | simulations | experiments |
| 1.4 [15],1.6 [16],1.5 [17]* | 1.5-1.6 [10],1.5 [18] | |||
| 2 | 2 [15],2 [17]* | 2 [15] | ||
| [2]+ | [5], [2] | |||
| 3 | ||||
| 2 | 1.5 [12]+ | |||
| (fig. 1) | 2 | 1.5 [12]+ | ||
| (fig. 2) | 2 | 1.5 [12]+ | ||
| (fig. 3) | 1 | |||
| (fig. 3) | 1 | [13]+ | ||
| derived | ||||
| 2 | ||||
| 1 | ||||
| 1 | ||||
| 1 | [13]+ |
A simple analytic mean-field theory (MFT) [11, 14] for plasticity suggests that the observed power law scaling of the slip-avalanche size distributions is the reflection of an underlying non-equilibrium critical point [19], which is located at the critical flow stress. The critical flow stress separates a low stress phase where the material can sustain loads on the time scales of typical experiments, from a high stress phase where the material “flows”, or “gives way” by deforming continually under loads that are higher than the critical flow stress. Below the critical flow stress , at fixed stress , the average strain rate is zero and dislocations are stuck on average, while above the critical flow stress they move continually, and the average strain rate is nonzero. For stresses the strain rate scales as where is the depinning exponent [13]. In mean-field theory . Below the critical flow stress, when the stress is increased by a small step, the system responds with a dislocation slip avalanche, at the end of which all dislocations are re-pinned again and remain stuck until the stress is increased again. As the stress slowly approaches the critical flow stress from below, the average slip avalanche size grows bigger and it diverges at the critical point as , where , and in mean-field theory. The average avalanche size at a fixed stress can thus be used as a measure of the proximity to the critical flow stress.
The purpose of this Letter is to provide the first comprehensive calculation of the time-resolved behavior of slip avalanches. We use finite-size scaling to compute accurately a full suite of critical exponents and the associated scaling function, in order to determine the static and dynamic universality class. There are many additional critical exponents that are predicted by MFT [14] (see Table 1) and they all belong to the mean-field interface depinning universality class [11, 14]. Analyses using renormalization group techniques suggest that the interaction range of dislocations is sufficiently long range so that mean-field theory, which uses infinite range interactions, predicts the correct exponents for 2- and 3-dimensional crystals [11, 14]. The theoretical expectations have in the past not been confirmed by simulations, and it is this inconsistency that we address here.
Discrete dislocation dynamics models [2, 15, 16, 12, 17, 20, 21], continuum models [15], phase field models [22] and phase field crystal models [23] indicate a nonequilibrium critical point, but no consensus has been reached on its universality class. Zaiser [15] achieved a scaling collapse of static properties, such as the simulated slip-avalanche size distribution at different external stresses below the critical flow stress, with critical exponents that are consistent with mean-field theory. Other discrete dislocation dynamics simulations obtained dynamic quantities that did not agree with mean-field theory: Laurson et al [12] reported that the power spectra of the slip-velocity time series above the flow stress are characterized by a critical exponent that differs from the mean-field theory predictions. Miguel et al [13] found an independent depinning exponent that also differs from mean-field theory predictions.
Part of the difficulty in resolving the differences between the static and the dynamic results is that the long range interactions lead to unusually prominent finite-size effects that can skew numerical scaling results. To circumvent these finite-size effects we perform a finite size scaling analysis of the avalanche statistics obtained from our discrete dislocation dynamics simulations. We calculate both universal scaling exponents and universal scaling functions associated with the temporal profiles of the slip speed during avalanches. We find that the power spectra of the slip speed time series (below and above the critical flow stress) exhibit power-law behavior and that the avalanche shapes collapse with matching exponents. More importantly, we find that both the collapse function and a comprehensive set of 13 exponents obtained from our simulations (Table 1) for both static and dynamic properties, are in excellent agreement with the simple model [14] in the mean-field interface depinning universality class, including the finite-size scaling exponent and the depinning exponent . Our work thus demonstrates that even though there is no apparent quenched disorder in these systems, the time-resolved and finite-size scaling properties of the dislocation system behave according to the mean-field interface depinning model which does have quenched disorder.
Our work makes quantitative predictions for the scaling behavior of dislocation systems at sufficiently large length- and long time-scales where the microscopic details should not be important. Therefore our scaling results are relevant to the deformation of micro- [10, 2] and nano-pillars [18, 24] alike, for pillars that are large enough to display collective dislocation dynamics. Recent experimental studies on nanopillars confirm these predictions [25].
2 Discrete dislocation dynamics model
In order to study the avalanches of plasticity we employ discrete dislocation dynamics (DDD) simulations in two dimensions (2D). The details of our model can be found in [21]. They are similar to other 2D DDD models in the literature [2, 15, 12, 20]. In brief, in a square box of side , we place straight edge dislocations parallel to the -axis. The dislocations are allowed to move continuously along the -axis, the shear direction, while their position is fixed. Each dislocation is assigned a Burgers vector such that . Every pair at a distance interacts via the interaction stress ,
| (1) |
where is the shear modulus and is the Poisson ratio of the host medium. Each dislocation moves in response to , and the external shear stress . Their stick-slip motion can be described by overdamped equations of motion:
| (2) |
for where is the coordinate of the th dislocation at point with Burgers vector , is time and is the effective viscosity in the host medium [2, 12, 15]. ( is a dynamically changing inhomogeneous stress field which pins the dislocations for .) In our computer simulations we set the temperature to zero, the distance scale to and the time scale to . We impose periodic boundary conditions in both and directions and use the Lekner summation method [26] of image cells to treat the long-range character of the dislocation interaction. The choice of the boundary conditions does not affect the scaling behavior on long length scales [19, 25, 18]. Neither does creation and annihilation affect the power law exponents and the scaling functions presented here [11, 14].
We solve the equations of motion with the adaptive-step fifth-order Runge-Kutta method [27]. We keep the dislocation number constant, since we do not want to consider dislocation creation or annihilation. We define the dislocation collective speed (also called activity) as,
| (3) |
where . The acoustic emission signal is proportional to . Another choice is , which is proportional to the strain rate [11]. The avalanches produced from either of these two measures converge to the same scaling behavior for large avalanches.
3 Below the critical flow stress
We start by randomly seeding the dislocations in the simulation box and letting the system relax to the nearest (metastable) equilibrium state at zero external stress. The dislocation activity approaches zero as the system approaches the nearest local energy minimum. A simple eigenmode analysis shows that the time needed for the system to reach zero activity diverges. When the dislocation activity has fallen below a threshold the system is sufficiently close to the energy minimum. We increase the external stress adiabatically (or quasi-statically) slowly whenever and for as long as the system’s activity is below the specified threshold, . Eventually the increased external stress pushes the system’s activity above the threshold (this is the starting time of an avalanche ). During the time that the system produces an avalanche and we keep the external stress constant until the avalanche has completed and the activity falls below threshold (this is the ending time of an avalanche ); the avalanches do not overlap in time.
For relatively low values of the external stress the system responds with small avalanches. As the stress approaches the critical flow stress , it responds with larger and larger avalanches until at it finally flows steadily with an infinite avalanche. When the applied stress exceeds the critical value, i.e., , we observe the dislocations moving continually, exiting from one side of the simulation cell and reemerging at the other due to the periodic boundary conditions, without ever getting stuck again. This is the point when the sample flows in a deformation experiment. In summary, for the system is pinned. For the system is flowing.
We calculated the power spectra of the time series of the activity for all stresses, i.e., (integrated-over-stress), using the Lomb periodogram technique [27]. The stress-integrated avalanche size distribution exponent is . As shown by Kuntz and Sethna [28] for a size distribution exponent less than or equal to the power spectrum scales as
| (4) |
Our results are shown in fig. 1 where we find .
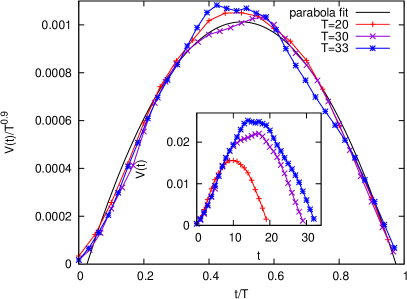
The duration of an avalanche is . From our simulations we extract the avalanche shapes in the pinned phase. We collect all the avalanches within of a given duration and average their temporal profiles. For sufficiently small durations the avalanches are taken from the power law regime of the duration distribution. We collapse them using [28, 19]
| (5) |
We obtain a good collapse, which indicates that the scaling exponent has the MF value of and the scaling function is a parabola, same as in MFT (fig. 2). In addition the power spectra exponent and the exponent that collapses the avalanche shapes are in excellent agreement with each other. In [12] the avalanche shapes were first rescaled with an assumed exponent of and then averaged. This is not the same as the Widom scaling collapse presented here. We first average shapes of avalanches of the same duration. Then we tune the exponents until the average shapes of different durations collapse. In our case the exponent is a result of the scaling collapse and does not need to be assumed up front. Also in [12] a power spectra exponent of was fitted for the activity fluctuations above the critical flow stress while the system was in a steady state. In contrast, our power spectra above the critical flow stress give the same power-spectra exponent of as our power spectra below the critical flow stress indicating that the critical region extends at least up to (see fig. 1).
We also extract the probability distribution of the avalanche sizes, durations and energies. We define the size of an avalanche as and the energy as . The distribution of energies at different stresses can be shown to scale as and the distribution of durations as assuming that the distribution of sizes scales as [15], the correlation length scales as and the dynamic exponent is defined via . . All distributions have a power-law region (e.g. ) up to a cut-off or maximum avalanche (e.g. ) which increases as the system approaches the critical flow stress from below. We calculated all the power-law and cut-off exponents above from our simulations and they are consistent with MFT. Only could not be extracted due to finite-size effects. Also, much larger system sizes than our maximum of and are needed to collect enough statistics for the largest avalanches where the power-law scaling region of the distributions cuts off and measure the correct stress-integrated () power-law exponents (e.g. ).
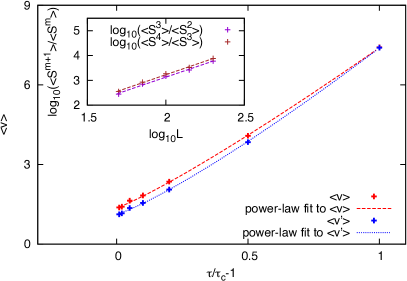
As the system approaches the critical flow stress from below, , (i.e., the critical point of the depinning transition) the correlation length diverges, . Up to the maximum avalanche is given by . However when the correlation length outgrows the system size, , the maximum avalanche is dictated by the system size, . We can quantify the finite-size effects through the exponent (fig. 3). The integrated size distribution can bevmodified to account for finite-size effects, . We were able to qualitatively observe the increase of the maximum avalanche of with . We quantify that dependence through the moments, . For the integral does not diverge at the lower limit and we get . By plotting we obtain consistent values for , independent of (see inset of fig. 3). Same when using . Unfortunately applying to the data does not yield reliable results because the durations are plagued by large finite-size effects and large errorbars. We present all exponents in Table 1.
4 Above the critical flow stress
The critical flow stress for each system is the stress reached at the end of the adiabatic run. At that stress we observe the last infinite avalanche with the dislocations moving out of the basic cell at one side and in at the other for periodic boundary conditions. The critical flow stress is not a universal quantity and every system with the same number of dislocations and box size has a different . Knowing the critical stresses from the adiabatic run allows us to simulate at a fixed fraction above each realization’s own critical flow stress. We obtain a sharp transition from the pinned to the depinned phase and a linear relationship between mean dislocation activity, , and distance from the critical point:
| (6) |
(fig. 3). This result agrees with MFT predictions [29, 30, 14], but differs from Ref. [13] where the critical flow stress was determined in a collective manner for the entire ensemble. Our treatment properly accounts for the ensemble stress fluctuations [21] on , but we expect that the two approaches should yield the same exponent in the thermodynamic limit.
We also calculated the power spectra at fixed stress above the critical flow stress. The stress-binned avalanche size distribution exponent is . This means that the power spectra at fixed stress scale the same as [28]
| (7) |
In fig. 1 we show that the power spectra at fixed stress in the depinned phase () exhibit identical scaling as the power spectra integrated over all stresses in the pinned phase ().
5 Discussion
We demonstrated that not just the static but also the dynamic characteristics of crystalline deformation, (i.e., critical exponents and scaling functions), in the absence of hardening, belong to the universality class of the mean field (MF) interface depinning transition. (“Absence of hardening” refers to systems without dislocation creation and annihilation, and with a zero slope of the stress-strain curve in the vicinity of the critical flow stress.) Specifically, we showed that the temporal profiles of the avalanche shapes collapse on to a parabolic MF scaling function with a MF scaling exponent, . This value agrees, as predicted, with the scaling exponent of the power spectrum of the acoustic emission signal during plastic deformation. We provided a finite-size scaling analysis of dislocation systems that shows the value of the finite-size scaling exponent is also consistent with MFT predictions. We extracted the depinning exponent which characterizes the dynamic interface depinning phase transition by taking proper care of the ensemble fluctuations and found it in accordance with MFT . Our work thus resolves the differences between prior results on static and dynamic plasticity exponents, and shows that both static and dynamic exponents and scaling functions belong to the MF interface depinning universality class [14].
Acknowledgements.
We thank M.-C. Miguel, M. Zaiser, J. Weiss, S. Zapperi, L. Laurson, M. Alava, D. Ceperley, V. Paschalidis, Y. Ben-Zion, K. Schulten, T. M. Earnest, N. Friedman, A. Jennings, J. Greer and J. Sethna for helpful conversations. We acknowledge NSF grant DMR 03-25939 ITR (MCC) and DMR 10-05209, SCEC, the University of Illinois Taub cluster and NSF grant TG-DMR090061 for TeraGrid TACC and NCSA resources.References
- [1] \NameHosford W. \BookMechanical Behavior of Materials (Cambridge University Press) 2005.
- [2] \NameMiguel M.-C., Vespignani A., Zapperi S., Weiss J. Grasso J. \REVIEWNature 4102001667.
- [3] \NameWeiss J., Grasso J. R., Miguel M.-C., Vespignani A. Zapperi S. \REVIEWMater. Sci. Eng. A 309-3102001360.
- [4] \NameRicheton T., Weiss J. Louchet F. \REVIEWNat. Mater. 42005465.
- [5] \NameRicheton T., Dobron P., Chmelik F., Weiss J. Louchet F. \REVIEWMater. Sci. Eng. A 4242006190.
- [6] \NameRicheton T., Weiss J. Louchet F. \REVIEWActa Mat. 5320054463.
- [7] \NameWeiss J., Lahaie F. Grasso J. \REVIEWJ. Geo. Res, 1052000433.
- [8] \NameWeiss J. Grasso J. \REVIEWJ. Phys. Chem. B 10119976113.
- [9] \NameWeiss J. \REVIEWSurveys in Geophysics 242003185.
- [10] \NameDimiduk D., Woodward C., LeSar R. Uchic M. \REVIEWScience 31220061188.
- [11] \NameZaiser M. \REVIEWAdvances in Physics 552006185.
- [12] \NameLaurson L. Alava M. J. \REVIEWPhys. Rev. E 742006066106.
- [13] \NameMiguel M. C., Vespignani A., Zaiser M. Zapperi S. \REVIEWPhys. Rev. Lett. 892002165501.
- [14] \NameDahmen K. A., Ben-Zion Y. Uhl J. T. \REVIEWPhys. Rev. Lett. 1022009175501.
- [15] \NameZaiser M., Marmo B. Moretti P. \REVIEWProceedings of Science (Statistical Mechanics of Plasticity and Related Instabilities) 0532005.
- [16] \NameMiguel M.-C., Vespignani A., Zapperi S., Weiss J. Grasso J. R. \REVIEWMater. Sci. Eng. A 309-3102001324.
- [17] \NameCsikor F. F., Motz C., Weygand D., Zaiser M. Zapperi S. \REVIEWScience 3182007251.
- [18] \NameBrinckmann S., Kim J.-Y. Greer J. R. \REVIEWPhys. Rev. Lett. 1002008155502.
- [19] \NameSethna J., Dahmen K. Myers C. \REVIEWNature 4102001242.
- [20] \NameIspanovity P. D., Groma I., Gyorgyi G., Csikor F. F. Weygand D. \REVIEWPhys. Rev. Lett. 1052010085503.
- [21] \NameTsekenis G., Goldenfeld N. Dahmen K. A. \REVIEWPhys. Rev. Lett. 1062011105501.
- [22] \NameKoslowski M. \REVIEWPhil. Mag. 8720071175.
- [23] \NameChan P. Y., Tsekenis G., Dantzig J., Dahmen K. A. Goldenfeld N. \REVIEWPhys. Rev. Lett. 1052010015502.
- [24] \NameJennings A. T., Burek M. J. Greer J. R. \REVIEWPhys. Rev. Lett. 1042010135503.
- [25] \NameFriedman N., Jennings A. T., Tsekenis G., Kim J.-Y., Tao M., Uhl J. T., Greer J. R. Dahmen K. A. \REVIEWPhys. Rev. Lett. 1092012095507.
- [26] \NameLekner J. \REVIEWPhysica A 1761991485.
- [27] \NamePress W., Teukolsky S., Vetterling W. Flannery B. \BookNumerical Recipes in C: The Art of Scientific Computing 2nd Edition (Cambridge University Press, Cambridge, England) 1992.
- [28] \NameKuntz M. C. Sethna J. P. \REVIEWPhys. Rev. B 62200011699.
- [29] \NameZapperi S., Cizeau P., Durin G. Stanley H. E. \REVIEWPhys. Rev. B 5819986353.
- [30] \NameFisher D. S., Dahmen K., Ramanathan S. Ben-Zion Y. \REVIEWPhys. Rev. Lett. 7819974885.