Fluctuating selection models and McDonald-Kreitman type analyses
Abstract
It is likely that the strength of selection acting upon a mutation varies through time due to changes in the environment. However, most population genetic theory assumes that the strength of selection remains constant. Here we investigate the consequences of fluctuating selection pressures on the quantification of adaptive evolution using McDonald-Kreitman (MK) style approaches. In agreement with previous work, we show that fluctuating selection can generate evidence of adaptive evolution even when the expected strength of selection on a mutation is zero. However, we also find that the mutations, which contribute to both polymorphism and divergence tend, on average, to be positively selected during their lifetime, under fluctuating selection models. This is because mutations that fluctuate, by chance, to positive selected values, tend to reach higher frequencies in the population than those that fluctuate towards negative values. Hence the evidence of positive adaptive evolution detected under a fluctuating selection model by MK type approaches is genuine since fixed mutations tend to be advantageous on average during their lifetime. Never-the-less we show that methods tend to underestimate the rate of adaptive evolution when selection fluctuates.
The McDonald-Kreitman (MK) test (McDonald and Kreitman, 1991), and its derivatives (Fay et al., 2001; Smith and Eyre-Walker, 2002; Bierne and Eyre-Walker, 2004; Eyre-Walker and Keightley, 2009) use the contrast between the levels of polymorphism and substitution at neutral and selected sites to infer the presence of adaptive evolution in the divergence between species. Modified versions of the MK test allow one to quantify , the proportion of nonsynonymous differences between species due to adaptive evolution (Fay et al., 2001; Smith and Eyre-Walker, 2002; Bierne and Eyre-Walker, 2004; Eyre-Walker and Keightley, 2009). The MK test has been widely applied to a number of species and estimates of vary substantially from limited evidence ( to 10%) in humans (Chimpanzee Sequencing and Analysis Consortium, 2005; Zhang and Li, 2005; Boyko et al., 2008) and many plant species (Gossmann et al., 2010) to more than 50% in Drosophila (Smith and Eyre-Walker, 2002; Charlesworth and Eyre-Walker, 2006), some plants with large effective population size (Slotte et al., 2010; Strasburg et al., 2011) and bacteria (Charlesworth and Eyre-Walker, 2006).
The MK test framework implicitly assumes that selection pressures are constant. However, the environment for most organisms is constantly changing due to fluctuations in physical factors, such as temperature, and biotic factors, such as the prevalence of competitor species and the density and genotype frequencies of other conspecific individuals. This is likely to lead to changes in the strength of selection acting upon a mutation through time (Bell, 2010); in the extreme this might mean that a mutation is advantageous at one time-point, but deleterious at another. Despite the likelihood that selection fluctuates through time there is relatively little evidence that this is the case. This is probably because measuring the strength of selection is difficult and detecting fluctuating selection requires analyses over several years. However, analyses of data from several species have suggested that some polymorphisms are subject to fluctuating selection (Fisher and Ford, 1947; Mueller et al., 1985; Lynch, 1987; O’Hara, 2005, reviewed by Bell, 2010). In these examples there are changes in the frequency of mutations that appear to be too great to be explained by either random genetic drift or migration. In most of these analyses the mean strength of selection acting upon a mutation appears to be close to zero. However, this might be a sampling artifact, a mutation subject to fluctuating selection in which the average selection coefficient is non-zero is more likely to be lost or fixed.
Fluctuating selection is likely to be more prevalent than the few well documented examples suggest and Bell (2010) has argued that fluctuating selection might help resolve why most traits show substantial heritability, even though selection on a short time-scale often appears to be quite strong. Despite the likelihood that the strength of selection varies most work in theoretical population genetics has assumed that the strength of selection is constant through time. Exceptions are the work by Kimura (1954), Gillespie (1973, 1991), Jensen (1973), Karlin and Levikson (1974), Takahata et al. (1975), Huerta-Sanchez et al. (2008) and Waxman (2011). Huerta-Sanchez et al. (2008) have investigated how fluctuating selection affects the allele frequency distribution, and hence the site frequency spectrum (SFS), and the probability of fixation. They showed that although the expected strength of selection is zero, fluctuating selections leads to an increase in the probability of fixation, a decrease in diversity and a change in the SFS. Huerta-Sanchez et al. (2008) therefore suggested that fluctuating selection might generate artifactual evidence of adaptive evolution artifactutal evidence of adaptive evolution in MK type analyses. Here we investigate whether this indeed the case and analyse the average strength of selection of mutations contributing to divergence and polymorphism.
We use the basic two-allele model investigated by Huerta-Sanchez et al. (2008) in which the strength of selection varies each generation, with the expected strength of selection acting upon each allele being zero. Huerta-Sanchez et al. (2008) show that this model may be summarized in terms of the parameter where is the effective population size and is the variance in the strength of selection. Furthermore, they demonstrate that this model behaves identically in terms of the SFS and probability of fixation to one in which the strength of selection is autocorrelated between generations; the autocorrelation simply increases the value of . We investigated the model of Huerta-Sanchez et al. (2008) by simulation so that we can track the strength of selection acting upon each mutation as it segregates in the population. In our haploid simulation we introduce a new mutation at a frequency of , where is the population size, at a site that is monomorphic. The strength of selection acting upon the two alleles is then drawn from a normal distribution with a mean of 1 and a standard deviation of . Using the frequency of the new mutation and the strength of selection acting upon the two alleles, we calculated the expected frequency of the new mutation in the next generation, , and generated the actual frequency, , as a number drawn from a binomial distribution with sample size and probability . If the mutation is lost or fixed a new mutation is introduced and the simulation repeated, otherwise new selection strengths are sampled and another generation repeated. For each value of we simulated the evolution of 100,000 mutations. We used the simulated data to infer the expected SFS for a population sample of 20 chromosomes (similar results were obtained for other sample sizes).
For each mutation that is fixed, or that reaches any arbitrary frequency , we can calculate the mean strength of selection that has acted upon that mutation up to the time that we sample it. Let us define the true value of as the proportion of substitutions in which all mutations that have fixed have a mean strength of selection that is positive, during their passage through the population.
| (1) |
where is the number of nonsynonymous substitutions and is the number of nonsynonymous substitutions with a mean positive strength of selection at the time of fixation. We estimated using several commonly used methods. First we applied the method of Fay et al. (2001):
| (2) |
where , , and are the numbers of nonsynonymous and synonymous substitutions and polymorphisms, respectively. This method does not take into account the effect of slightly deleterious mutations, which tend to bias the estimate of downwards. We therefore applied two methods that attempt to correct for this bias. The first is the method of Eyre-Walker and Keightley (2009), and second the method of Schneider et al. (2011). The method of Eyre-Walker and Keightley (2009) assumes that advantageous mutations are strongly selected and do not contribute substantially to polymorphism. The method of Schneider et al. (2011) does not make this assumption and attempts to infer the proportion of mutations that are advantageous and the strength of selection acting in favour of them. For each method we contrast what happens at sites subject to a certain level of fluctuating selection to those at which there is no fluctuation. In both cases the expected strength of selection is zero; the sites with no fluctuation are therefore evolving neutrally. The simulation is set up such that there is free recombination between sites.
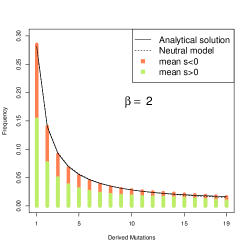
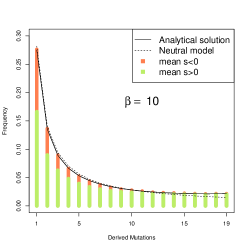
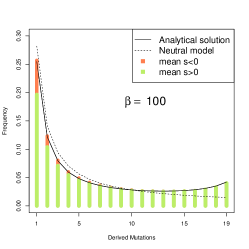
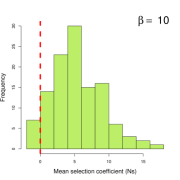
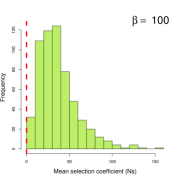
Our simulations demonstrate that fluctuating selection can generate evidence of adaptive evolution; all three of the methods to estimate yield positive estimates for all values of (Table 1). The fact that a fluctuating selection model generates evidence of adaptive evolution even when the expected strength of selection is zero suggests that fluctuating selection generates artifactual evidence of positive selection (Huerta-Sanchez et al., 2008). However, the mean strength of selection experienced by the mutation, that is sampled in a set of DNA sequences, or that spreads to fixation, might not be zero, even though its expected value over all mutations (not just those that fix) is zero; it might be that those mutations which spread to high frequency in the population are those, which just by chance have mean selective values that are positive, whilst those mutations which fluctuate to negative values are lost from the population. To investigate this we tracked the mean strength of selection of each mutation at each frequency up to when it was lost or fixed. From this analysis it is evident that the vast majority of mutations that contribute to the SFS are positively selected, except at very low frequencies and when fluctuations in the strength of selection are quite weak (Figure 1). The bias towards positive mean strengths of selection is even more extreme for those mutations that become fixed (Figure 2).
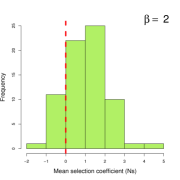
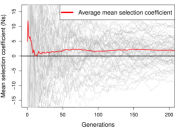
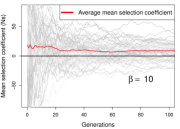
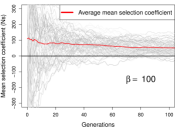
If we track mutations that ultimately become fixed it is evident that those mutations that start off being slightly negative quickly become positive in their mean value (Figure 3). Interestingly those that start off being highly positive tend to decrease in mean selection coefficient as well; this is probably a consequence of averaging over many selective episodes, and hence approaching the expected value. We also find that the average mean selection coefficient for all mutations that get fixed declines with time. This is because the critical time for an advantageous mutation is when it is rare because it is more likely to be lost. Those mutations that are strongly positively selected at an early stage have more chance of remaining in the population.
From our simulations it is possible to obtain , the proportion of fixations that have a mean selection coefficient that is positive and can therefore be considered as truly adaptive. The methods of Fay et al. (2001), Eyre-Walker and Keightley (2009) and Schneider et al. (2011) all consistently underestimate , although the effect appears to be more severe when fluctuating conditions are weak. The method of Schneider et al. (2011) is better than that of Eyre-Walker and Keightley (2009), which is better than that of Fay et al. (2001). It is perhaps not surprising that the method of Schneider et al. (2011) performs best since the vast majority of mutations that become fixed have a small average positive selection coefficient and such mutations are likely to contribute to polymorphism, which the other two methods assume does not happen.
We find, in agreement with the suggestion of Huerta-Sanchez et al. (2008), that the fluctuating selection does lead to a signature of adaptive evolution. However, we also show that those mutations contributing to polymorphism and divergence are on average positively selected during their lives, even though the expected strength selection is zero. We therefore conclude that the signature of adaptive evolution is genuine. However, it is also evident that methods to estimate the level of adaptive evolution tend to underestimate the contribution of mutations subject to fluctuating selection.
Literature Cited
- Bell (2010) Bell, G., 2010 Fluctuating selection: the perpetual renewal of adaptation in variable environments. Philos Trans R Soc Lond B Biol Sci 365: 87–97.
- Bierne and Eyre-Walker (2004) Bierne, N., and A. Eyre-Walker, 2004 The genomic rate of adaptive amino acid substitution in Drosophila. Mol Biol Evol 21: 1350–1360.
- Boyko et al. (2008) Boyko, A. R., S. H. Williamson, A. R. Indap, J. D. Degenhardt, R. D. Hernandez, et al., 2008 Assessing the evolutionary impact of amino acid mutations in the human genome. PLoS Genet 4: e1000083.
- Charlesworth and Eyre-Walker (2006) Charlesworth, J., and A. Eyre-Walker, 2006 The rate of adaptive evolution in enteric bacteria. Mol Biol Evol 23: 1348–1356.
- Chimpanzee Sequencing and Analysis Consortium (2005) Chimpanzee Sequencing and Analysis Consortium, 2005 Initial sequence of the chimpanzee genome and comparison with the human genome. Nature 437: 69–87.
- Eyre-Walker and Keightley (2009) Eyre-Walker, A., and P. D. Keightley, 2009 Estimating the rate of adaptive molecular evolution in the presence of slightly deleterious mutations and population size change. Mol Biol Evol 26: 2097–2108.
- Fay et al. (2001) Fay, J. C., G. J. Wyckoff, and C. I. Wu, 2001 Positive and negative selection on the human genome. Genetics 158: 1227–1234.
- Fisher and Ford (1947) Fisher, R., and E. Ford, 1947 The spread of a gene in natural conditions in a colony of the moth Panaxia dominula L. Heredity 1: 143–174.
- Gillespie (1973) Gillespie, J., 1973 Natural selection with varying selection coefficients—a haploid model. Genet. Res 21: 115–120.
- Gillespie (1991) Gillespie, J., 1991 The causes of molecular evolution, volume 2. Oxford University Press, USA.
- Gossmann et al. (2010) Gossmann, T. I., B.-H. Song, A. J. Windsor, T. Mitchell-Olds, C. J. Dixon, et al., 2010 Genome wide analyses reveal little evidence for adaptive evolution in many plant species. Mol Biol Evol 27: 1822–1832.
- Huerta-Sanchez et al. (2008) Huerta-Sanchez, E., R. Durrett, and C. D. Bustamante, 2008 Population genetics of polymorphism and divergence under fluctuating selection. Genetics 178: 325–337.
- Jensen (1973) Jensen, L., 1973 Random selective advantages of genes and their probabilities of fixation. Genet Res 21: 215–219.
- Karlin and Levikson (1974) Karlin, S., and B. Levikson, 1974 Temporal fluctuations in selection intensities: Case of small population size. Theoretical Population Biology 6: 383 – 412.
- Kimura (1954) Kimura, M., 1954 Process Leading to Quasi-Fixation of Genes in Natural Populations Due to Random Fluctuation of Selection Intensities. Genetics 39: 280–295.
- Lynch (1987) Lynch, M., 1987 The consequences of fluctuating selection for isozyme polymorphisms in Daphnia. Genetics 115: 657–669.
- McDonald and Kreitman (1991) McDonald, J. H., and M. Kreitman, 1991 Adaptive protein evolution at the Adh locus in Drosophila. Nature 351: 652–654.
- Mueller et al. (1985) Mueller, L. D., L. G. Barr, and F. J. Ayala, 1985 Natural selection vs. random drift: evidence from temporal variation in allele frequencies in nature. Genetics 111: 517–554.
- O’Hara (2005) O’Hara, R. B., 2005 Comparing the effects of genetic drift and fluctuating selection on genotype frequency changes in the scarlet tiger moth. Proc Biol Sci 272: 211–217.
- Schneider et al. (2011) Schneider, A., B. Charlesworth, A. Eyre-Walker, and P. D. Keightley, 2011 A Method for Inferring the Rate of Occurrence and Fitness Effects of Advantageous Mutations. Genetics .
- Slotte et al. (2010) Slotte, T., J. P. Foxe, K. M. Hazzouri, and S. I. Wright, 2010 Genome-wide evidence for efficient positive and purifying selection in Capsella grandiflora, a plant species with a large effective population size. Mol Biol Evol 27: 1813–1821.
- Smith and Eyre-Walker (2002) Smith, N. G. C., and A. Eyre-Walker, 2002 Adaptive protein evolution in Drosophila. Nature 415: 1022–1024.
- Strasburg et al. (2011) Strasburg, J. L., N. C. Kane, A. R. Raduski, A. Bonin, R. Michelmore, et al., 2011 Effective population size is positively correlated with levels of adaptive divergence among annual sunflowers. Mol Biol Evol 28: 1569–1580.
- Takahata et al. (1975) Takahata, N., K. Ishii, and H. Matsuda, 1975 Effect of temporal fluctuation of selection coefficient on gene frequency in a population. Proc Natl Acad Sci U S A 72: 4541–4545.
- Waxman (2011) Waxman, D., 2011 A unified treatment of the probability of fixation when population size and the strength of selection change over time. Genetics 188: 907–913.
- Zhang and Li (2005) Zhang, L., and W.-H. Li, 2005 Human SNPs reveal no evidence of frequent positive selection. Mol Biol Evol 22: 2504–2507.
Figures and Tables
| (MK | (MKb) | (MKc) | ||
| 1 | 0.72 | 0.09 | 0.22 | 0.84 |
| 2 | 0.76 | 0.15 | 0.26 | 0.30 |
| 3 | 0.85 | 0.33 | 0.39 | 0.52 |
| 4 | 0.92 | 0.45 | 0.52 | 0.64 |
| 5 | 0.93 | 0.43 | 0.50 | 0.73 |
| 10 | 0.97 | 0.61 | 0.68 | 0.81 |
| 20 | 0.99 | 0.70 | 0.74 | 0.85 |
| 30 | 0.99 | 0.77 | 0.81 | 0.89 |
| 50 | 1.00 | 0.83 | 0.86 | 0.92 |
| 100 | 1.00 | 0.90 | 0.93 | 0.95 |
| aFay et al. (2001) | ||||
| bEyre-Walker and Keightley (2009) | ||||
| cSchneider et al. (2011) | ||||
Estimates of adaptive divergence, , for polymorphism and divergence simulated under varying random fluctuating selection. Three different MK type tests were used. The intensity of the fluctuation is denoted by .