000–000
Characterisation of the Galactic thick disk
Abstract
Thick disks appear to be common in external large spiral galaxies and our own Milky Way also hosts one. The existence of a thick disk is possibly directly linked to the formation history of the host galaxy and if its properties is known it can constrain models of galaxy formation and help us to better understand galaxy formation and evolution. This brief review attempts to highlight some of the characteristics of the Galactic thick disk and how it relates to other stellar populations such as the thin disk and the Galactic bulge. Focus has been put on results from high-resolution spectroscopic data obtained during the last 10 to 15 years.
keywords:
stars: abundances, stars: kinematics, Galaxy: abundances, Galaxy: disk1 Introduction
More than three decades ago, Tsikoudi (1979) and Burstein (1979) found the first observational evidence for second, and thicker, disk components in external edge-on galaxies. A few years later Gilmore & Reid (1983) found the first evidence for a second stellar component in the Milky Way disk by studying the stellar density as a function of distance from the Galactic plane towards the Galactic North pole. Since then the general consensus has been that also the Milky Way harbours a dual disk stellar system, a thin disk and a thick disk. Recent studies actually show that many, if not all, edge-on spiral galaxies appears to host dual disk systems (Yoachim & Dalcanton, 2006; Comerón et al., 2011). As the Milky Way currently is the only galaxy that can be studied in great detail with high-resolution spectrographs, and may serve as a “benchmark galaxy” for extra-galactic studies, it is utterly important, also in the context of galaxy formation and as tests of models of galaxy formation, to establish the properties of the different Milky Way stellar populations.
Since the discovery of the Galactic thick disk many observational studies have aimed at characterising the stellar disk (e.g., Edvardsson et al., 1993; Feltzing & Gustafsson, 1998) and later especially targeting the thick disk, and its differences relative to the thin disk (e.g., Fuhrmann, 1998, 2000, 2004, 2008, 2011; Prochaska et al., 2000; Gratton et al., 2000; Chen et al., 2000; Mashonkina & Gehren, 2001; Tautvaišienė et al., 2001; Bensby et al., 2003, 2004b, 2005, 2007b; Soubiran et al., 2003; Reddy et al., 2003, 2006; Adibekyan et al., 2012). The observational evidence presented by these studies have so far pointed to two disk populations with different chemical and age properties indicating that the Galactic thin and thick disk have different origins and have experienced different chemical histories.
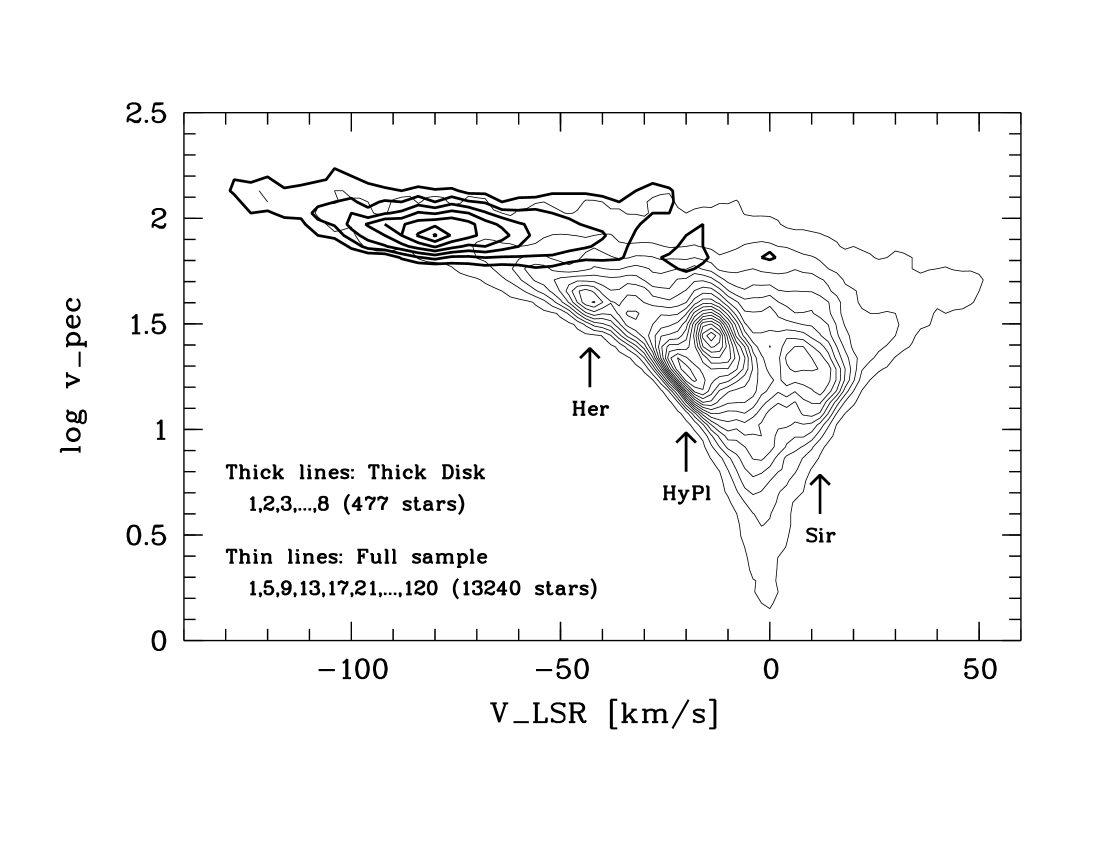
However, albeit more than two decades of observational effort we are still lacking much information about the complex abundance structure of the Galactic stellar disk. For instance, the Geneva-Copenhagen Survey (hereafter GCS) by Nordström et al. (2004) contains approximately 16 000 dwarf stars in the Solar neighbourhood, all of which have full three-dimensional kinematic information available, as well as ages and metallicities estimated from Strömgren photometry. It is evident from the GCS that there is a lot of kinematic sub-structure in the solar neighbourhood (see Fig. 1). While the thin and thick disks are the dominating populations there are many smaller structures superimposed on the underlying disk distribution. Most of these are young streams and moving groups that belong to the thin disk, but there are also features such as the Hercules stream that share some of the thick disk kinematic properties (e.g. Famaey et al., 2005). It has later been shown that the Hercules stream most likely is a dynamical feature in velocity space caused by the Galactic bar, and that it consists of a mixture of thin and thick disk stars (e.g., Bensby et al., 2007a).
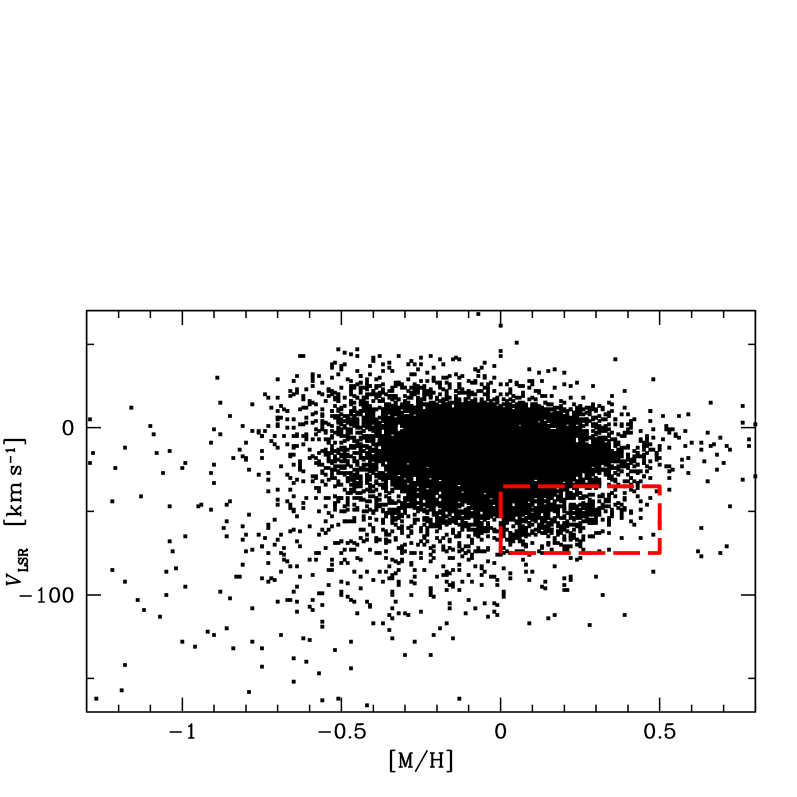
Looking at the GCS data it is also evident that stars with typical thick-disk kinematics can be found at high metallicities, even well above solar (see Fig. 2). The question is where the high-metallicity limit of the thick disk is and if these stars are true thick disk stars? It is also not clear to how low metallicities the thin disk reach, and if there is a gap in the abundance trends between the thin and thick disks.
I will here highlight some of the characteristics of the Galactic thick disk with focus on results from high-resolution spectroscopic studies during the last 10 to 15 years. This is no exhaustive and full summary, and there are several other aspects of the thick disk that needs further attention.
2 Properties of the Galactic thick disk
2.1 General properties
In summary, the general consensus regarding the thick disk is that it has a metallicity distribution (MDF) that peaks around (e.g., Gilmore et al., 1995; Carollo et al., 2010), while the thin disk MDF peaks at (e.g., Casagrande et al., 2011). At a given metallicity the thick disk stars show higher enhancement in the -element abundances than the thin disk stars (e.g., Prochaska et al., 2000; Reddy et al., 2003; Soubiran et al., 2003; Bensby et al., 2003, 2004b, 2005; Reddy et al., 2006; Bensby et al., 2007b; Adibekyan et al., 2012). For an -element, such as O, Mg, Si, Ca, or Ti, the [/Fe] abundance ratio for the thick disk shows a flat plateau from to , hereafter it starts to decline toward solar values. The plateau is caused by the rapid chemical enrichment from massive stars, while the down-turn, or “knee” is attributed to the onset of enrichment from SN Ia. The appearance of the thin disk [/Fe] abundance trends are quite different, starting out a lower enhancement, and then showing a constant slow decline toward super-solar metallicities. An example of the thin and thick disk abundance trends is shown for oxygen in Fig. 3.

Furthermore, the stars of the thick disk are generally old with ages between 8 to 12 Gyr, in contrast to the stars of the thin disk that usually are young (e.g., Bensby et al., 2003; Schuster et al., 2006; Haywood, 2006). It may also contain an age-metallicity relation (e.g., Bensby et al., 2004a) which the thin disk does not have.
The existence, or non-existence, of radial and vertical abundance gradients in the thick disk is difficult to establish due to the problems of selecting clean thin and thick disk stellar samples. However, using the SDSS SEGUE dwarf sample Cheng et al. (2012b) see a flat radial gradient for stars located 1 to 1.5 kpc from the plane that most likely can be associated with the thick disk. Also, from 22 000 stars in SDSS DR3 Allende Prieto et al. (2006) finds a flat radial metallicity gradient for the thick disk between galactocentric radii 4 to 15 kpc, and furthermore that no vertical abundance gradient is apparent for the thick disk.
2.2 A nearby volume-complete sample
Klaus Fuhrmann has in a series of papers (Fuhrmann, 1998, 2000, 2004, 2008, 2011) analysed what is quoted as a volume-complete sample of all nearby ( pc) mid-F-type to early K-type stars down to and north of a declination of . This analysis is particularly valuable thanks to its internal consistency and homogeneity. In these papers Fuhrmann finds that there are essentially two types of stars in his sample: stars with high abundances of Mg relative to Fe, and stars with low abundances of Mg relative to Fe. The two subsets overlap significantly in [Fe/H]. The stars with higher [Mg/Fe] abundance ratios are also the oldest stars. Both sets of stars, but in particular the low [Mg/Fe] stars, show a very tight abundance trend for [Mg/Fe] versus [Fe/H]. Fuhrmann identifies these two sub-samples with the thick and thin disks, respectively. The identification is based on an interpretation of a combination of the age, kinematic and abundance data.
In addition a few stars are found to show [Mg/Fe] ratios that are in-between those of the two major sub-samples. These are given the status of “transition” stars and are considered to be neither thin nor thick disk members.
The most important part of these studies by Fuhrmann is that they show that if a reasonably volume-complete sample is constructed for stars in the vicinity of the Sun, then the elemental abundances (and ages) slit these stars into two major groups, one with enhanced [Mg/Fe] ratios, and one with almost solar values. However, the Fuhrmann sample only contains slightly over 20 stars out of almost 400 stars that have age and abundance patterns that make them potential thick disk stars, and they only reach metallicities slightly above . What about the kinematically hot and metal-rich stars that are present in the GCS? These are clearly not present in the very nearby sample, and it is evident that in order to study the thick disk at its extremes we need to probe a larger volume than Fuhrmann’s.
2.3 Kinematically selected samples
In the Solar neighbourhood, in the Galactic plane, more than 90 % of the stars are believed to be thin-disk stars, and less than 10 % thick-disk stars. However, as the thin disk has a much shorter scale-height than the thick disk, the relative stellar density between the two populations will vary with distance from the plane. Assuming scale-heights of 300 pc and 1000 pc, and normalisations of 90 % and 10 %, for the thin and thick disks, respectively, Fig. 4 shows how the stellar density varies as a function of distance from the Galactic plane. One sees that at a distance of 1 kpc from the plane the thin and thick disk stellar densities are about the same, and that at distances greater than 2 kpc the thick disk clearly dominates over the thin disk. Hence one needs to go to distances of at least kpc from the plane in order to get a relatively clean thick disk sample (the stellar halo starts to dominate much farther from the plane). However, at these distances F and G dwarf stars have magnitudes around 16 to 17 making it very time consuming to get high-resolution spectra with high signal-to-noise ratios. They are simply too faint even for today’s large 8-10 m telescopes to observe in large quantities.

What has instead been done the past 10 to 15 years is to rely on kinematic criteria to select candidate thick disk stars from nearby stellar samples (typically within 100-200 pc from the Sun, i.e., the Hipparcos sphere) (see, e.g., Bensby et al., 2003). In order to calculate probabilities one needs an estimation of the overall velocity distribution (and assuming Gaussian distributions) of the stellar population, how much its lags behind the local standard of rest (LSR), and its relative stellar density in the solar neighbourhood. The best values for the velocity distributions, rotational lags, and normalisations, are often difficult to estimate, but some commonly used values are listed in Table 1.
| ———– [km s-1] ———– | ||||||
| Thin disk | 35 | 20 | 16 | 0 | 0.85 | |
| Thick disk | 67 | 38 | 35 | 0 | 0.09 | |
| Halo | 160 | 90 | 90 | 0 | 0.0015 | |
| Hercules | 26 | 9 | 17 | 0.06 | ||
Applying these criteria to a catalogue such as for example the Geneva-Copenhagen survey (GCS) (Nordström et al., 2004), that contains roughly 16 000 nearby dwarf stars with full three-dimensional kinematical information allows you to calculate probabilities for individual stars of belonging different populations (see, e.g., Bensby et al., 2003). As the GCS also contains metallicities and ages based on Strömgren photometry for a majority of the 16 000 stars, give the opportunity to probe the thin and thick disks at their extreme metallicities.
Studies that have utilised kinematical criteria to investigate the properties of the thin and thick disks are, e.g., Prochaska et al. (2000); Reddy et al. (2003); Soubiran et al. (2003); Bensby et al. (2003, 2004b, 2005); Reddy et al. (2006); Bensby et al. (2007b); Adibekyan et al. (2012), wherein nice figures can be found that show the elemental abundance trends of the thin and thick disks. In summary, the studies above generally find that the thin and thick disks have different abundance trends.
A shortcoming of the kinematical method to classify stars into different populations is that it will introduce bias, or mixing, between the selected thin and thick disk samples. Stars from the high-velocity tail of the thin disk will be classified as thick disk stars and stars from the low-velocity tail of the thick disk as thin disk stars. In Bensby et al. (2013a) this is investigated and it is shown that stellar age might be a better discriminator between the thin and thick disks. By selecting one sample of stars that are older than Gyr and one where the stars are younger than Gyr, the abundance trends become apparently cleaner with less mixing between the two populations (see, e.g., Fig. 2 in Bensby & Feltzing 2010). The problems with using stellar ages is that good ages are only possible to determine for stars near or around the main sequence turn-off and on the sub-giant branch. For red giant samples or more distant samples kinematical criteria might be the only solution. One should then bear in mind that kinematic mixing could be significant.
2.4 The dichotomy of the Galactic disk
A question that has recently surfaced and been debated is if the Milky Way disk really has two distinct stellar populations. Based on the SDSS SEGUE G and K dwarf stellar sample (Abazajian et al., 2009; Yanny et al., 2009), Bovy et al. (2012) instead argues that the abundance pattern of the Galactic stellar disk can be represented by a continuous function of mono-abundance populations with increasing scale-heights, and hence no distinct thick disk should be claimed.
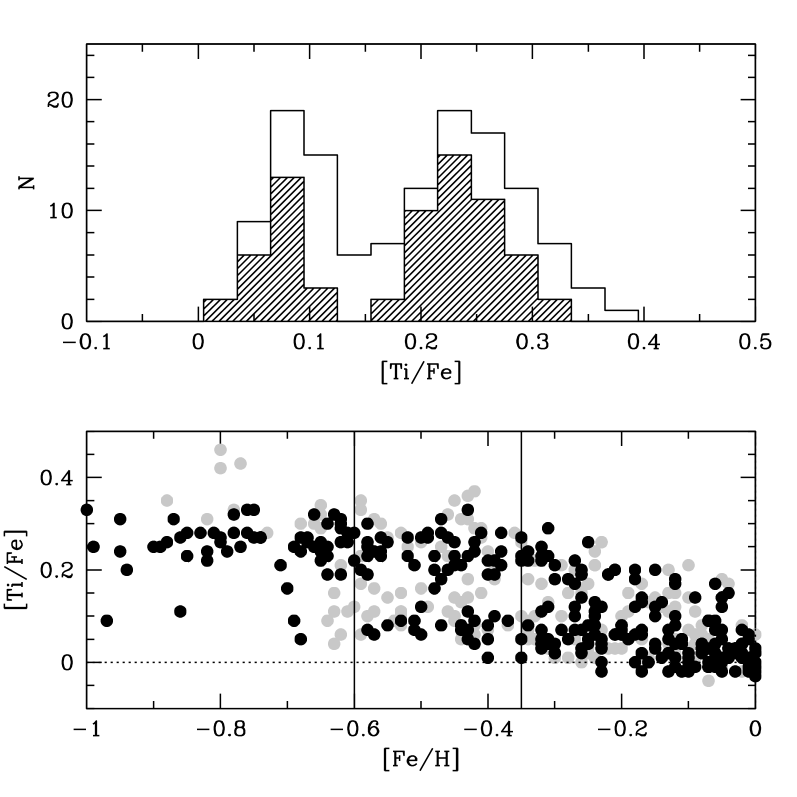
If truly distinct and well-separated abundance trends between the thin and thick disks could be confirmed, the claims by Bovy et al. (2012) could be weakened. Using the data sample of 1111 stars by Adibekyan et al. (2012), clues of a two-phase formation history of the Milky Way disk is seen by Haywood et al. (2013). Additionally, Bensby et al. (2013a) see a void of stars in the -element abundance trends in a sample of 700 kinematically selected F and G dwarf stars. This void remains, even if stars with kinematic properties in-between the two disks are included. It becomes even clearer and more separated if the sample is constrained to a narrow range in temperature between 5600 and 6100 K (see Fig. 5). The stellar parameters and elemental abundances for stars outside this temperature range are more susceptible to NLTE effects and uncertainties (see Bensby et al., 2013a, for discussion). This shows that small signatures, such as the separation between the thin and thick disk abundance trends, can be smeared out if sufficient care is not taken in the analysis and sample selection.
Further clues to a distinction between the thin and thick disks is hinted in their age structures. For instance, most thick disk stars have ages around 10 Gyr, but as you go to higher metallicities they become slightly younger, and the most metal-rich stars that can be associated with the thick disk at have ages of about 8 Gyr (Bensby et al., 2007b). The stars of the thin disk are, on the other hand, younger, with the oldest stars at being around 7 Gyr.
This time epoch where we see a separation between the two disks, around 8 Gyr ago, coincides with other observational evidence for mergers between the Milky Way and another (dwarf) galaxy. For instance, Gilmore et al. (2002) and Wyse et al. (2006) claims to have detected debris stars from a major merger 10 Gyr ago, and Deason et al. (2013) finds that the density profile of the Milky Way halo is broken, and that this break likely is associated with a an early (6-9 Gyr ago) and massive accretion event.
3 The inner and outer disk
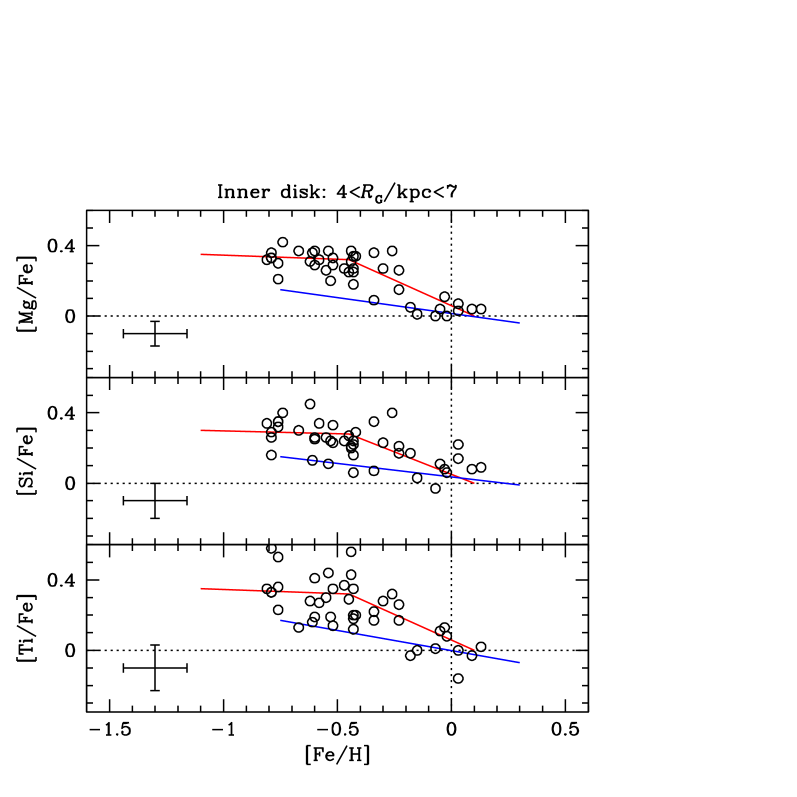
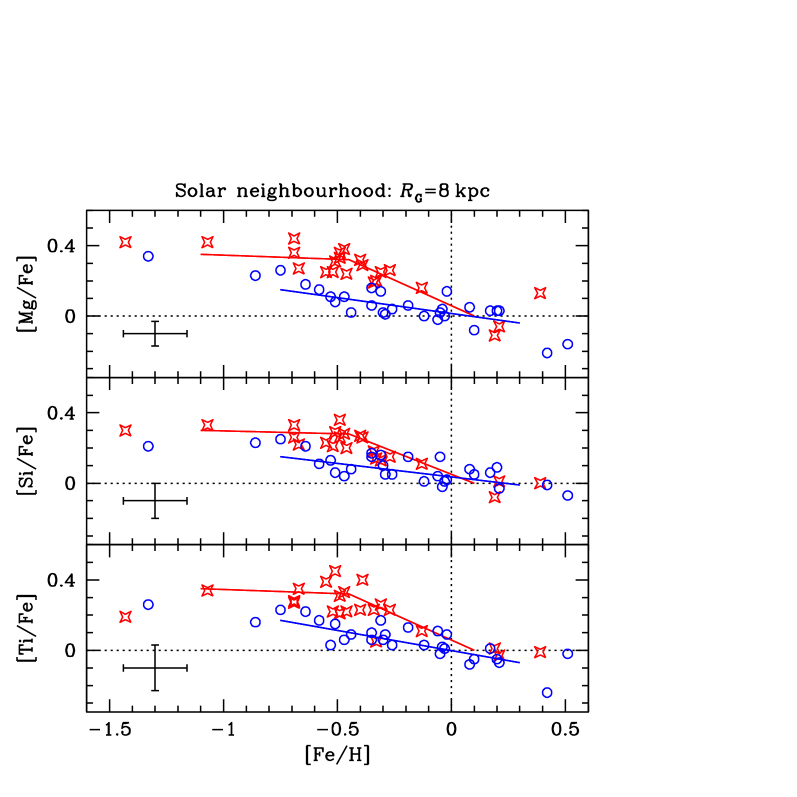
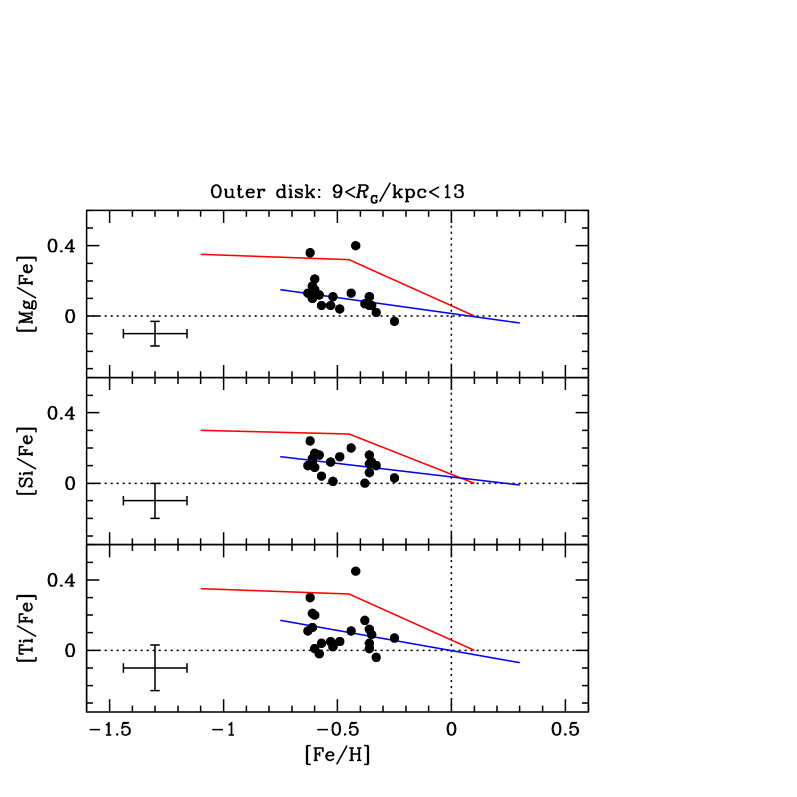
The thick disk and its relationship to the thin disk has so far mainly been studied at the solar galactocentric radius. The existence of the thick disk in the inner and outer regions of the Galactic disk is less established. In a first study Bensby et al. (2010a) observed 44 red giants in the inner disk at galactocentric radii between 4 to 7 kpc and at different heights from the Galactic plane. Those results showed that the abundance trends seen in the solar neighbourhood are also seen in the inner disk region, pointing to that a dual disk structure is also present in the inner disk (see left panel in Fig. 6). In a subsequent similar study of 20 red giants in the outer disk Bensby et al. (2011b), the abundance structure appeared very different compared to the inner disk results (see right panel in Fig. 6). There were essentially no traces of the abundance signatures that usually are associated with the thick disk and which is seen in the inner disk and in the solar neighbourhood. The conclusion from Bensby et al. (2011b) was that the scale-length of the thick disk is significantly shorter than that of the thin disk, and hence the apparent lack of thick disk stars in the outer disk. Evidence for a short scale-length for the thick disk was later also seen in the SDSS G dwarf sample by Cheng et al. (2012a).
4 Similarities to the Galactic bulge
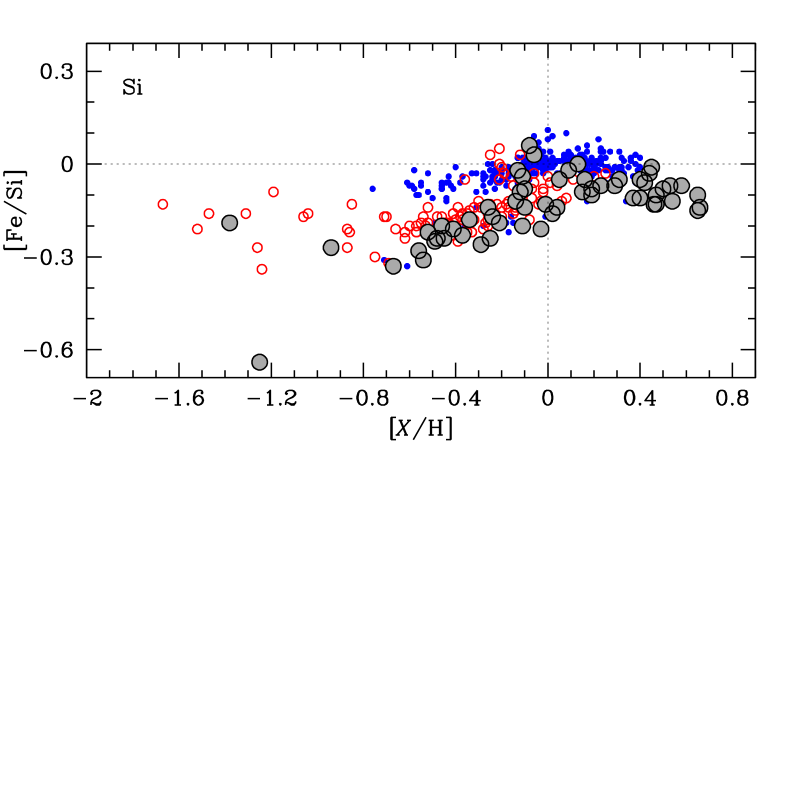
A possible connection between the thick disk and the Galactic bulge was first presented by Meléndez et al. (2008) who showed that the -element trends of a handful of bulge red giants to those of nearby red giants were similar, and hence that the bulge and the thick disk possibly could have had very similar chemical and star formation histories. Subsequent studies of red giants (e.g., Alves-Brito et al., 2010; Ryde et al., 2010; Gonzalez et al., 2011) and microlensed dwarf stars (Bensby et al., 2009, 2010b, 2011a, 2013b) confirm the similarities in the abundance trends between the (metal-poor) bulge and thick disk. However, the latest paper on microlensed bulge dwarf stars show that there might be a slight difference in the abundance trends in the sense that the position of the “knee” in the bulge [/Fe] trend occurs at a slightly higher [Fe/H], pointing to that the star formation history was slightly faster in the bulge than in the thick disk (Bensby et al., 2013b). Figure 7 shows the [Fe/Si]-[Si/H] abundance trends for the thin and thick disk dwarf sample from Bensby et al. (2013a) and the microlensed bulge dwarfs from Bensby et al. (2013b).
Additional signs of a possible connection between the bulge and the thick disk comes from that the metallicity distributions are similar (e.g., Hill et al., 2011) and that the ages are old (around or above 10 Gyr) (Bensby et al., 2013b) for thick disk and the metal-poor bulge.
Whether these connections imply a direct connection between the thick disk and bulge, or not, is currently unclear and needs to be further investigated.
5 Summary
In summary, it appears as if the Milky Way galaxy has two stellar disk populations that are distinct in abundance space as well as in stellar ages. They do, however, appear to show a considerable overlap in velocity space. It also appears as if the radial extension of the thick disk is quite short, and that the thin disk is dominating at larger galactocentric radii. Based on similarities of elemental abundances and stellar ages there might also be a connection between the metal-poor bulge and the thick disk. Whether they are directly connected or if they have just experienced similar chemical and star formation histories is unclear.
There are several ongoing and upcoming large spectroscopic surveys that will probe the abundance structure of the Galactic disk that will help us to disentangle different stellar components and unravelling the outer disk. Examples are the SDSS SEGUE (Yanny et al., 2009), APOGEE (Allende Prieto et al., 2008), the Gaia-ESO Survey (Gilmore et al., 2012), the GALAH survey (e.g., Zucker et al., 2012) that will provide abundance data for several hundreds of thousands of stars. Combined with the astrometric data from the upcoming Gaia satellite, we should get a much clearer picture of the structure, formation, and evolution of the Milky Way and its stellar populations.
Acknowledgements.
T.B. was funded by grant No. 621-2009-3911 from The Swedish Research Council.References
- Abazajian et al. (2009) Abazajian, K. N., Adelman-McCarthy, J. K., Agüeros, M. A., et al. 2009, ApJS, 182, 543
- Adibekyan et al. (2012) Adibekyan, V. Z., Sousa, S. G., Santos, N. C., et al. 2012, A&A, 545, A32
- Allende Prieto et al. (2006) Allende Prieto, C., Beers, T. C., Wilhelm, R., et al. 2006, ApJ, 636, 804
- Allende Prieto et al. (2008) Allende Prieto, C., Majewski, S. R., Schiavon, R., et al. 2008, Astronomische Nachrichten, 329, 1018
- Alves-Brito et al. (2010) Alves-Brito, A., Meléndez, J., Asplund, M., Ramírez, I., & Yong, D. 2010, A&A, 513, A35
- Bensby (2004) Bensby, T. 2004, Ph.D. Thesis, Lund University
- Bensby et al. (2011a) Bensby, T., Adén, D., Meléndez, J., et al. 2011a, A&A, 533, A134
- Bensby et al. (2010a) Bensby, T., Alves-Brito, A., Oey, M. S., Yong, D., & Meléndez, J. 2010a, A&A, 516, L13
- Bensby et al. (2011b) Bensby, T., Alves-Brito, A., Oey, M. S., Yong, D., & Meléndez, J. 2011b, ApJ, 735, L46
- Bensby & Feltzing (2010) Bensby, T. & Feltzing, S. 2010, in IAU Symposium, Vol. 265, IAU Symposium, ed. K. Cunha, M. Spite, & B. Barbuy, 300–303
- Bensby et al. (2010b) Bensby, T., Feltzing, S., Johnson, J. A., et al. 2010b, A&A, 512, A41
- Bensby et al. (2003) Bensby, T., Feltzing, S., & Lundström, I. 2003, A&A, 410, 527
- Bensby et al. (2004a) Bensby, T., Feltzing, S., & Lundström, I. 2004a, A&A, 421, 969
- Bensby et al. (2004b) Bensby, T., Feltzing, S., & Lundström, I. 2004b, A&A, 415, 155
- Bensby et al. (2005) Bensby, T., Feltzing, S., Lundström, I., & Ilyin, I. 2005, A&A, 433, 185
- Bensby et al. (2013a) Bensby, T., Feltzing, S., & Oey, M. S. 2013a, A&A, submitted
- Bensby et al. (2009) Bensby, T., Johnson, J. A., Cohen, J., et al. 2009, A&A, 499, 737
- Bensby et al. (2007a) Bensby, T., Oey, M. S., Feltzing, S., & Gustafsson, B. 2007a, ApJ, 655, L89
- Bensby et al. (2013b) Bensby, T., Yee, J. C., Feltzing, S., et al. 2013b, A&A, 549, A147
- Bensby et al. (2007b) Bensby, T., Zenn, A. R., Oey, M. S., & Feltzing, S. 2007b, ApJ, 663, L13
- Bovy et al. (2012) Bovy, J., Rix, H.-W., & Hogg, D. W. 2012, ApJ, 751, 131
- Burstein (1979) Burstein, D. 1979, ApJ, 234, 829
- Carollo et al. (2010) Carollo, D., Beers, T. C., Chiba, M., et al. 2010, ApJ, 712, 692
- Casagrande et al. (2011) Casagrande, L., Schönrich, R., Asplund, M., et al. 2011, A&A, 530, A138
- Chen et al. (2000) Chen, Y. Q., Nissen, P. E., Zhao, G., Zhang, H. W., & Benoni, T. 2000, A&AS, 141, 491
- Cheng et al. (2012a) Cheng, J. Y., Rockosi, C. M., Morrison, H. L., et al. 2012a, ApJ, 752, 51
- Cheng et al. (2012b) Cheng, J. Y., Rockosi, C. M., Morrison, H. L., et al. 2012b, ApJ, 746, 149
- Comerón et al. (2011) Comerón, S., Elmegreen, B. G., Knapen, J. H., et al. 2011, ApJ, 741, 28
- Deason et al. (2013) Deason, A. J., Belokurov, V., Evans, N. W., & Johnston, K. V. 2013, ApJ, 763, 113
- Edvardsson et al. (1993) Edvardsson, B., Andersen, J., Gustafsson, B., et al. 1993, A&A, 275, 101
- Famaey et al. (2005) Famaey, B., Jorissen, A., Luri, X., et al. 2005, A&A, 430, 165
- Feltzing & Gustafsson (1998) Feltzing, S. & Gustafsson, B. 1998, A&AS, 129, 237
- Fuhrmann (1998) Fuhrmann, K. 1998, A&A, 338, 161
- Fuhrmann (2000) Fuhrmann, K. 2000, unpublished
- Fuhrmann (2004) Fuhrmann, K. 2004, Astronomische Nachrichten, 325, 3
- Fuhrmann (2008) Fuhrmann, K. 2008, MNRAS, 384, 173
- Fuhrmann (2011) Fuhrmann, K. 2011, MNRAS, 414, 2893
- Gilmore et al. (2012) Gilmore, G., Randich, S., Asplund, M., et al. 2012, The Messenger, 147, 25
- Gilmore & Reid (1983) Gilmore, G. & Reid, N. 1983, MNRAS, 202, 1025
- Gilmore et al. (1995) Gilmore, G., Wyse, R. F. G., & Jones, J. B. 1995, AJ, 109, 1095
- Gilmore et al. (2002) Gilmore, G., Wyse, R. F. G., & Norris, J. E. 2002, ApJ, 574, L39
- Gonzalez et al. (2011) Gonzalez, O. A., Rejkuba, M., Zoccali, M., et al. 2011, A&A, 530, A54
- Gratton et al. (2000) Gratton, R. G., Carretta, E., Matteucci, F., & Sneden, C. 2000, A&A, 358, 671
- Haywood (2006) Haywood, M. 2006, MNRAS, 371, 1760
- Haywood et al. (2013) Haywood, M., Di Matteo, P., Lehnert, M., Katz, D., & Gomez, A. 2013, arXiv:1305.4663 [astro-ph.GA]
- Hill et al. (2011) Hill, V., Lecureur, A., Gómez, A., et al. 2011, A&A, 534, A80
- Mashonkina & Gehren (2001) Mashonkina, L. & Gehren, T. 2001, A&A, 376, 232
- Meléndez et al. (2008) Meléndez, J., Asplund, M., Alves-Brito, A., et al. 2008, A&A, 484, L21
- Nissen et al. (2002) Nissen, P. E., Primas, F., Asplund, M., & Lambert, D. L. 2002, A&A, 390, 235
- Nordström et al. (2004) Nordström, B., Mayor, M., Andersen, J., et al. 2004, A&A, 418, 989
- Prochaska et al. (2000) Prochaska, J. X., Naumov, S. O., Carney, B. W., McWilliam, A., & Wolfe, A. M. 2000, AJ, 120, 2513
- Reddy et al. (2006) Reddy, B. E., Lambert, D. L., & Allende Prieto, C. 2006, MNRAS, 367, 1329
- Reddy et al. (2003) Reddy, B. E., Tomkin, J., Lambert, D. L., & Allende Prieto, C. 2003, MNRAS, 340, 304
- Ryde et al. (2010) Ryde, N., Gustafsson, B., Edvardsson, B., et al. 2010, A&A, 509, A20
- Schuster et al. (2006) Schuster, W. J., Moitinho, A., Márquez, A., Parrao, L., & Covarrubias, E. 2006, A&A, 445, 939
- Soubiran et al. (2003) Soubiran, C., Bienaymé, O., & Siebert, A. 2003, A&A, 398, 141
- Tautvaišienė et al. (2001) Tautvaišienė, G., Edvardsson, B., Tuominen, I., & Ilyin, I. 2001, A&A, 380, 578
- Tsikoudi (1979) Tsikoudi, V. 1979, ApJ, 234, 842
- Wyse et al. (2006) Wyse, R. F. G., Gilmore, G., Norris, J. E., et al. 2006, ApJ, 639, L13
- Yanny et al. (2009) Yanny, B., Rockosi, C., Newberg, H. J., et al. 2009, AJ, 137, 4377
- Yoachim & Dalcanton (2006) Yoachim, P. & Dalcanton, J. J. 2006, AJ, 131, 226
- Zucker et al. (2012) Zucker, D. B., de Silva, G., Freeman, K., Bland-Hawthorn, J., & Hermes Team. 2012, in Astronomical Society of the Pacific Conference Series, Vol. 458, Galactic Archaeology: Near-Field Cosmology and the Formation of the Milky Way, ed. W. Aoki, M. Ishigaki, T. Suda, T. Tsujimoto, & N. Arimoto, 421
Juntai ShenThe bulge and thick disk stars share some similarities. Could they be related somehow?
Thomas BensbySee discussion in Sect. 4.
Johannes AndersenTwo things bother me: (1) Getting membership possibilities by modelling the velocity distribution as a sum of two Gaussians seems to be a dubious affair, when the actual velocity distribution (e.g., from the GCS) looks nothing like that. (2) Stellar ages tend to have uncertainties of 25 % in the best cases, so ages quoted without uncertainties tend to make the picture clearer than it actually is.
Thomas BensbyI agree that the Gaussian assumption is not correct, but we use it only as a starting point to select candidate thin and thick disk stars that we later observe with high-resolution spectrographs. Based on the succeeding analysis of these spectra we get ages and elemental abundances that can further help us to sort out the different stellar populations. Furthermore, most of the small scale structure seen in the UV-plane consists of young stellar streams. Most of these are true members of the thin disk and our Gaussian selection criteria are wide enough that these young streams are, correctly, classified as thin disk.