Two populations of gamma-ray burst radio afterglows
Abstract
The detection rate of gamma-ray burst (GRB) afterglows is only at radio wavelengths, much lower than in the X-ray () or optical () bands. The cause of this low radio detection rate has previously been attributed to limited observing sensitivity. We use visibility stacking to test this idea, and conclude that the low detection rate is instead due to two intrinsically different populations of GRBs, radio bright and radio faint. We calculate that no more than 70% of GRB afterglows are truly radio bright, leaving a significant population of GRBs that lack a radio afterglow. These radio bright GRBs have higher gamma-ray fluence, isotropic energies, X-ray fluxes and optical fluxes than the radio faint GRBs, confirming the existence of two physically distinct populations. We suggest that the gamma-ray efficiency of the prompt emission is responsible for the difference between the two populations. We also discuss the implications for future radio and optical surveys.
Subject headings:
gamma-ray: bursts1. Introduction
The standard gamma-ray burst (GRB) afterglow model (Piran, 1999; Woosley & Bloom, 2006) describes the afterglow as an expanding fireball. The shape and evolution of the afterglow spectrum contain a number of spectral and temporal breaks that depend on the environment into which the ejecta are expanding and on the micro-physical properties of the shock. The radio afterglow is a product of the GRB ejecta interacting with the circumstellar material.
The Swift satellite (Gehrels et al., 2004) was the first mission that could provide fast localization of GRBs good enough that ground based optical follow up could be obtained for a large number of bursts. However even after many years of ground based optical and IR follow up, only of GRBs had a detectable optical afterglow, with the optically non-detected GRBs labeled as “dark” GRBs (Jakobsson et al., 2004). The difference between the dark and normal GRBs was eventually found to be a combination of extrinsic factors (extinction, redshift, and observing delay) rather than intrinsic factors such as luminosity (Greiner et al., 2011). When observations are begun within 4 hours of the burst, optical afterglows are detected of the time (Greiner et al., 2011).
At radio wavelengths the detection rate of GRB afterglows is even lower (, Chandra & Frail, 2012) than at optical or X-ray wavelengths. It has been generally accepted that the low detection rates are due to instrumental sensitivity (eg, Frail, 2005), however this cause has not yet been tested experimentally.
2. GRB radio afterglows
In a recent review of the radio properties of GRB afterglows, Chandra & Frail (2012) present a large archival sample of radio observations of GRBs. Despite the large number of radio observations (2995), only 95 of the 304 GRBs observed had a confirmed radio afterglow. In their review, Chandra & Frail (2012) point out that the upper limits on and detected fluxes of radio afterglows are not significantly different. Figure 1 shows the distribution of detected fluxes and upper limits for GRB radio afterglows at GHz in the first five days after the burst.
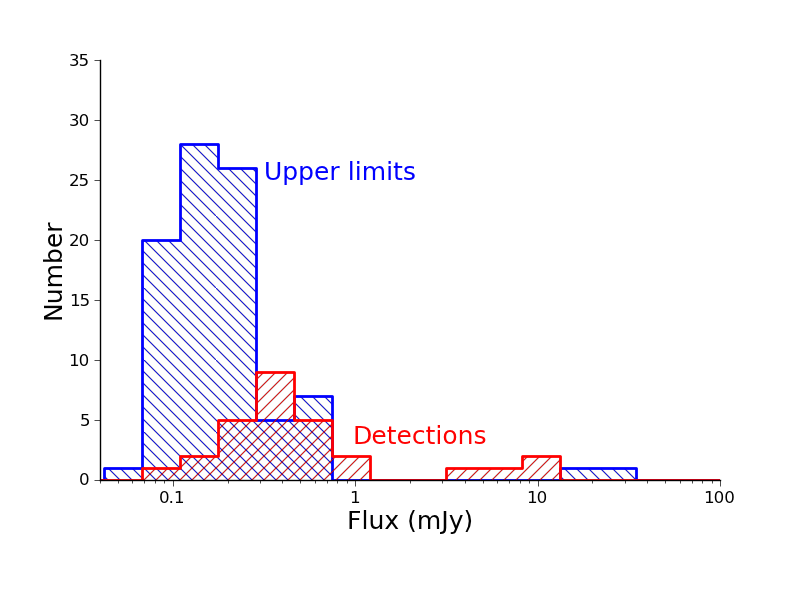
We refer to GRBs with detected radio afterglows as radio bright GRBs, and those without detected radio afterglows as radio faint GRBs. Once can consider three possible explanations for the low detection rate of GRB radio afterglows: redshift, observing sensitivity, or intrinsic differences between two sub-types of GRB. If we assume that the radio bright and radio faint GRB samples are intrinsically the same but at different redshifts then we would expect that the bright GRBs are bright only because they are nearer to us than the faint GRBs. It is therefore possible that the difference between the bright and faint samples is simply an artifact of their different redshift distributions. If the redshift distributions of the two populations are the same, then a population of GRBs with an intrinsically broad luminosity distribution would be artificially divided into two populations of radio bright and radio faint GRBs simply because of limited observing sensitivity. In this situation the low detection rate is nothing more than an artifact of limited sensitivity.
However, if the detection of GRB radio afterglows is biased by observing sensitivity then it should be possible to extract the mean afterglow flux using visibility stacking (Hancock et al., 2011). In this paper we perform visibility stacking on observations from the Very Large Array (VLA) in order to determine the extent to which observing sensitivity is responsible for observed differences between the radio bright and radio faint samples. In §3 we show that the redshift distributions of the radio bright and radio faint samples of GRB afterglows are the same. In §4 we test whether observing sensitivity can explain the difference between the two samples; we find that it cannot and that the two samples of GRBs represent physically distinct populations. In §5 we show that the two populations also have distinct properties at other wavelengths, and in §6 we suggest a possible cause of the intrinsic differences between the radio bright and radio faint GRBs.
3. The redshift distributions of GRBs
Chandra & Frail (2012) describe a sample of 2995 flux density measurements and upper limits for 304 GRBs between and GHz with the majority at GHz. The observations were taken with the VLA and the Australia Telescope Compact Array (ATCA) and were of GRBs with a burst date between 1997 and 2011. Table 1 of that paper lists: redshift, duration (), the gamma-ray fluence (), X-ray flux scaled to 11h post burst (), and the optical flux scaled to 11h post burst (), for each of the GRBs that were observed. We used the redshifts listed in this table to construct a cumulative distribution function for the radio bright and radio faint GRB samples. The cumulative distribution is shown in Figure 2. A two population K-S test confirms that the two distributions are not significantly different (). Thus for GRBs with a known redshift, the radio bright and radio faint samples have the same distribution of redshifts.
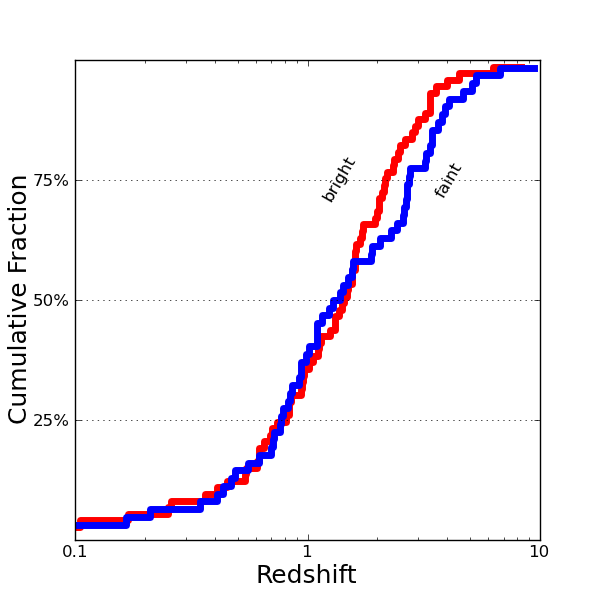
The fraction of radio bright GRBs with a known redshift (72%) is different from that of radio faint GRBs (45%). This difference in knowledge of redshifts could potentially cause biases in the distribution of other observed properties of GRBs. In order to evaluate the significance of any such bias we computed cumulative distribution functions for gamma-ray, X-ray, and optical properties of the GRBs that do and do not have a measured redshift. We again make use of Table 1 of Chandra & Frail (2012) to obtain , , and . For each of these parameters a two population K-S test was carried out between the GRBs with and without known redshifts. These tests were performed on the full GRB sample, and also on the radio bright and radio faint sub-samples. In Figure 3 we show the most and least significant differences between the aforementioned parameter distributions. The resulting p-statistics from the K-S tests correspond to differences with a significance , indicating that the distribution of the aforementioned properties are not being biased by the presence or lack of a measure redshift. Each of the aforementioned parameters (even ) are not available for all GRBs due to selection effects that are beyond the scope of this work.
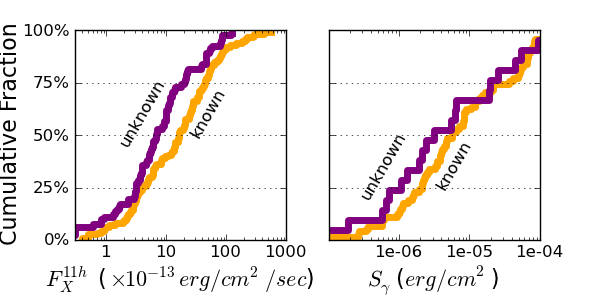
The comparison presented in this section shows that the radio bright and radio faint GRBs have the same redshift distribution. Thus we can rule out redshift as a cause of the observed difference in radio brightness. Similarly, our incomplete knowledge of redshift is not introducing differences in , , or between the two samples.
4. The radio flux distribution of GRBs
In this section we explore the possibility that the distinction between radio bright and radio faint GRB afterglows is an artifact of observational sensitivity. In order to obtain information about the mean flux of the radio bright and radio faint samples, we combine the data from many observations to form stacked observations using visibility stacking (Hancock et al., 2011). In this and subsequent sections we use a subset of the data listed in Chandra & Frail (2012). The selection criteria for this subset are discussed in the next section. Our analysis of the stacking results is done twice; first, by simply appealing to the large difference in flux between the two populations, and second, by comparing the measured fluxes to predictions generated from our model luminosity distributions. The two analyses come to the same conclusion and a time-poor reader may skip section 4.3.
4.1. Visibility stacking
Image based stacking has been used previously in astronomy to investigate the mean properties of a population of objects which cannot be easily detected individually. Traditionally, stacking involves creating a calibrated image of each source under consideration and then forming a weighted sum of these images. Under the assumption of Gaussian noise that is uncorrelated between images and pixels, the stacking of images will result in a factor of improvement in sensitivity. White et al. (2007) used image-based stacking to measure the mean radio flux of SDSS quasars in the FIRST survey. They note that the interferometric nature of radio images and the need for deconvolution produce spatially correlated noise that makes it difficult to reach the ideal sensitivity of the stacked images even when care has been taken to ensure a consistent coverage. In particular, the mean of noisy data does not converge to the true mean, and the relation between the stacked value and the mean of the population depends on the structure of the underlying noise in a non-linear manner. In Hancock et al. (2011) we detailed the method of visibility stacking, in which the calibrated visibility data is combined before imaging takes place. Visibility stacking makes it possible to stack radio observations with different coverages, and thus to avoid problems associated with the structure of the underlying noise.
In order to obtain an homogeneous sample, we selected the GHz observations from Chandra & Frail (2012) from the VLA as they comprise the largest subset of observations. The data were obtained from the VLA archive, flagged and calibrated in aips (Greisen, 2003), with a ParselTongue (Kettenis et al., 2006) script based on that of Bell et al. (2011), and then exported to miriad (Sault et al., 1995) for stacking and imaging.
Observations after 2006 routinely included one or more antennas with expanded VLA (JVLA, Perley et al., 2011) receivers. All baselines including JVLA receivers were flagged and not used in this analysis. Of the 999 observations retrieved from the VLA archive, 226 were excluded due to calibration problems that could not be resolved. The remaining 773 observations were calibrated, imaged, and manually inspected for background sources such as an active nucleus or HII regions within the host galaxy, or other radio sources within the field of view. Excluding the GRB afterglows, all radio sources were modeled and removed from the visibility data, so that they would not contribute flux to the final stacked observation. Observations that included complex sources that were not able to be subtracted accurately were excluded from the analysis. For 36 observations the background emission was not able to be completely subtracted, and these observations were excluded from our analysis.
In total, 737 observations of 178 GRBs were used in this work. The effective total integration time is days, with days of observing time dedicated to GRBs that were detected in at least one epoch, and only days of observing time dedicated to GRBs that were never detected. The difference in observing time between the two samples reflects a typical observing strategy in which a GRB is no longer observed after the first week if no detection has been made, but is otherwise monitored regularly.
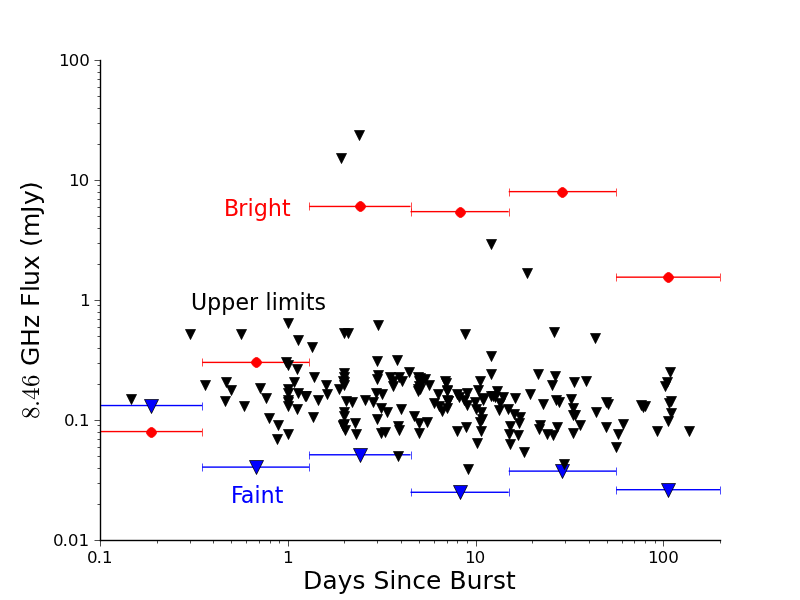
Observations that were suitable for stacking were binned into groups depending on the time elapsed since the burst, and a stacked image was created for each bin. The bin sizes were chosen to be a compromise between: large bins that result in sensitive stacked images, and small bins in which the radio afterglow does not evolve significantly. The time bins were spaced logarithmically between days and days. A GRB is considered to be bright if at least one observation resulted in a detection, and faint no detection was ever made. Separate stacked observations were created for the radio bright and radio faint GRBs. If a GRB is detected in at least one observation, then all observations of this GRB will be included in the radio bright stacked observation, even if a particular observation didn’t result in a detection. Each of the stacked observations was then imaged.
A detection in a visibility stacked image will not resemble the point spread function calculated from the visibility sampling function, even if all the individual sources are unresolved. Instead, the shape of the detection is a sum of the point spread functions of each individual observation, weighted by the flux of each source observed. As the flux of the individual sources is inherently unknown it is not possible to reconstruct the expected “dirty beam” and thus it is not possible to deconvolve the stacked image. We used the BLOBCAT package (Hales et al., 2012) to extract a meaningful flux from the stacked observations in which a detection was made. The sensitivity of each of the stacked observations was measured from the pixel rms in the images. The sensitivity of the stacked images was found to be worse than the theoretical sensitivity expected from a single observation of equivalent integration time. We attribute this non-ideal sensitivity improvement to the presence of faint background sources within individual images, which were not able to be identified or removed, as well as calibration errors (which are difficult to detect in empty images). The stacked observations were more sensitive than any of the individual observations, resulting in upper limits on the mean flux of the population that were times fainter than any of the individual observations.
4.2. Preliminary analysis
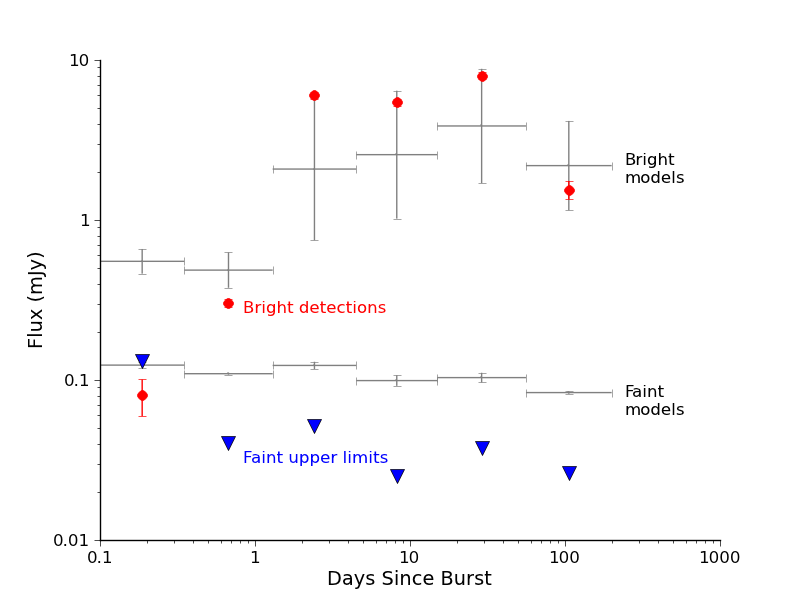
Figure 4 shows the results of the visibility stacking. The stacked observations of the radio bright GRBs resulted, as expected, in strong detections at each epoch that are consistent with the evolution of a canonical GRB afterglow. However, the new result we present here is that the stacked data of radio faint GRBs did not result in any detections. The lack of a detection is inconsistent with the idea that the radio faint GRBs are simply a fainter tail of the radio bright GRB population, subject to limited observing sensitivity. The mean flux of the radio bright and radio faint GRB populations differ by up to three orders of magnitude. Such a large difference in flux suggests that the radio bright and radio faint GRBs are intrinsically different. To confirm that this result is statistically significant, we model the expected flux of the two populations in Section 4.3.
4.3. Population Modeling
The faintest individual GRB detections and the typical upper-limits of non-detected individual GRBs both occur at about the same flux (see Figure 1). This is consistent with the previous interpretation that there is a single population of GRBs and that we are currently only able to detect the brightest 30% due to the limited sensitivity of our telescopes. Our null hypothesis is thus that all GRBs have a radio afterglow that, when taken together, form a single broad distribution in radio flux, and that the difference between the radio bright and faint samples is an artifact of observing sensitivity. In order to test this hypothesis we create GRB afterglow models that are consistent with current observations and use these models to predict the flux of the undetected GRB afterglows. We then test these predictions using more sensitive observations obtained from visibility stacking (see section 4.1).
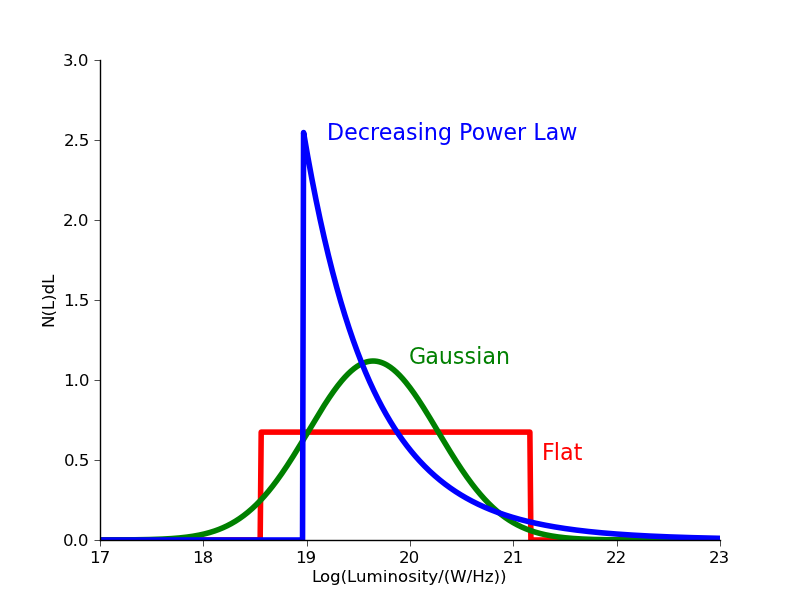
Since the true distribution of GRB radio luminosities is unknown, we will create three single peaked models for this distribution and then look at the range of radio fluxes that these models predict. Following Berger et al. (2003), we describe the number of GRBs with between and using three different, two parameter models as follows:
A distribution that is Gaussian in , with mean and variance :
| (1) |
a flat distribution with luminosities between and :
| (2) |
and a decreasing power-law (DPL) with a lower cutoff of and exponent :
| (3) |
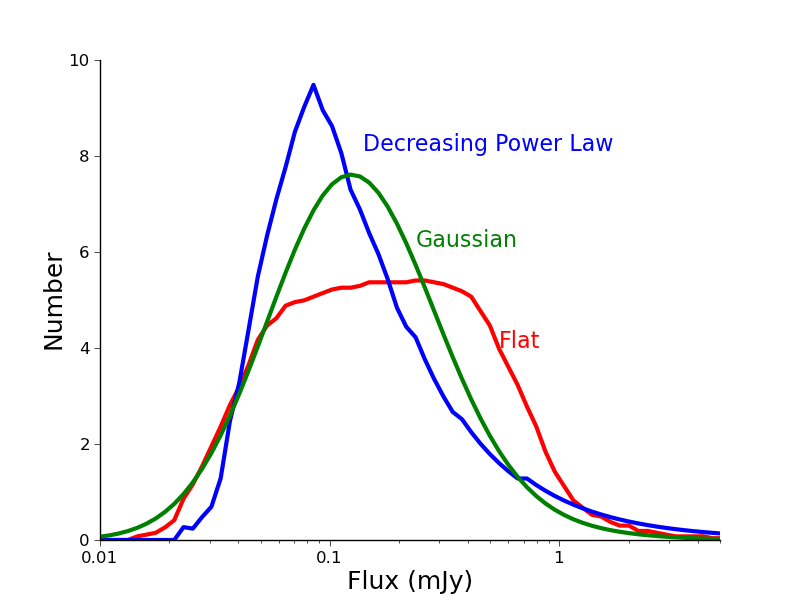
We convert the above luminosity distributions into a distribution of observed fluxes using a model redshift distribution. The distributions of redshifts for GRBs that do or do not have radio detections are the same, and the radio/optical/X-ray/gamma-ray properties of GRBs that do and do not have a measured redshift are no different (see § 3). We therefore take the redshift distribution of the combined (bright and faint) VLA-observed GRB sample as our model distribution. The expected flux distribution can then be calculated by combining the luminosity and redshift distributions such that the number of GRBs with fluxes between and is given by:
| (4) |
where the function measures the expected number of GRBs with fluxes between and , given a distribution of , , and a distribution of redshifts, . We use a cosmology parametrized by km/s/Mpc, , and .
We measure the goodness of fit for a given model by computing the likelihood function :
| (5) |
and
| (6) |
where is a normalized Gaussian centered on the measured flux with a FWHM equal to the measurement uncertainty , and is a normalized step function that is non-zero below, and zero above, the detection limit of the observation. The index iterates over all the observations within the given time bin.
We bin the observations into the same four time bins that were described in section 4.1. By maximizing for each of the luminosity distributions, we obtained the most likely parameters for each of the luminosity models, for each of the time bins. Shown in Table 1 are the parameters for each model, days post burst.
| n() model | Parameter 1 | Parameter 2 |
|---|---|---|
| Gaussian | = 19.6 | = 0.6 |
| Flat | = 18.6 | = 21.2 |
| DPL | = 19.0 | = -28.5 |
4.3.1 Model Predictions
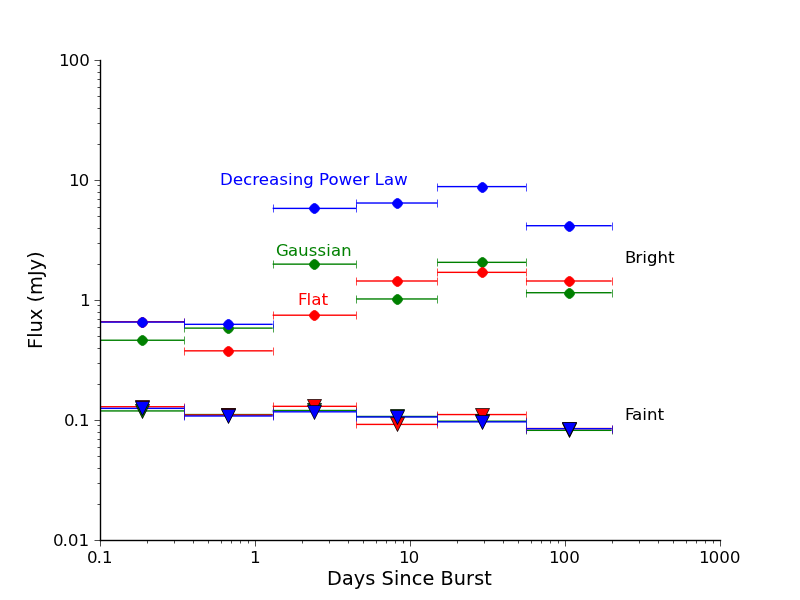
In Figure 5 we show the models for observations (1.3-4.5) days post burst that maximize . By drawing fluxes from the model distribution and randomly assigning an observing sensitivity drawn from the set of radio observations, we are able to divide a model population of GRBs into radio bright (detected) and radio faint (not detected) subsets. When averaged over repeated drawings, these two subsets can then be used to determine the expected detection rate, and the amount of flux we could expect to see in a stacked observation. The three models predict detection rates of between with uncertainties that are consistent with the observed . All the models predict that the radio bright GRBs should have a stacked flux of between and mJy at GHz, depending on the model and time bin, whilst the radio faint GRBs should have a stacked flux in the range . The first time bin ( days) contains only 7 observations, 3 of faint GRBs, and 4 of bright GRBs. Such a small number of observations means that it is difficult to make accurate models or accurate predictions of the expected fluxes. We therefore do not consider the first time bin in our analysis.
Figure 6 shows the predicted fluxes from each of the models for both the bright and faint GRBs. In Figure 7 the range of predicted fluxes are compared with the stacked observations. The radio bright stacked observations result in a mean flux that is consistent with the predicted range. The radio faint stacked observations result in an upper limit that is five times fainter than the predicted range. The fact that none of the flux models are able to account for the radio faint GRBs is inconsistent with the hypothesis that there is a single broad distribution of GRB fluxes that result in a sensitivity limited detection rate.
We have now shown that neither redshift nor observational sensitivity are responsible for the low detection rate of GRB radio afterglows. The division of GRBs into radio faint and radio bright is therefore physical and must be due to intrinsic differences between the two populations.
4.4. Refined analysis
The null hypothesis stated that all GRBs produce a radio bright afterglow which taken together, form a single peaked distribution of fluxes. We have show that this hypothesis is not supported by the data, and therefore that GRBs without a detected afterglow must, at least in part, be truly radio faint. There is of course some amount of contamination in what we call the radio faint sample, which could be overcome with better observing sensitivity. To understand the true fraction of GRBs that are radio bright and faint, we calculate the fraction of radio bright GRBs that are within our radio faint sample. For GRBs observed days post burst, our models predict a mean flux of mJy, whereas the stacked upper limit is mJy. Therefore it is possible for % of the faint GRB sample to have fluxes drawn from the radio bright distribution, and still be consistent with the stacked upper limit. Since % of the GRBs observed in this time bin are in the radio faint population the true (total) fraction of radio bright GRBs is .
The above analysis assumes that observed GRBs are a representative sample, which will be the case during the first week or two after the burst. At later times, GRBs with an established afterglow will be monitored, where as those without an afterglow are likely to be ignored. Table 2 shows the fraction of radio bright and radio faint GRBs observed in each time bin (%observed) as well as the calculated true fraction of radio bright GRBs (%corrected). The late time observing bias can be seen in the increasing fraction of radio bright GRBs observed. However with the exception of the final time bin, the corrected fraction of true radio bright GRBs remains between . We therefore conclude that the true fraction of radio faint GRBs is only .
| days | radio bright GRBs | |
|---|---|---|
| since burst | %observed | %corrected |
| 0.35-1.3 | 41% | 67% |
| 0.3-4.5 | 47% | 73% |
| 4.5-15 | 52% | 60% |
| 15-56 | 65% | 60% |
| 56-200 | 81% | 44% |
5. Multi-wavelength properties of the two GRB populations
We now turn to the multi-wavelength properties of our sample of GRBs to investigate the possible cause of the two populations. The sample of GRBs that we have considered are a subset of the Chandra & Frail (2012) GRBs. Chandra & Frail (2012) found a consistent and significant difference between the multi-wavelength properties of the radio bright and radio faint GRBs. To verify that our selection criteria has produced a representative sample of the complete data, we perform the same analysis on our subset of the data.
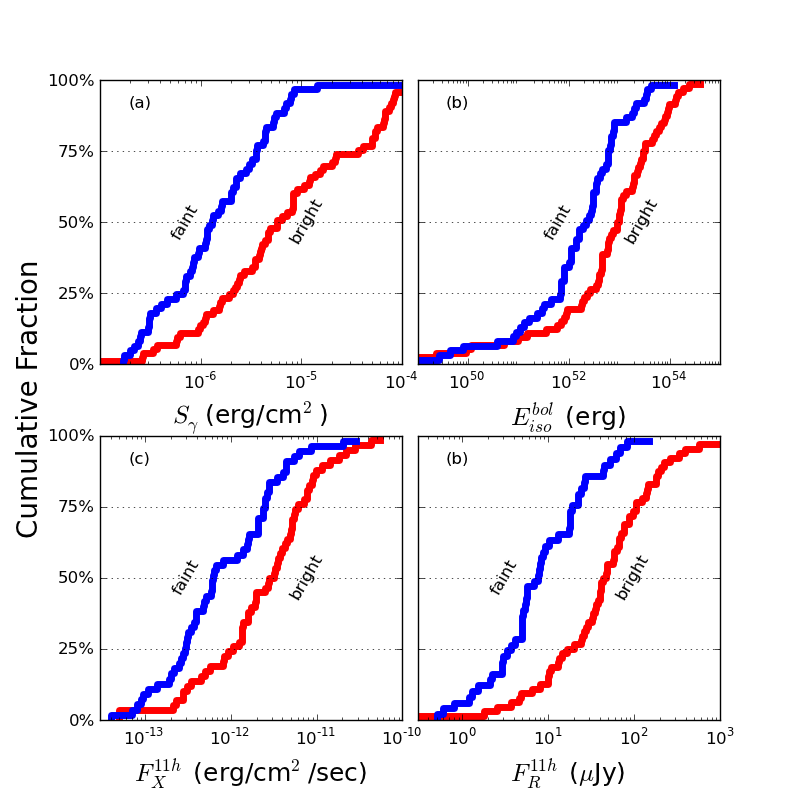
In Figure 8 we show the distribution of four different measures of brightness from optical to gamma-rays. Table 3 presents the median values of these properties as well as the redshift and for the radio bright and radio faint populations. As many as of the GRBs in our radio faint sample may actually be radio bright (see § 4.4) and yet we are still able to detect a significant difference between the radio bright and radio faint samples. The radio faint GRBs are consistently fainter than the radio bright GRBs in each of the measures of brightness at other wavelengths, consistent with the findings of (Chandra & Frail, 2012).
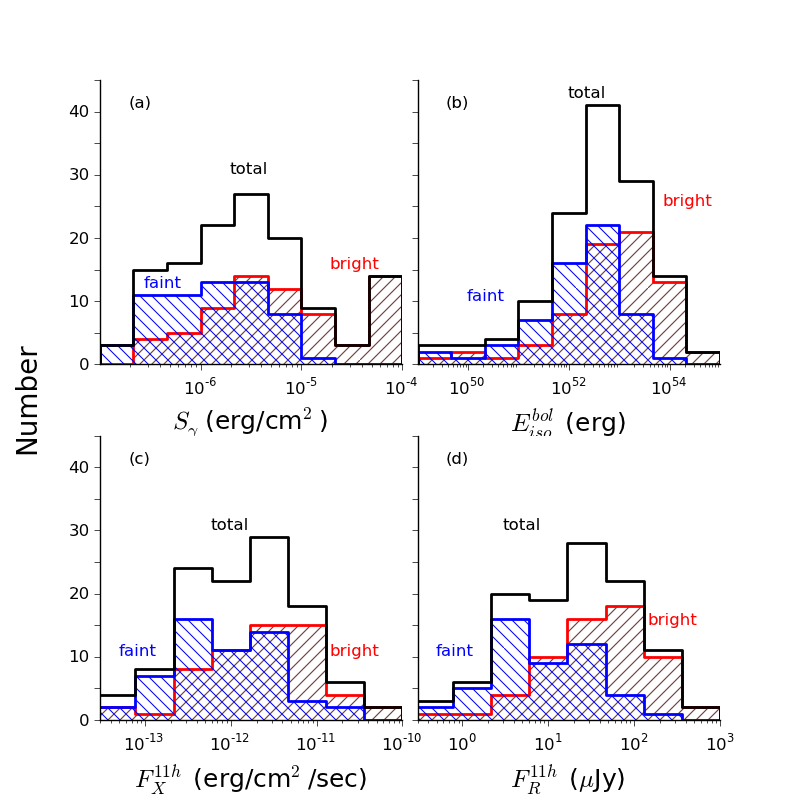
The difference between the two populations is both significant, and consistent. However, at wavelengths shorter than the radio, the difference is only a factor of a few. In Figure 9 we plot a (more traditional) histogram of the data in Figure 8. Due to the small number of known GRBs and the large spread in their brightness, the histograms necessarily have bin sizes that are similar to the difference between the two populations. It is this combination of GRB number, spread in brightness and choice of plotting technique that could otherwise lead one to overlook the difference between the two populations.
| Population | |||
| Parameter (median) | bright | faint | p |
| redshift | 1.4 | 1.3 | 0.32 |
| (s) | 62 | 34 | 8.3e-3 |
| (erg/cm2) | 5.7 | 1.6 | 1.5e-5 |
| (erg/cm2/s) | 23 | 6.4 | 8.9e-5 |
| (Jy) | 41 | 5.8 | 6.0e-11 |
| (erg) | 10 | 2.1 | 4.8e-5 |
6. Interpretation of the two populations
Well studied samples of GRBs (eg, the gold samples of Tsutsui & Shigeyama, 2013; Zhang et al., 2009) have been influential in developing the prompt and afterglow theory of GRBs. However it has been implicitly assumed that all GRBs are radio bright. It is thus not surprising that the standard model of GRB afterglows does not accurately describe the properties of the radio faint population. We have concluded that there must be two populations of GRBs, with different explosion mechanisms, radiation processes, or environments, which are responsible for the different radio fluxes. Our modeling and analysis suggest that of GRBs are truly radio faint and are radio bright. In this section we present two possible explanations for the underlying physical differences between these two populations of GRBs.
6.1. Gamma-ray efficiency
The partitioning of the total energy released by the GRB central engine into prompt emission , and afterglow emission , can be parametrized by (the gamma-ray efficiency) as:
The measured values of are found to vary greatly from as little as 0.03 (Berger et al., 2004), to 0.5 (Granot et al., 2006), and even as high as 0.9 (Nousek et al., 2006). Such a large variation in (and hence the ratio of to ) means that it is not possible to use to predict and thus of the strength of the radio afterglow even for those that are radio bright. The number of GRBs with a measured is large enough to show that there are both large and small values of , however, there are not yet enough measurements to distinguish between a bimodal and quasi-uniform distribution. It is possible that the two populations of radio bright and radio faint GRBs that we have identified in the previous section are representative of GRBs with either low (radio bright), or high (radio faint). The difference in could be due to either differences in the emission mechanism, or the nature of the central engine.
6.1.1 Prompt emission mechanism
The underlying bi-modality of could be a result of different emission mechanisms that are predicted by the different prompt emission models such as the the electromagnetic model (EMM, Lyutikov, 2006), or the fireball model (FBM, Piran, 1999). The EMM with a very low baryon loading can generate intense prompt emission with a large , meaning that the afterglow will be faint or non-existent. The standard FBM involves an intermediate baryon loading that will result in a low and a radio bright afterglow.
6.1.2 Central engine
Even within the FBM, it is possible to obtain two populations with low and high values of which are in turn the root cause of the radio bright and faint GRB afterglow populations, respectively. Komissarov (2012) has shown that the fraction of energy radiated in the prompt phase (effectively ) is inversely proportional to strength of the magnetic field produced by the central engine. Stronger magnetic fields produce less efficient prompt emission and thus . Whilst black holes are the favored candidate for most GRB central engines, millisecond magnetars have been proposed as another possibility (Zhang, 2011). The magnetic field strength of a milli-second magnetar () would be much greater than that at the innermost stable circular obit of a similar mass black hole (, Piotrovich et al., 2010). Thus two populations of GRBs, one magnetar-driven, and one black-hole-driven, could perhaps provide a natural explanation for two populations of and could give rise to the radio bright and radio faint GRB populations, respectively, which we observe.
The claimed observational signature for a magnetar-driven central engine, is the presence of an X-ray plateau that ends with a sharp decay. Ten long GRBs have been identified by Troja et al. (2007), Dall’Osso et al. (2011), and O’Brien et al. (2011) for which this X-ray signature is potentially present. Of these 10 GRBs, only 5 were observed at radio frequencies with two being detected (GRB 061121A, GRB 071021A) and three not being detected. The small number of measurements prevents any definitive conclusions. However, should the observed trend be maintained in further observations, this would argue that magnetar-driven central engines are probably not responsible for radio bright afterglows.
6.2. Observational outcomes
If differences in lead to radio bright and radio faint GRB afterglows, then the radio bright low-luminosity GRBs (llGRBs) are interesting in that they hint at a population of fainter GRBs that are below the detection limits of Swift but which have radio afterglows detectable with our current generation of radio telescopes. Such a population of gamma-ray faint GRBs would bridge the gap between llGRBs and engine driven supernovae (Soderberg et al., 2010). The non-detection of such a population, as yet, is not surprising given the current lack of wide-field, sensitive, transient radio surveys. However, upcoming projects such as the variable and slow transients survey (VAST, Murphy et al., 2013) which make use of large field of view radio observations will be able to detect the afterglow of such a population, and optical transient surveys such as the panoramic survey telescope and rapid response system (Pan-STARRS, Kaiser et al., 2002), the Palomar Transients Factory (PTF, Law et al., 2009), SkyMapper (Keller et al., 2007), or the Antarctic Schmidt Telescopes (Yuan et al., 2010) should be able to detect the prompt optical signature of these objects.
Regardless of the cause of difference between the radio bright and radio faint GRB populations, we predict that future GRB radio observations with an rms of Jy will result in an a detection rate as high as , but not higher. This rms is typical of observations made with the JVLA (eg, Corsi et al., 2013). A preliminary analysis of GRB observations with the JVLA as reported through the GCN circular archive (Barthelmy et al., 2000) reveals a detection rate of for , which is in agreement with this analysis.
7. Conclusions
We have taken a sample of 737 observations of 178 GRBs from the VLA, and found that the difference between the detected (radio bright) and non-detected (radio faint) GRB radio afterglows is not simply a result of observing sensitivity. By stacking the radio observations we find that the radio faint GRBs are not a low luminosity tail of the radio bright population but a second population of GRBs that are intrinsically less luminous at all wavelengths. We suggest that the radio faint population is a result of high gamma-ray efficiency, resulting from different prompt emission mechanisms or different central engines. These possibilities will be explored in future work. Approximately 1 in every 3 GRBs are radio faint, and future theoretical work will need to consider such a population.
Acknowledgments
We thank Davide Burlon, Jochen Greiner, Chryssa Kouveliotou, and Dale Frail for helpful conversations and suggestions, and John Benson for assistance with accessing large amounts of the VLA archive. We also thank the anonymous referee for suggestions that significantly improved this work.
The National Radio Astronomy Observatory is a facility of the National Science Foundation operated under cooperative agreement by Associated Universities, Inc. This research has been supported by the Australian Research Council through Super Science Fellowship grant FS100100033. The Centre for All-sky Astrophysics is an Australian Research Council Centre of Excellence, funded by grant CE110001020.
References
- Barthelmy et al. (2000) Barthelmy, S. D., Cline, T. L., Butterworth, P., Kippen, R. M., Briggs, M. S., Connaughton, V., & Pendleton, G. N. 2000, in American Institute of Physics Conference Series, Vol. 526, Gamma-ray Bursts, 5th Huntsville Symposium, ed. R. M. Kippen, R. S. Mallozzi, & G. J. Fishman, 731–735
- Bell et al. (2011) Bell, M. E., et al. 2011, MNRAS, 415, 2
- Berger et al. (2004) Berger, E., Kulkarni, S. R., & Frail, D. A. 2004, ApJ, 612, 966
- Berger et al. (2003) Berger, E., Kulkarni, S. R., Frail, D. A., & Soderberg, A. M. 2003, ApJ, 599, 408
- Chandra & Frail (2012) Chandra, P., & Frail, D. A. 2012, ApJ, 746, 156
- Corsi et al. (2013) Corsi, A., Perley, D. A., & Cenko, S. B. 2013, GRB Coordinates Network, 14990, 1
- Dall’Osso et al. (2011) Dall’Osso, S., Stratta, G., Guetta, D., Covino, S., De Cesare, G., & Stella, L. 2011, A&A, 526, 121
- Frail (2005) Frail, D. A. 2005, in Springer Proceedings in Physics, Vol. 99, IAU Colloq. 192: Cosmic Explosions, On the 10th Anniversary of SN1993J, ed. J.-M. Marcaide & K. W. Weiler (Berlin: Springer), 451
- Gehrels et al. (2004) Gehrels, N., et al. 2004, ApJ, 611, 1005
- Granot et al. (2006) Granot, J., Königl, A., & Piran, T. 2006, MNRAS, 370, 1946
- Greiner et al. (2011) Greiner, J., et al. 2011, A&A, 526, A30
- Greisen (2003) Greisen, E. W. 2003, in Astrophysics and Space Science Library, Vol. 285, Information Handling in Astronomy - Historical Vistas (France: Kluwer Academic Publishers), 109
- Hales et al. (2012) Hales, C. A., Murphy, T., Curran, J. R., Middelberg, E., Gaensler, B. M., & Norris, R. P. 2012, MNRAS, 425, 979
- Hancock et al. (2011) Hancock, P. J., Gaensler, B. M., & Murphy, T. 2011, ApJ, 735, L35
- Jakobsson et al. (2004) Jakobsson, P., Hjorth, J., Fynbo, J. P. U., Watson, D., Pedersen, K., Björnsson, G., & Gorosabel, J. 2004, ApJ, 617, L21
- Kaiser et al. (2002) Kaiser, N., et al. 2002, in Proceedings of the SPIE, Vol. 4836, Survey and Other Telescope Technologies and Discoveries, ed. J. Tyson & S. Wolff, 154–164
- Keller et al. (2007) Keller, S. C., et al. 2007, PASA, 24, 1
- Kettenis et al. (2006) Kettenis, M., van Langevelde, H. J., Reynolds, C., & Cotton, B. 2006, in ASP Conf. Ser., Vol. 351, ADASS XV, ed. C. Gabriel, C. Arviset, D. Ponz, & S. E (San Francisco: ASP), 497
- Komissarov (2012) Komissarov, S. S. 2012, MNRAS, 422, 326
- Law et al. (2009) Law, N. M., et al. 2009, PASP, 121, 1395
- Lyutikov (2006) Lyutikov, M. 2006, NJPh, 8, 119
- Murphy et al. (2013) Murphy, T., et al. 2013, PASA, 30, 6
- Nousek et al. (2006) Nousek, J. A., et al. 2006, ApJ, 642, 389
- O’Brien et al. (2011) O’Brien, P. T., Lyons, N., & Rowlinson, A. 2011, in AIPC, Vol. 1358, 319–322
- Perley et al. (2011) Perley, R. A., Chandler, C. J., Butler, B. J., & Wrobel, J. M. 2011, ApJ, 739, L1
- Piotrovich et al. (2010) Piotrovich, M. Y., Silant’ev, N. A., Gnedin, Y. N., & Natsvlishvili, T. M. 2010, ArXiv, 1002.4948
- Piran (1999) Piran, T. 1999, PhR, 314, 575
- Sault et al. (1995) Sault, R. J., Teuben, P. J., & Wright, M. C. H. 1995, in ASP Conf. Ser., Vol. 77, ADASS IV, ed. R. Shaw, H. Payne, & J. Hayes, 433
- Soderberg et al. (2010) Soderberg, A. M., et al. 2010, Nature, 463, 513
- Troja et al. (2007) Troja, E., et al. 2007, ApJ, 665, 599
- Tsutsui & Shigeyama (2013) Tsutsui, R., & Shigeyama, T. 2013, ArXiv, 1304.587
- White et al. (2007) White, R. L., Helfand, D. J., Becker, R. H., Glikman, E., & de Vries, W. 2007, ApJ, 654, 99
- Woosley & Bloom (2006) Woosley, S. E., & Bloom, J. S. 2006, ARA&A, 44, 507
- Yuan et al. (2010) Yuan, X., et al. 2010, in Proceedings of the SPIE, Vol. 7733, Ground-based and Airborne Telescopes III, ed. L. Stepp, R. Gilmozzi, & H. Hall, 57
- Zhang (2011) Zhang, B. 2011, CRPh, 12, 206
- Zhang et al. (2009) Zhang, B., et al. 2009, ApJ, 703, 1696