ALMA Detection of the Vibrationally Excited HCN J=4–3 Emission Line in the AGN-Hosting Luminous Infrared Galaxy IRAS 205514250
Abstract
We present results from our ALMA Cycle 0 observations, at the frequencies around the HCN, HCO+, and HNC J=4–3 transition lines, of the luminous infrared galaxy IRAS 205514250 at z=0.043, which is known to host an energetically important obscured AGN. In addition to the targeted HCN, HCO+, and HNC J=4–3 emission lines, two additional strong emission lines are seen, which we attribute to H2S and CH3CNCCH). The HCN-to-HCO+ J=4–3 flux ratio (0.7) is higher than in the other starburst-dominated galaxy (0.2) observed in our ALMA Cycle 0 program. We tentatively (5) detected the vibrationally excited (v2=1) HCN J=4–3 (l=1f) emission line, which is important for testing an infrared radiative pumping scenario for HCN. This is the second detection of this molecular transition in external galaxies. The most likely reason for this detection is not only the high flux of this emission line, but also the small molecular line widths observed in this galaxy, suggesting that vibrational excitation of HCN may be relatively common in AGN-hosting galaxies.
Subject headings:
galaxies: active — galaxies: nuclei — quasars: general — galaxies: Seyfert — galaxies: starburst — submillimeter: galaxies1. Introduction
Luminous infrared galaxies (LIRGs) radiate the bulk of their large luminosities (LL⊙) as infrared dust emission (Sanders & Mirabel, 1996). Their large infrared luminosities indicate that powerful energy sources are present, hidden behind dust, which absorbs most of the primary energetic radiation, and the heated dust grains reemit this energy as infrared thermal radiation. Since LIRGs are the dominant population at 1, in terms of the cosmic infrared radiation density (Caputi et al., 2007; Goto et al., 2010; Magnelli et al., 2011; Murphy et al., 2011), determining whether starbursts (i.e., nuclear fusion inside stars) are dominant, or whether active galactic nuclei (AGNs; active mass accretion onto a central compact supermassive black hole [SMBH] with 106M⊙) are also energetically important as obscured energy sources of LIRGs, is closely related to unveiling the history of star formation and SMBH growth in the dust-obscured galaxy population of the early universe.
Unlike optically identifiable AGNs, in which the central mass-accreting SMBHs are surrounded by a toroidally distributed (torus-shaped) dusty medium, LIRGs, particularly those with LIR 1011.5L⊙ are major mergers of gas-rich galaxies (Sanders & Ishida, 2004; Alonso-Herrero et al., 2009) and have a large amount of concentrated molecular gas and dust in their nuclei (Sanders & Mirabel, 1996). The putative compact AGNs in LIRG nuclei can be easily obscured by gas and dust in virtually all directions. Thus, optical detection of AGN signatures in LIRGs becomes very difficult. However, evaluating the energetic importance of such optically elusive buried AGNs is crucial to understanding the true nature of the LIRG population (Hopkins et al., 2006).
To investigate buried AGNs in dusty LIRG nuclei, we must observe at wavelengths in which dust extinction effects are small. The (sub)millimeter band is one such set of wavelengths, and the flux ratios of (sub)millimeter molecular lines for AGNs have been suggested to be different from the ratios in starburst galaxies (Tacconi et al., 1994; Kohno, 2005; Imanishi et al., 2004, 2006; Imanishi & Nakanishi, 2006; Imanishi et al., 2007; Perez-Beaupuits et al., 2007; Krips et al., 2008; Imanishi et al., 2009; Garcia-Burillo et al., 2010; Imanishi et al., 2010b; Costagliola et al., 2011). For example, an enhancement of the HCN rotational (J) transition line flux, relative to other molecular lines, is argued in AGNs (Kohno, 2005; Imanishi et al., 2004, 2006; Imanishi & Nakanishi, 2006; Imanishi et al., 2007; Krips et al., 2008; Imanishi et al., 2009). If this is confirmed to be a general trend in AGNs, then (sub)millimeter HCN emission lines can be used to identify deeply buried AGNs in dusty LIRG nuclei. Even if strong HCN emission is a feature of AGNs, the interpretation is still not well established. HCN abundance enhancement (Lintott & Viti, 2006; Harada et al., 2010) could be a possible reason for strong HCN emission in AGNs. Infrared radiative pumping of HCN has also been proposed as another possible mechanism for the increasing HCN emission flux (Aalto et al., 1995; Garcia-Burillo et al., 2006; Gracia-Carpio et al., 2006; Weiss et al., 2007). Namely, an AGN, powered by a mass-accreting SMBH, has much higher radiative energy generation efficiency than the nuclear fusion reaction inside stars, can heat the surrounding dust to high temperatures of several hundred Kelvin, and can emit a much stronger mid-infrared 3–20 m continuum (relative to the bolometric luminosity) than a starburst. By absorbing the infrared 14 m photons, HCN molecules can be vibrationally excited to the v2=1 level. Through subsequent decay to the vibrational ground level (v=0), the HCN rotational (J) transition lines at v=0 will be strong compared to collisional excitation alone (Rangwala et al., 2011). To determine whether this infrared radiative pumping scenario is generally and efficiently at work in AGNs, the detection of vibrationally excited HCN J-transition lines in AGN-hosting galaxies is of particular importance, because the lines are expected to be strong in infrared radiative pumping, but not in collisional excitation.
To investigate whether HCN emission is indeed enhanced (relative to other molecular lines) in AGNs compared to starbursts, and to test whether vibrationally excited HCN emission lines are generally present in AGNs, we observed the HCN, HCO+, and HNC J=4–3 lines of nearby (z0.35) luminous infrared galaxies, with and without luminous AGN signatures, in ALMA Cycle 0. Among six observed sources, the vibrationally excited HCN v2=1 J=4–3 (l=1f) emission line is tentatively detected in the luminous infrared galaxy IRAS 205514250 at z=0.043, which is diagnosed to contain a luminous buried AGN (Table 1). This is the second detection of this important line in extragalactic sources. We report this result in this paper. Throughout this paper, we adopt H0 71 km s-1 Mpc-1, = 0.27, and = 0.73 (Komatsu et al., 2009),
2. Observations and Data Analysis
Our ALMA Cycle 0 observations were performed within the program 2011.0.00020.S (PI = M. Imanishi). Table 2 provides the details of our observations. The widest 1.875 GHz band mode and 3840 total channel number were adopted.
At the redshift of IRAS 205514250 (z=0.043), HCN J=4–3 (rest-frame frequency is = 354.505 GHz) and HCO+ J=4–3 ( = 356.734 GHz) lines can be simultaneously observed in ALMA band 7. We employed four spectral windows, of which two were used to cover HCN J=4–3 (central frequency was set as = 339.890 GHz) and HCO+ J=4–3 lines ( = 341.835 GHz), and the remaining two were used to measure the continuum flux level ( = 351.883 GHz and 353.589 GHz).
To observe the HNC J=4–3 line ( = 362.630 GHz), we needed additional independent observations. We covered the HNC J=4–3 line in one spectral window ( =347.680 GHz) and used one more spectral window ( = 335.570 GHz) to probe the continuum flux level.
We started data analysis from calibrated data provided by the Joint ALMA Observatory. We first checked the visibility plots to locate the targeted emission lines. The presence of HCN, HCO+, and HNC J=4–3 lines was clearly recognizable in the visibility plots of individual spectral windows. In other spectral windows in which we intended to measure the continuum emission, signatures of emission lines were seen. We selected channels that were free of these emission lines to estimate the continuum flux level. We then subtracted this continuum level and performed the task “clean” for molecular line data. The “clean” procedure was also applied to the continuum data. We employed 40 channel spectral binning (17 km s-1) and 0.1′′ pixel-1 spatial binning in this clean procedure.
3. Results
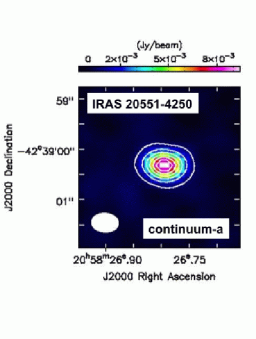
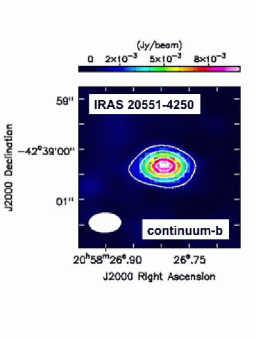
Figure 1 displays the continuum-a (taken with the HCN and HCO+ J=4–3 observations) and continuum-b (taken with HNC J=4–3) maps. The continuum emission properties are presented in Table 3. The contribution from thermal free-free emission in star-forming HII-regions to the observed continuum flux (10 mJy) at 345 GHz is estimated to be only 3 mJy, from the far-infrared (40–500 m) luminosity (Table 1), by using the equation (1) of Nakanishi et al. (2005) and even assuming that the far-infrared luminosity is dominated by starburst activity, with no AGN contribution. Thus, we interpret that the detected continuum emission (10 mJy) at 345 GHz largely comes from dust emission heated by dust-obscured energy sources (AGN and/or starburst), with a small contribution from thermal free-free emission.
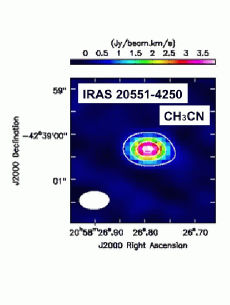
A full spectrum taken with our ALMA observations at the continuum peak position within the beam size is shown in Figure 2. Although we targeted HCN, HCO+, and HNC J=4–3 emission lines, we clearly detected other emission lines that show peaks at the observed frequencies of = 353.88–353.90 GHz and 334.96–335.00 GHz based on Gaussian fits. Adopting a redshift of z=0.043, their observed frequencies correspond to rest-frame frequencies of = 369.09–369.12 GHz and 349.36–349.41 GHz, which we attribute to H2S 3(2,1)–3(1,2) ( = 369.101 GHz) and CH3CN v=0 19(3)–18(3) ( = 349.393 GHz) with a possible contribution from CCH v=0 N=4–3 J=7/2–5/2 ( = 349.400 GHz), respectively (http://www.splatalogue.net), as seen in Galactic molecular clouds (Sutton et al., 2001; Schilke et al., 1997). To our knowledge, ours is the first detection of these lines in extragalactic sources. H2S, CH3CN and CCH emission lines, albeit at different rotational (J) transitions, were detected in the very nearby (20 Mpc), bright starburst galaxies and AGNs (Martin et al., 2006; Aladro et al., 2011, 2013). The serendipitous detection of these emission lines in IRAS 205514250 at z=0.043 (190 Mpc) demonstrates the high sensitivity of ALMA.
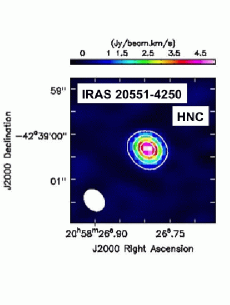
Integrated intensity (moment 0) maps of individual molecular lines are created, by combining channels with clearly discernible signals. These maps are displayed in Figure 3 (left), and their properties are summarized in Table 4. The molecular line peak positions agree with the continuum emission peak within 1 pixel (0.1”). Spectra around individual detected molecular lines at the continuum peak position within the beam size are shown in Figure 3 (right). Since continuum emission is well subtracted in the spectra, the moment 0 maps in Figure 3 (left) should reflect the properties of individual molecular gas emission lines. The results of the Gaussian fits for individual molecular lines are summarized in Table 4.
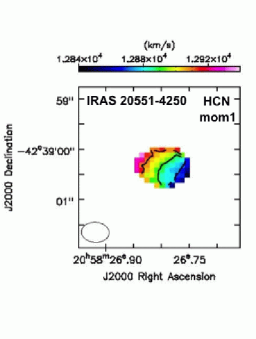
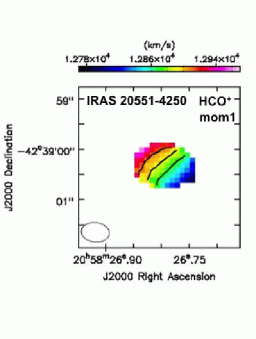
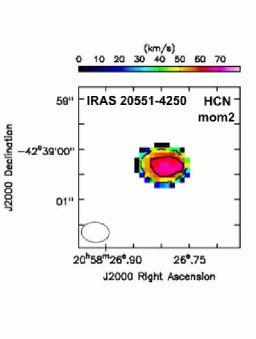
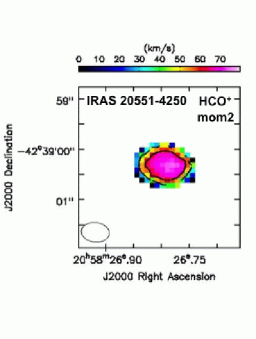
Figure 4 shows the intensity-weighted mean velocity (moment 1) and intensity-weighted velocity dispersion (moment 2) maps for HCN and HCO+ J=4–3 lines. A rotating gas motion is seen such that gas in the northeastern (southwestern) region is redshifted (blueshifted), relative to the nucleus, suggesting that the molecular gas emission is slightly spatially extended compared to the synthesized beam.
4. Discussion
4.1. Vibrationally excited HCN J=4–3 emission line
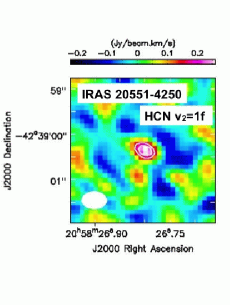
In the spectrum of HCO+ J=4–3 in Figure 3, a weak emission feature is seen at the higher velocity (lower frequency) side of HCO+. A magnified view of the spectrum around HCO+ J=4–3 is shown in the right panel of Figure 2. The observed frequency of this weak emission peak is 341.51–341.58 GHz (based on Gaussian fit), which corresponds to = 356.20–356.27 GHz at z=0.043. We attribute this weak line to the vibrationally excited HCN v2=1 J=4–3 (l=1f) emission line ( = 356.256 GHz). Since the flux excess, with a peak of 4.8 mJy, is seen in several consecutive spectral elements (not one element), it is very unlikely that the excess feature is caused by a spike noise. We have carefully investigated the spectrum in Figure 2, and found that no spectral elements, other than the identified molecular lines, show fluxes exceeding 4 mJy (1 noise level is 1.2 mJy). Since the observed peak frequency of this emission feature coincides with the expected frequency of HCN v2=1 J=4–3 (l=1f) and the observed peak position agrees with the continuum and other detected stronger molecular line peak positions, we judge that the HCN v2=1 J=4–3 (l=1f) emission feature is real.
This vibrationally excited HCN v2=1 J=4–3 (l=1f) emission line was recently detected in the external galaxy NGC 4418 (Sakamoto et al., 2010). NGC 4418 is a very nearby luminous infrared galaxy (LIR 1011L⊙) at z=0.007, and a luminous buried AGN-type energy source with high emission surface brightness was found (Spoon et al., 2001; Evans et al., 2003; Imanishi et al., 2004; Sakamoto et al., 2013). However, based on only one example, determining whether the vibrational excitation of HCN in NGC 4418 was an exceptional case or not was impossible. From our discovery of this second extragalactic source, we can now show that HCN vibrational excitation is not exceptionally rare. Since the HCN v2=1 J=4–3 (l=1f) line is only 400 km s-1 away from the much brighter HCO+ J=4–3 emission line at v=0 (Figure 3, right), small HCO+ J=4–3 line width is very effective to recognize the presence of HCN v2=1 J=4–3 (l =1f) emission line, by clearly de-blending these emission lines. In fact, IRAS 205514250 has the smallest molecular line widths among six LIRGs observed in our ALMA Cycle 0 program. We infer that the vibrational excitation of HCN may be common in AGN-hosting galaxies, even though the detection of the HCN v2=1 J=4–3 (l=1f) line in galaxies with larger molecular line widths may be hampered by veiling from the overwhelmingly brighter HCO+ J=4–3 emission line at v=0.
We estimate the flux of the HCN v2=1 J=4–3 (l=1f) emission line to be 0.390.07 [Jy km s-1] based on a Gaussian fit (Table 4). The HCN J=4–3 v2=1 (l=1f) to v=0 flux ratio is 0.04, which is a factor of 5 smaller than the ratio observed in NGC 4418 (Sakamoto et al., 2010).
In NGC 4418, the infrared 14 m HCN absorption feature was detected (Lahuis et al., 2007). Sakamoto et al. (2010) estimated that the energy of the HCN v2=1 J=4–3 (l=1f) emission line was smaller than that of the 14 m absorption line and concluded that the observational results could be explained by the infrared radiative pumping mechanism. Unfortunately, no meaningful constraint on the HCN 14 m absorption feature is placed for IRAS 205514250 (Lahuis et al., 2007), so that further discussion is not possible. However, as discussed by Sakamoto et al. (2010), the energy level of HCN v2=1 (l=1f) level is E/k 1000 K, which is very difficult to excite with collisions. Infrared radiative pumping by absorbing infrared 14 m photons is the plausible scenario for the vibrational excitation of HCN. This mechanism should work effectively in an AGN because infrared 14 m continuum is radiated strongly due to AGN-heated hot dust emission. Thus, detection of the vibrationally excited HCN J=4–3 emission line is expected more often in an AGN than in a starburst galaxy. In fact, IRAS 205514250 shows signatures of a luminous obscured AGN, including the strong power-law 2–10 keV X-ray emission (Franceschini et al., 2003), the AGN-type infrared 2.5–8 m spectral shape (Risaliti et al., 2006; Sani et al., 2008; Imanishi et al., 2010a; Nardini et al., 2010), and a higher emission surface brightness (1013 L⊙ kpc-2) than would be sustained by star-formation activity (Imanishi et al., 2011).
To proceed with further quantitative discussion, it is desirable to observe the vibrationally excited v2=1 (l=1f) line at the J=3–2 and J=2–1 HCN transitions. Also, HCO+ and HNC have vibrationally excited v2=1 J=4–3 (l=1f) lines at = 358.242 GHz and 365.147 GHz, respectively, but these lines are outside the frequency range covered with our ALMA Cycle 0 observations. Measurements of the v2=1 J=4–3 (l=1f) lines of HCO+ and HNC as well as at J=3–2 and J=2–1 are useful to comprehensively understand how infrared radiative pumping excites molecules to the vibrationally excited level and alters the strengths of the rotational (J) transition lines at v=0 in individual molecules.
4.2. Line Flux Ratio
Figure 5 is the plot of the HCN-to-HCO+ J=4–3 and HCN-to-HNC J=4–3 flux ratios in IRAS 205514250. The ratios at four different positions in the starburst galaxy NGC 1614, taken with our ALMA Cycle 0 observations (Imanishi & Nakanishi, 2013), are overplotted for comparison. IRAS 205514250 shows a higher HCN-to-HCO+ J=4–3 flux ratio than the starburst galaxy NGC 1614.
Based on observations, HCN-to-HCO+ flux ratios have been suggested to be small (1) in starburst-dominated galaxies, but high (1) in AGNs at J=1–0 (Kohno, 2005; Imanishi et al., 2004, 2006; Imanishi & Nakanishi, 2006; Imanishi et al., 2007; Krips et al., 2008; Imanishi et al., 2009). At J=4–3, the HCN-to-HCO+ flux ratio in IRAS 205514250 is higher than the starburst galaxy NGC 1614, but the absolute value is less than unity. Since the critical density of HCN J=4–3 (ncrit 2 107 cm-3) is higher than that of HCO+ J=4–3 (ncrit 4 106 cm-3) (Meijerink et al., 2007), HCO+ J=4–3 is more easily excited than HCN J=4–3, which could reduce the HCN-to-HCO+ flux ratio at J=4–3 compared to lower J transitions. HCN-to-HCO+ flux ratios higher than unity at J=4–3 or even higher transition are found in a high-redshift AGN-dominated source, APM 082795255 (Garcia-Burillo et al., 2006; Weiss et al., 2007), and two nearby LIRGs observed with our ALMA Cycle 0 program (Imanishi et al. 2013, in preparation). In IRAS 205514250, it may be that (1) HCO+ is more collisionally-excited to J=4–3 than HCN, and (2) the effects of infrared radiative pumping in HCN are relatively modest, as indicated from the lower HCN v2=1 (l=1f) to v=0 flux ratio than NGC 4418. To determine the physical origin of the observed flux ratio and excitation condition, we need to obtain data at lower J transition lines.
References
- Alonso-Herrero et al. (2009) Alonso-Herrero, A., Garcia-Marin, M., Monreal-Ibero, A., Colina, L., Arribas, S., Alfonso-Garzon, J., & Labiano, A. 2009, A&A, 506, 1541
- Aalto et al. (1995) Aalto, S., Booth, R. S., Black, J. H., & Johansson, L. E. B. 1995, A&A, 300, 369
- Aladro et al. (2011) Aladro, R., Martin, S., Martin-Pintado, J., Mauersberger, R., Henkel, C., Ocana Flaquer, B., Amo-Baladron, M. A. 2011, A&A, 535, 84
- Aladro et al. (2013) Aladro, R., et al. 2013, A&A, 549, 39
- Caputi et al. (2007) Caputi, K. I., et al. 2007, ApJ, 660, 97
- Costagliola et al. (2011) Costagliola, F., et al. 2011, A&A, 528, 30
- Duc et al. (1997) Duc, P. -A., Mirabel, I. F., & Maza, J. 1997, A&AS, 124, 533
- Evans et al. (2003) Evans, A. S. et al. 2003, AJ, 125, 2341
- Franceschini et al. (2003) Franceschini, A. et al. 2003, MNRAS, 343, 1181
- Garcia-Burillo et al. (2006) Garcia-Burillo, S., et al. 2006, ApJ, 645, L17
- Garcia-Burillo et al. (2010) Garcia-Burillo, S., et al. 2010, A&A, 519, 2
- Goto et al. (2010) Goto, T., et al. 2010, A&A, 514, 6
- Gracia-Carpio et al. (2006) Gracia-Carpio, J., Garcia-Burillo, S., Planesas, P., & Colina, L. 2006, ApJ, 640, L135
- Harada et al. (2010) Harada, N., Herbst, E., & Wakelam, V. 2010, ApJ, 721, 1570
- Hopkins et al. (2006) Hopkins, P. F., Hernquist, L., Cox, T. J., Di Matteo, T., Robertson, B., & Springel, V. 2006, ApJS, 163, 1
- Imanishi et al. (2011) Imanishi, M., Imase, K., Oi, N., & Ichikawa, K. 2011, AJ, 141, 156
- Imanishi et al. (2010a) Imanishi, M., Nakagawa, T., Shirahata, M., Ohyama, Y., & Onaka, T. 2010a, ApJ, 721, 1233
- Imanishi & Nakanishi (2006) Imanishi, M., & Nakanishi, K. 2006, PASJ, 58, 813
- Imanishi & Nakanishi (2013) Imanishi, M., & Nakanishi, K. 2013, AJ, 146, 47
- Imanishi et al. (2004) Imanishi, M., Nakanishi, K., Kuno, N., & Kohno, K. 2004, AJ, 128, 2037
- Imanishi et al. (2006) Imanishi, M., Nakanishi, K., & Kohno, K. 2006, AJ, 131, 2888
- Imanishi et al. (2007) Imanishi, M., Nakanishi, K., Tamura, Y., Oi, N., & Kohno, K. 2007, AJ, 134, 2366
- Imanishi et al. (2009) Imanishi, M., Nakanishi, K., Tamura, Y., & Peng, C. -H. 2009, AJ, 137, 3581
- Imanishi et al. (2010b) Imanishi, M., Nakanishi, K., Yamada, M., Tamura, Y., & Kohno, K. 2010b, PASJ, 62, 201
- Kohno (2005) Kohno, K. 2005, in AIP Conf. Ser. 783, The Evolution of Starbursts, ed. S. Hüttemeister, E. Manthey, D. Bomans, & K. Weis (New York: AIP), 203 (astro-ph/0508420)
- Komatsu et al. (2009) Komatsu, E., et al. 2009, ApJS, 180, 330
- Krips et al. (2008) Krips, M., Neri, R., Garcia-Burillo, S., Martin, S., Combes, F., Gracia-Carpio, J., & Eckart, A. 2008, ApJ, 677, 262
- Lahuis et al. (2007) Lahuis, F. et al. 2007, ApJ, 659, 296
- Lintott & Viti (2006) Lintott, C., & Viti, S. 2006, ApJ, 646, L37
- Magnelli et al. (2011) Magnelli, B., Elbaz, D., Chary, R. R., Dickinson, M., Le Borgne, D., Frayer, D. T., & Willmer, C. N. A. 2011, A&A, 528, 35
- Martin et al. (2006) Martin, S., Mauersberger, R., Martin-Pintado, J., Henkel, C., Garcia-Burillo, S. 2006, ApJS, 164, 450
- Meijerink et al. (2007) Meijerink, R., Spaans, M., & Israel, F. P. 2007, A&A, 461, 793
- Murphy et al. (2011) Murphy, E. J., Chary, R. -R., Dickinson, M., Pope, A., Frayer, D. T., & Lin, L. 2011, ApJ, 732, 126
- Nakanishi et al. (2005) Nakanishi, K., Okumura, S. K., Kohno, K., Kawabe, R., & Nakagawa, T. 2005, PASJ, 57, 575
- Nardini et al. (2010) Nardini, E., Risaliti, G., Watabe, Y., Salvati, M., & Sani, E. 2010, MNRAS, 405, 2505
- Perez-Beaupuits et al. (2007) Perez-Beaupuits, J. P., Aalto, S., & Gerebro, H. 2007, A&A, 476, 177
- Rangwala et al. (2011) Rangwala, N., et al. 2011, ApJ, 743, 94
- Risaliti et al. (2006) Risaliti, G., et al. 2006, MNRAS, 365, 303
- Sakamoto et al. (2010) Sakamoto, K., Aalto, S., Evans, A. S., Wiedner, M., & Wilner, D. 2010, ApJ, 725, L228
- Sakamoto et al. (2013) Sakamoto, K., Aalto, S., Costagliola, F., Martin, S., Ohyama, Y., Wiedner, M. C., & Wilner, D. J. 2013, ApJ, 764, 42
- Sanders & Ishida (2004) Sanders, D. B., & Ishida, C. M. 2004, ASPC, 320, 230
- Sanders & Mirabel (1996) Sanders, D. B., & Mirabel, I. F. 1996, ARA&A, 34, 749
- Sani et al. (2008) Sani, E., et al. 2008, ApJ, 675, 96
- Schilke et al. (1997) Schilke, P., Groesbeck, T. D., Blake, G. A., & Phillips, T. G. 1997, ApJS, 108, 301
- Spoon et al. (2001) Spoon, H. W. W., Keane, J. V., Tielens, A. G. G. M., Lutz, D., & Moorwood, A. F. M. 2001, A&A, 365, L353
- Sutton et al. (2001) Sutton, E. C., Jaminet, P. A., Danchi, W. C., & Blake, G. A. 1991, ApJS, 77, 255
- Tacconi et al. (1994) Tacconi, L. J., Genzel, R., Blietz, M., Cameron, M., Harris, A. I., & Madden, S. 1994, ApJ, 426, L77
- Weiss et al. (2007) Weiss, A., et al. 2007, A&A, 467, 955
| Object | Redshift | f12 | f25 | f60 | f100 | log LIR | log LFIR | Optical | Energy |
|---|---|---|---|---|---|---|---|---|---|
| [Jy] | [Jy] | [Jy] | [Jy] | [L⊙] | [L⊙] | Class | Source | ||
| (1) | (2) | (3) | (4) | (5) | (6) | (7) | (8) | (9) | (10) |
| IRAS 205514250 | 0.043 | 0.28 | 1.91 | 12.78 | 9.95 | 12.0 | 11.9 | LI (HII) | AGN + starburst |
Note. — Col.(1): Object name. Col.(2): Redshift. Col.(3)–(6): f12, f25, f60, and f100 are IRAS fluxes at 12 m, 25 m, 60 m, and 100 m, respectively, taken from the IRAS FSC catalog. Col.(7): Decimal logarithm of infrared (81000 m) luminosity in units of solar luminosity (L⊙), calculated with D(Mpc)2 (13.48 + 5.16 + ) [ergs s-1] (Sanders & Mirabel, 1996). Col.(8): Decimal logarithm of far-infrared (40500 m) luminosity in units of solar luminosity (L⊙), calculated with D(Mpc)2 () [ergs s-1] (Sanders & Mirabel, 1996). Col.(9): Optical spectral classification. This galaxy is classified as a LINER (HII-region); namely, it has no obvious optical AGN (Seyfert) signature (Duc et al., 1997). Col.(10): Energy source. A luminous buried AGN is detected, in addition to starburst activity (Franceschini et al., 2003; Risaliti et al., 2006; Sani et al., 2008; Nardini et al., 2010; Imanishi et al., 2010a, 2011).
| Line | Date | Antenna | Calibrator | ||
|---|---|---|---|---|---|
| (UT) | Number | Bandpass | Flux | Phase | |
| (1) | (2) | (3) | (4) | (5) | (6) |
| HCN/HCO+ J=4–3 | 2012 June 1 | 18 | 3C454.3 | Neptune | J2056472 |
| 2012 July 26 | 17 | 3C454.3 | Neptune | J2056472 | |
| HNC J=4–3 | 2012 June 2 | 19 | 3C454.3 | Neptune | J2056472 |
| 2012 July 26 | 18 | 3C454.3 | Neptune | J2056472 | |
Note. — Col.(1): Observed line. Col.(2): Observation date (UT). Col.(3): Number of antennas used for observations. Cols.(4), (5), and (6): Bandpass, flux, and phase calibrator for the target source, respectively.
| Continuum | Frequency | Flux | Peak Coordinate | rms | Synthesized beam |
|---|---|---|---|---|---|
| [GHz] | [mJy beam-1] | (RA,DEC) | [mJy beam-1] | [arcsec arcsec] (∘) | |
| (1) | (2) | (3) | (4) | (5) | (6) |
| a | 346.7 | 9.4 (67) | (20 58 26.79, 42 39 00.3) | 0.14 | 0.6 0.4 (90∘) |
| b | 341.6 | 10.1 (52) | (20 58 26.80, 42 39 00.3) | 0.19 | 0.8 0.4 (91∘) |
Note. — Col.(1): Continuum-a or -b. Continuum-a data were taken simultaneously with HCN and HCO+ J=4–3 observations, and continuum-b data were obtained at the same time as HNC J=4–3 observations. Col.(2): Central frequency in [GHz]. Col.(3): Flux in [mJy beam-1] at the emission peak. The detection significance relative to the rms noise is shown in parentheses. Col.(4): The coordinate of the continuum emission peak in J2000. Col.(5): The rms noise level (1) in [mJy beam-1]. Col.(6): Synthesized beam in [arcsec arcsec] and position angle. The position angle is 0∘ along the north–south direction and increases in the counterclockwise direction.
| Line | Integrated intensity (moment 0) map | Gaussian line fit | |||||
|---|---|---|---|---|---|---|---|
| Peak | rms | Beam | Velocity | Peak | FWHM | Flux | |
| [Jy beam-1 km s-1] | [Jy beam-1 km s-1] | [ ] (∘) | [km s-1] | [mJy] | [km s-1] | [Jy km s-1] | |
| (1) | (2) | (3) | (4) | (5) | (6) | (7) | (8) |
| HCN J=4–3 | 8.1 (77) | 0.10 | 0.6 0.4 (90∘) | 128941 | 501 | 1803 | 9.50.2 |
| HCO+ J=4–3 | 12 (85) | 0.14 | 0.6 0.4 (90∘) | 128861 | 701 | 1903 | 141 |
| H2S 3(2,1)–3(1,2) | 2.4 (28) | 0.086 | 0.5 0.4 (89∘) | 128934 | 181 | 1708 | 3.30.2 |
| HNC J=4–3 | 5.1 (47) | 0.11 | 0.5 0.4 (39∘) | 128902 | 341 | 1604 | 5.80.2 |
| CH3CN 19(3)–18(3) aaCCH N=4–3 J=7/25/2 line may also contribute. | 4.0 (39) | 0.10 | 0.7 0.4 (92∘) | 129243 | 251 | 1706 | 4.40.2 |
| HCN v2=1f J=4–3 | 0.26(5.0) | 0.052 | 0.6 0.4 (90∘) | 1291811 | 3.50.6 | 100(best fit; fix) | 0.390.07 |
Note. — Col.(1): Observed molecular line. HCN, HCO+, and H2S lines were observed simultaneously with continuum-a. HNC and CH3CN (+CCH) lines were taken at the same time as continuum-b. Col.(2): Integrated intensity in [Jy beam-1 km s-1] at the emission peak. The detection significance relative to the rms noise of the moment 0 maps is given in parentheses. Col.(3): The rms noise level (1) in the moment 0 map in [Jy beam-1 km s-1]. It varies among different lines, depending on the number of channels combined. Col.(4): Synthesized beam in [arcsec arcsec] and position angle. The position angle is 0∘ along the north–south direction and increases in the counterclockwise direction. Cols.(5)–(8): Gaussian fits of detected emission lines in the spectra at the continuum peak position, within the beam size. Col.(5): Central velocity in [km s-1]. Col.(6): Peak flux in [mJy]. Col.(7): Full width at half maximum (FWHM) in [km s-1]. Col.(8): Flux in [Jy km s-1].


![[Uncaptioned image]](/html/1308.4414/assets/x5.png)
![[Uncaptioned image]](/html/1308.4414/assets/x6.png)
![[Uncaptioned image]](/html/1308.4414/assets/x7.png)
![[Uncaptioned image]](/html/1308.4414/assets/x8.png)
![[Uncaptioned image]](/html/1308.4414/assets/x9.png)
![[Uncaptioned image]](/html/1308.4414/assets/x10.png)