Far-infrared spectroscopy of a lensed starburst: a blind redshift from Herschel
Abstract
We report the redshift of HATLAS J132427.0+284452 (hereafter HATLAS J132427), a gravitationally lensed starburst galaxy, the first determined ‘blind’ by the Herschel Space Observatory. This is achieved via the detection of [C ii] consistent with in a far-infrared spectrum taken with the SPIRE Fourier Transform Spectrometer. We demonstrate that the [C ii] redshift is secure via detections of CO and using the Combined Array for Research in Millimeter-wave Astronomy and the Institut de Radioastronomie Millimétrique’s Plateau de Bure Interferometer. The intrinsic properties appear typical of high-redshift starbursts despite the high lensing-amplified fluxes, proving the ability of the FTS to probe this population with the aid of lensing. The blind detection of [C ii] demonstrates the potential of the SAFARI imaging spectrometer, proposed for the much more sensitive SPICA mission, to determine redshifts of multiple dusty galaxies simultaneously without the benefit of lensing.
keywords:
galaxies: high-redshift — galaxies: active — galaxies: starburst — submillimetre: galaxies — infrared: galaxies — radio continuum: galaxies — radio lines: galaxies1 Introduction
Through surveys using the Submillimetre Common-User Bolometer Array (SCUBA – Holland et al., 1999) came the discovery of a population of dust-obscured, submillimetre- (submm-)bright galaxies (Blain et al., 2002). Analogous to ultraluminous infrared galaxies (ULIRGs) in the local neighbourhood, these distant, gas-rich, intensely star-forming galaxies emit the bulk of their radiation in the rest-frame far-infrared (far-IR) waveband.
Surveys with the latest generation of far-IR- and submm-wavelength facilities, in particular the 3.5 m Herschel Space Observatory, have enabled us to image many more of these dusty star-forming galaxies (DSFGs) than was previously possible, over vastly larger areas, in up to five filters simultaneously, allowing us to probe rare populations that were not well-sampled in previous far-IR surveys.
The discovery of a bright, lensed population of DSFGs, intrinsically below the Herschel detection limit (e.g. Negrello et al., 2010), has confirmed that far-IR imaging is an efficient method by which to select strongly lensed objects and due to the sometimes high magnification (e.g. ; Swinbank et al., 2011), has permitted detailed studies of individual galaxies (e.g. Cox et al., 2011; Ivison et al., 2013).
High-resolution studies of individual DSFGs typically rely upon interferometric CO-line observations, necessitating precise knowledge of their redshifts. These remain notoriously difficult to obtain, due to the difficulty in pinpointing their positions, and their faintness in the optical. However, the lensed DSFG population has proved to be within reach of a range of new ground-based, broadband spectroscopic instrumentation (e.g. Harris et al., 2012); very recently, Weiß et al. (2013) have demonstrated the power of ALMA, particularly at where the 3-mm atmospheric window always contains a line.
Here, we present the first blind determination of a redshift using far-IR spectroscopic observations from space – a key step towards demonstrating the feasibility of integral-field far-IR spectroscopy as planned for the joint JAXA-ESA mission, SPICA (e.g. Swinyard et al., 2009). Throughout the paper we use WMAP7 cosmology (Komatsu et al., 2011) with , and .
2 Discovery observations
The North Galactic Pole (NGP) is one of a number of fields observed as part of the Herschel-ATLAS (Eales et al., 2010) with Herschel (Pilbratt et al., 2010). The acquisition and reduction of parallel-mode data from SPIRE (Griffin et al., 2010) and PACS (Poglitsch et al., 2010) are described in detail by Ibar et al. (2010b), Pascale et al. (2011) and Rigby et al. (2011).
The SPIRE imaging led quickly to the selection of HATLAS J132427.0+284452 as a bright all bands , potentially distant , lensed starburst. This source is included in a number of follow-up campaigns, where we have been studying the brightest of these objects (e.g. Negrello et al., 2010; Fu et al., 2012; Omont et al., 2013).
The surface density of lens candidates is likely around 1/40 deg-2 (M. Negrello, priv. comm.), plausibly placing this source among the most strongly lensed known DSFGs.
3 Detailed follow-up observations
Much deeper PACS data were subsequently obtained from the ot1 programme, ot1_rivison_1, recording data simultaneously at 100 and 160 for a total of 6 min, and reaching and 12 mJy respectively.
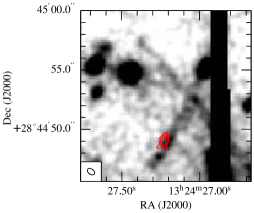
Approximately 30 min of high-resolution 7 GHz continuum data were acquired using the National Radio Astronomy Observatory’s Jansky Very Large Array (NRAO’s VLA) during 2011 June. The observation was performed in A configuration, with -MHz channels in each of two intermediate frequencies (IFs), each IF with dual polarisation, recording data every 1 s. 3C 286 was observed every few minutes to determine accurate complex gain solutions and bandpass corrections, and to set the absolute flux density scale. Using natural weighting, the resulting map has a circular 0.3-arcsec synthesised beam (full width at half maximum, FWHM) and an r.m.s. noise level of .
870- imaging data were obtained using the Submillimeter Array (SMA) as part of programme 2011B-S044, with 9.7 hr of total integration time in the compact, extended, and very extended array configurations, with baselines covering 20–400 m, and the receivers tuned such that the upper sideband was centred on 870 . The blazar, 1924292, was used as the bandpass calibrator and Titan was used for absolute flux calibration. The nearby quasar, 1310+323, was used to track the complex gains.
Following a tentative line detection using Zpectrometer on NRAO’s Green Bank Telescope, plausibly CO at (Harris et al., 2012), we obtained 4.4 hr on-source using all six of the 15-m antennas of the Institut de Radioastronomie Millimétrique’s Plateau de Bure Interferometer (IRAM’s PdBI). These data were taken during 2011 January, in A configuration, with the 2-mm receivers tuned to 139.380 GHz, corresponding to the rest-frame frequency of CO at that redshift. No CO line emission was visible within limits compatible with the flux and further follow-up of HATLAS J132427 was put on hold, pending a more robust redshift determination. We use these data here because they provide a usefully deep , high-resolution 2-mm continuum image.
Via our interferometric imaging shown in Fig. 1 it is immediately obvious that the far-IR source is coincident with the -arcsec giant arc reported by Gladders et al. (2003), strongly lensed by the rich foreground cluster RCS J132427+2845.2, at (Gladders & Yee, 2005).
4 Far-IR and CO spectroscopy
| Wavelength | Notes | ||||
|---|---|---|---|---|---|
| 100 | 41 | mJy | Herschel PACS | ||
| 160 | 180 | mJy | Herschel PACS | ||
| 250 | 347 | mJy | Herschel SPIRE | ||
| 350 | 378 | mJy | Herschel SPIRE | ||
| 500 | 268 | mJy | Herschel SPIRE | ||
| 870 | 30.2 | mJy | SMA | ||
| 2 | mm | 1.2 | mJy | IRAM PdBI | |
| 3.5 | mm | 200 | CARMA | ||
| 4.3 | cm | 350 | VLA | ||
| 21 | cm | 1.95 | mJy | VLA (FIRST) | |
| Errors include 3- and 5-per-cent calibration uncertainties at 100- and 160-, respectively. | |
| Errors include the contribution due to confusion and a 7-per-cent calibration uncertainty has been added in quadrature (Valiante et al., in preparation). |
4.1 A blind redshift from the SPIRE FTS
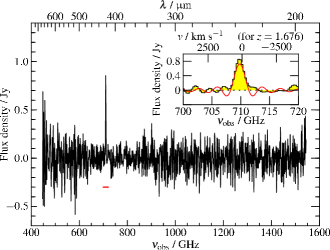
During 2012 August 02, HATLAS J132427 was observed with a single pointing of the SPIRE Fourier Transform Spectrometer (FTS) for 3.8 hr, the spectrum covering . The data were processed using the Herschel data processing pipeline (Fulton et al., 2010) within the Herschel Interactive Processing Environment v10. Spectra from detectors arranged around the central ‘on-source’ detector were averaged to produce a local background measurement, and subtracted from the source spectrum.
The [C ii] transition at rest-frame 157.74 is one of the brightest lines seen in the far-IR waveband, providing up to 1 per cent of (measured across rest-frame 8–1,000 ) in star-forming galaxies (Stacey et al., 1991). Within the spectral range covered by the SPIRE FTS in our observations of lensed starburst galaxies, this line is likely to be the most significant; indeed, it is often the only transition detected (e.g. Ivison et al., 2010b).
The SPIRE FTS spectrum of HATLAS J132427, shown in Fig. 3, displays a 7.5 marginally resolved (1.2 GHz spectral resolution) emission line at . Attributing this to [C ii] indicates a redshift, . No other lines were detected, with , 230, 150, 600 Jy km s-1 for [O iii] 88 , [N ii] 122 , [O i] 145 , and [N ii] 205 respectively, meaning that this redshift remained tentative at this point.
4.2 Redshift confirmation via CO
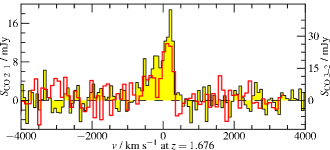
To verify the SPIRE FTS redshift determination, we used the Combined Array for Research in Millimeter-wave Astronomy (CARMA) to search for the CO line (), which should be redshifted to approximately for . Observations were carried out using the 3-mm receivers during 2012 November 23 in D configuration (11–146 m baselines), with 2.3 hr spent on source. The blazars, 1310+323 and 0927+390, were used for complex gain calibration and to derive the bandpass shape. Absolute flux densities should be accurate to within per cent. We obtained an 8 detection of line emission, close to the expected frequency – see Fig. 4 – thus confirming the redshift, with . The 34.8 GHz GBT line is therefore presumably spurious.
We also imaged the source in CO with the IRAM PdBI, also during 2012 November. We obtained 1.1 hr of integration time, using all six of the 15-m antennas, this time in D configuration – the most compact. The observing frequency was set to 129.028 GHz, corresponding to the redshifted frequency of CO () for . Again, we found a bright 3 emission line at the expected frequency, (Fig. 4).
The two line profiles are consistent with one another; neither can be described well with a single Gaussian, suggesting that their shape is due to either a merger or a rotating, gas-rich disk (e.g. Engel et al., 2010; Ivison et al., 2013). The line width (deduced from fits using a single Gaussian), fwhm, is typical of those seen for DSFGs (Greve et al., 2005).
5 Discussion
| Property | Value | |
|---|---|---|
| 33.1 | 3.2 | |
| 1.07 | 0.15 | |
| 21.4 | 5.7 | |
| 2.91 | 0.12 | |
| Synchrotron spectral index | 1.08 | 0.09 |
| 1.85 | 0.09 | |
| SFR | 4,300 | |
| [C ii] | 486 | 52 |
| [C ii] FWHM | 800 | 64 |
| [C ii] | 5.80 | 0.62 |
| CO | 11.3 | 1.4 |
| CO FWHM | 640 | 270 |
| CO | 1.64 | 0.20 |
| CO | 11.5 | 3.5 |
| CO FWHM | 450 | 170 |
| CO | 2.50 | 0.76 |
| 0.45 | 0.15 | |
| 3.6 | 0.6 | |
| SFE | 83 | |
| From fitting SED to dust emission. | |
| Following Murphy et al. (2011). | |
| From fitting a Gaussian with its mean constrained to that of the fit. | |
| Average determined via CO and . |
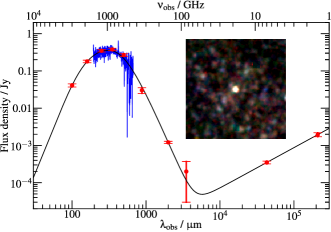
Characterisation of the dust emission of HATLAS J132427 was performed by fitting the power-law dust temperature model of Kovács et al. (2010) to the continuum flux densities detailed in Table 1. Derived quantities are detailed in Table 2.
Of the integrated flux density at 7 GHz, ( per cent) is in a compact component at RA = 13:24:27.225, Dec. = +28:44:49.01 (, J2000), with a best-fit deconvolved size of arcsec arcsec, PA . Comparing this with the 2-mm emission (RA = 13:24:27.229 0.004, Dec. = +28:44:49.07 0.06, J2000, arcsec arcsec, PA ) suggests that the radio emission is significantly more compact than the dusty star-forming material, suggestive of a non-starburst origin. The radio spectral index, (where ) is steeper than the typical , adding credibility to the idea that an AGN dominates the radio emission (e.g. Ibar et al., 2010a). Adopting the widely-used parametrisation of the far-IR/radio correlation, (with measured across rest-frame 8 – 1,000 ) we find a value () rather lower than that usually seen for DSFGs, (Yun et al., 2001; Ivison et al., 2010a, b), again consistent with an AGN-related contribution to the radio luminosity (e.g. Donley et al., 2005).
The [O iii] 88 line was not detected. An [O iii] line of similar SNR to [C ii] was observable from SDP81 (which also has – Valtchanov et al., 2011), this time suggesting that the AGN has a greater influence in SDP81 than in HATLAS J132427 (Abel et al., 2009).
CO is commonly used to trace molecular gas reservoirs. Estimates of the line flux can be derived from the higher- line fluxes assuming Rayleigh-Jeans brightness temperature () ratios, e.g. and (Ivison et al., 2011; Bothwell et al., 2013): consistent with the ratio measured here for , . Adopting , as is usual for starburst galaxies (e.g. Bolatto et al., 2013), we derive a mass, , having averaged the and measurements. Following Harris et al. (2012) and Bothwell et al. (2013), a rough magnification estimate can be derived from the luminosity and linewidth, yielding .
An independent estimate of the gas mass can be derived via the gas-to-dust mass ratio, . For 1/3 Solar metallicity, this is (Sandstrom et al., 2012), suggesting , consistent with our CO-based estimate, albeit with a large uncertainty. These estimates of the gas mass correspond to a star-formation efficiency , and a gas-consumption timescale , consistent with those typically measured for DSFGs (e.g. Greve et al., 2005).
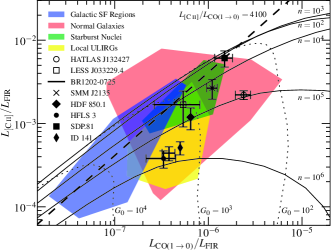
Using the PDR model displayed in Fig. 5, representing the far-UV illuminated surface of an interstellar cloud, we estimate and , a density and far-UV radiation field strength comparable with other high-redshift starbursts. These models assume all CO emission is produced in PDRs, neglecting any contribution from quiescent gas or turbulent heating which provide plausible explanations for the comparatively large in this object, as may increased metallicity. Differential magnification might also affect these derived properties, if the CO and far-IR emission are not co-spatial (e.g. Fu et al., 2012).
Without a detailed mass model of the cluster lens, it is not possible to investigate the extent of differential magnification of the DSFG, but we can nonetheless attempt a plausibility test of the statistical likelihood. Following Serjeant (2012), we modelled a singular isothermal ellipsoid with a 20 arcsecond critical radius and ellipticity of 0.2, with the same submm galaxy model used in that paper. As with the galaxy-scale lenses in Serjeant (2012), we found Fig. 5 to be largely unaffected by differential magnification, even for . However, the aspect ratio of the observed-frame optical emission suggests a high magnification and large angular extent, implying long-baseline interferometric measurements may resolve out some of the emission, as discussed in §4.2.
6 Implications for far-IR integral-field spectroscopy
The Space Infrared Telescope for Cosmology and Astrophysics (SPICA – Swinyard et al., 2009) is a planned successor to Herschel. Thermal emission from the 80 k primary telescope of Herschel is six orders of magnitude brighter than the far-IR background; with a dish temperature of 6 k, SPICA should be two orders of magnitude more sensitive than any previous far-IR facility.
SAFARI – the SpicA FAR-infrared Instrument – is an imaging FTS proposed for SPICA, covering 34–210 over a field of view with an intended spectral resolution and sensitivity (; Swinyard et al., 2009).
Our observation of [C ii] from HATLAS J132427 provides . An [O i] line of this flux will likely be observable to several within two seconds of integration with SPICA. While such sources will likely be known before a SPICA pointing, the ability of Herschel to obtain a blind redshift provides confidence that with observations of order 1 hr, the much more sensitive SPICA will pinpoint redshifts of multiple unlensed few-mJy CIB sources (potentially several from each spectrum – Clements et al., 2007; Raymond et al., 2010), reducing the need for the blind CO line searches typically required today. With such integration times, blind fine-structure line detections are feasible and a gateway to detailed imaging/dynamical studies with ALMA.
7 Conclusions
We present the first blind redshift to have been obtained via Herschel spectroscopy. The galaxy, at , is lensed by a rich galaxy cluster at into an arc of length . A lensing model will be presented in Fu et al. (in preparation).
This source appears to be a disk-like system, with a best-fit of , dust temperature of , and SFR of , and a compact AGN-related contribution to the radio flux density.
The observed [C ii] flux is , suggesting an [O i] line of similar flux could be detected by SPICA to with an integration time of order 3 sec. Even many unlensed DSFGs may require no more than hr of integration. The feasibility of blind line detections will not only directly advance our knowledge of high-redshift systems and their interstellar media, but act as a gateway to detailed imaging and spectral studies with (sub-)millimetre interferometers such as ALMA.
Acknowledgements
We thank Howard Yee and Michael Gladders for providing the CFHT image. US participants in H-ATLAS acknowledge support from NASA through a contract from JPL. RJI acknowledges support from the European Research Council (ERC) in the form of Advanced Grant, cosmicism. Herschel was an ESA space observatory with science instruments provided by European-led Principal Investigator consortia and with important participation from NASA. IRAM is supported by INSU/CNRS (France), MPG (Germany) and IGN (Spain). Support for CARMA construction was derived from the states of California, Illinois, and Maryland, the James S. McDonnell Foundation, the Gordon and Betty Moore Foundation, the Kenneth T. and Eileen L. Norris Foundation, the University of Chicago, the Associates of the California Institute of Technology, and the National Science Foundation. Ongoing CARMA development and operations are supported by the National Science Foundation under a cooperative agreement, and by the CARMA partner universities. The NRAO is a facility of the NSF operated under cooperative agreement by Associated Universities, Inc. The SMA is a joint project between the Smithsonian Astrophysical Observatory and the Academia Sinica Institute of Astronomy and Astrophysics and is funded by the Smithsonian Institution and the Academia Sinica.
References
- Abel et al. (2009) Abel N. P. et al., 2009, ApJ, 701, 1147
- Blain et al. (2002) Blain A. W. et al., 2002, Phys. Rep., 369, 111
- Bolatto et al. (2013) Bolatto A. D., Wolfire M., Leroy A. K., 2013, arXiv:1301.3498
- Bothwell et al. (2013) Bothwell M. S. et al., 2013, MNRAS, 429, 3047
- Clements et al. (2007) Clements D. L. et al., 2007, A&A, 465, 125
- Cox et al. (2011) Cox P. et al., 2011, ApJ, 740, 63
- De Breuck et al. (2011) De Breuck C. et al., 2011, A&A, 530, L8
- Donley et al. (2005) Donley J. L. et al., 2005, ApJ, 634, 169
- Eales et al. (2010) Eales S. et al., 2010, PASP, 122, 499
- Engel et al. (2010) Engel H. et al., 2010, ApJ, 724, 233
- Fu et al. (2012) Fu H. et al., 2012, ApJ, 753, 134
- Fulton et al. (2010) Fulton T. R. et al., 2010, SPIE Conference Series, 7731
- Gladders et al. (2003) Gladders M. D. et al., 2003, ApJ, 593, 48
- Gladders & Yee (2005) Gladders M. D., Yee H. K. C., 2005, ApJS, 157, 1
- Greve et al. (2005) Greve T. R. et al., 2005, MNRAS, 359, 1165
- Griffin et al. (2010) Griffin M. J. et al., 2010, A&A, 518, L3
- Hailey-Dunsheath et al. (2010) Hailey-Dunsheath S. et al., 2010, ApJL, 714, L162
- Harris et al. (2012) Harris A. I. et al., 2012, ApJ, 752, 152
- Holland et al. (1999) Holland W. S. et al., 1999, MNRAS, 303, 659
- Ibar et al. (2010a) Ibar E. et al., 2010a, MNRAS, 401, L53
- Ibar et al. (2010b) Ibar E. et al., 2010b, MNRAS, 409, 38
- Ivison et al. (2010a) Ivison R. J. et al., 2010a, A&A, 518, L31
- Ivison et al. (2011) Ivison R. J. et al., 2011, MNRAS, 412, 1913
- Ivison et al. (2013) Ivison R. J. et al., 2013, ApJ, 772, 137
- Ivison et al. (2010b) Ivison R. J. et al., 2010b, A&A, 518, L35
- Komatsu et al. (2011) Komatsu E. et al., 2011, ApJS, 192, 18
- Kovács et al. (2010) Kovács A. et al., 2010, ApJ, 717, 29
- Murphy et al. (2011) Murphy E. J. et al., 2011, ApJ, 737, 67
- Negrello et al. (2010) Negrello M. et al., 2010, Science, 330, 800
- Omont et al. (2013) Omont A. et al., 2013, A&A, 551, A115
- Pascale et al. (2011) Pascale E. et al., 2011, MNRAS, 415, 911
- Pilbratt et al. (2010) Pilbratt G. L. et al., 2010, A&A, 518, L1
- Poglitsch et al. (2010) Poglitsch A. et al., 2010, A&A, 518, L2
- Raymond et al. (2010) Raymond G. et al., 2010, PASJ, 62, 697
- Riechers et al. (2013) Riechers D. A. et al., 2013, Nature, 496, 329
- Rigby et al. (2011) Rigby E. E. et al., 2011, MNRAS, 415, 2336
- Sandstrom et al. (2012) Sandstrom K. M. et al., 2012, arXiv:1212.1208
- Serjeant (2012) Serjeant S., 2012, MNRAS, 424, 2429
- Stacey et al. (1991) Stacey G. J. et al., 1991, ApJ, 373, 423
- Swinbank et al. (2011) Swinbank A. M. et al., 2011, ApJ, 742, 11
- Swinyard et al. (2009) Swinyard B. et al., 2009, Experimental Astronomy, 23, 193
- Valtchanov et al. (2011) Valtchanov I. et al., 2011, MNRAS, 415, 3473
- Wagg et al. (2012) Wagg J. et al., 2012, ApJL, 752, L30
- Walter et al. (2012) Walter F. et al., 2012, Nature, 486, 233
- Weiß et al. (2013) Weiß A. et al., 2013, ApJ, 767, 88
- Yun et al. (2001) Yun M. S., Reddy N. A., Condon J. J., 2001, ApJ, 554, 803