Assembly Bias of Dwarf-sized Dark Matter Haloes
Abstract
Previous studies indicate that assembly bias effects are stronger for lower mass dark matter haloes. Here we make use of high resolution re-simulations of rich clusters and their surroundings from the Phoenix Project and a large volume cosmological simulation, the Millennium-II run, to quantify assembly bias effects on dwarf-sized dark matter haloes. We find that, in the regions around massive clusters, dwarf-sized haloes ( ) form earlier ( in redshift) and possess larger () than the field galaxies. We find that this environmental dependence is largely caused by tidal interactions between the ejected haloes and their former hosts, while other large scale effects are less important. Finally we assess the effects of assembly bias on dwarf galaxy formation with a sophisticated semi-analytical galaxy formation model. We find that the dwarf galaxies near massive clusters tend to be redder () and have three times as much stellar mass compared to the field galaxies with the same halo mass. These features should be seen with observational data.
keywords:
methods: N-body simulations – methods: numerical –dark matter galaxies: haloes1 Introduction
Halo assembly bias describes the phenomenon that the clustering of dark matter halo depends not only on their halo mass but also on the properties, such as formation time, concentration parameter, spin and substructure fraction (e.g. Gao et al., 2005; Harker et al., 2006; Wechsler et al., 2006; Gao & White, 2007; Jing et al., 2007; Li et al., 2008). For a given halo mass, earlier-forming dark matter haloes are more strongly clustered. The difference in clustering with formation time becomes larger as halo mass decreases (e.g. Gao et al., 2005). These results contradict the standard excursion set theory of structure formation and the theory behind the so-called halo occupation distribution model, in which the galaxy content of a halo is assumed to be statistically independent of its large scale environment (e.g. Jing et al., 1998; Peacock & Smith, 2000; Yang et al., 2003).
A number of theoretical studies have been carried out to understand this phenomenon (e.g. Wang et al., 2007; Sandvik et al., 2007; Desjacques, 2008; Wang et al., 2009; Dalal et al., 2008; Hahn et al., 2007, 2009; Ludlow et al., 2009; Tinker et al., 2011; Lacerna & Padilla, 2011, 2012). For example, Wang et al. (2007) found that old low mass haloes tend to reside next to massive haloes. The larger velocity dispersion and local tidal field around clusters may suppress the halo growth of the small haloes. Furthermore, numerical simulations show that a fraction of individual haloes with highly eccentric orbits around more massive systems are former members of the system that have been expelled. (e.g. Balogh et al., 2000; Benson, 2005; Wang et al., 2009; Bahé et al., 2012; Sales et al., 2007). These haloes can lose a substantial fraction of mass, during their passage through the larger system, which naturally induces a form of assembly bias. An similar effect, which is often referred to as ”pre-processing” (hereafter PREP), comes from interactions between low mass haloes and infalling groups in the regions around clusters(Berrier et al., 2009; McGee et al., 2009). On the observational side, a number of studies explore the assembly bias. Results are controversial, some studies claim its existence (e.g. Yang et al., 2006; Wang et al., 2008; Cooper et al., 2010; Tinker et al., 2012; Kauffmann et al., 2013; Wang et al., 2013; Wetzel et al., 2013), while others claim it is non-significant(e.g. Blanton & Berlind, 2007; Tinker et al., 2008; Skibba & Sheth, 2009).
In this work, we explore assembly bias effects on the properties of dwarf-sized dark matter haloes, taking advantage of extremely high resolution re-simulations of rich clusters and their surroundings from the Phoenix Project and the cosmological volume Millennium-II simulation. These simulations resolve very low mass dark matter haloes for which assembly bias effects are expected to be strong. Furthermore, we distinguish different origins of assembly bias according to the assembly history of haloes. In addition, we assess the consequences of assembly bias on dwarf galaxy formation using a sophisticated semi-analytical galaxy formation model(hereafter SAM).
The structure of the paper is as follows. In section 2, we describe briefly the numerical simulations, halo samples and galaxy formation model used in this study. In section 3, we present results of assembly bias effects on various properties of dwarf-sized dark matter haloes. In section 7, we explore how assembly bias affects the dwarf galaxy properties. Finally we summarize and discuss our results in section 5.
2 Method
2.1 Numerical simulations
Numerical simulations used in this work comprise high resolution re-simulations of 9 individual rich clusters and their surroundings from the Phoenix Project (Gao et al., 2012) and a high resolution cosmological simulation – the Millennium-II (MSII, Boylan-Kolchin et al., 2009). The dwarf-sized haloes near the Phoenix cluster regions are used as our high density environment halo sample, while those in the MS-II represent the haloes in the field.
Each Phoenix cluster has been simulated at different resolutions in order to facilitate numerical convergence studies. Here, we use the simulations with level 2 resolution which contains about particles inside the virial radius of each cluster. The least massive dwarf-sized haloes considered in this work () are resolved with more than 200 particles. The MS-II run evolved particles of mass in a periodic box of on a side. Hence the mass resolutions of the MS-II and the Phoenix Project are comparable. All these simulations adopt identical cosmological parameters from a combination of 2dFGRS (Colless et al., 2001) and first-year WMAP data (Spergel et al., 2003), = 0.25, =0.045, , , , and . These cosmological parameters deviate slightly from the latest CMB results(Hinshaw et al., 2012; Planck Collaboration et al., 2013). The small offset is of no consequence for the topic addressed in this paper because the detailed structure of dark matter haloes depends only weakly on the cosmological parameters(e.g. Duffy et al., 2008).
Dark Matter haloes in our simulations are identified with standard friends-of-friends(FOF) group algorithm with a linking length 0.2 times the mean inter-particle separation (Davis et al., 1985). Based on group catalogue, we further identify self-bound substructures within FOF haloes using SUBFIND (Springel et al., 2001) and construct merger trees tracing subhaloes between snapshots (Springel et al., 2005; Boylan-Kolchin et al., 2009). For a halo at z=0, its main progenitor at is defined as the subhalo which contains the largest fraction of its particles.
The assembly history of small dark matter haloes in massive rich cluster regions is complicated. We divide the Phoenix haloes into three separated samples according to the different formation path: 1) A clean halo sample (hereafter CLEAN) comprising dark matter haloes which have never be accreted as a subhalo of a more massive FOF group at any redshift; 2) An ejected halo sample (hereafter EJECT) comprising dark matter haloes which were identified at least once as a subhalo of the main progenitor of one of the Phoenix cluster haloes. 3) A pre-processed halo sample (hereafter PREP) comprising dark matter haloes which were identified at least once as a subhalo of a FOF group other than the main progenitor of one of the Phoenix cluster haloes.
Since the Phoenix project is a set of ”zoom-in” re-simulations, only a very small fraction of whole volume is filled with high resolution particles, and the rest of the density field is sampled with low resolution particles. For such ”zoom-in” simulations, low resolution particles often mix with high resolution ones at the boundary of the high density regions. It is important to identify the region where halo samples are free from contamination by low resolution particles. We find that, for all simulations, there is no contamination for dark haloes within of the dominant clusters. Here is defined as the radius at which the enclosed density is times of the critical density of the universe.
In Fig. 1, we plot the fraction of these three halo samples in the Phoenix simulations as a function of scaled radius for two halo mass ranges and . As can be seen clearly from the left-hand panel, EJECT haloes dominate the whole population close to the virial radius, where about percent of dark matter haloes have once been a member of the Phoenix clusters. The fraction of EJECT haloes drops rapidly with increasing radius and these haloes no longer dominate the population outside . At the larger radii, the CLEAN sample dominates. The PREP sample accounts for 20 percent of the whole population outside and gradually drops to percent at . The right panel shows results for more massive haloes in the mass range , where the respective fractions of populations are very similar to those of lower mass haloes as shown in the left panel. Our results are consistent with those of Wang et al. (2009) and Bahé et al. (2012) who found a similar fraction of EJECT haloes in their simulation, although for more massive haloes, suggesting that the fraction of ejected haloes are largely independent of halo mass.
In following sections, we will only consider haloes with cluster-centric radii of . We consider this specific range for two reasons. 1) is the radius inside which the resolved dark haloes do not suffer from contamination from heavy particles. 2) is roughly the scale of FOF groups corresponding to Phoenix clusters. In these volumes around the nine Phoenix clusters, there are a total of 46000 haloes within mass range , and the fractions of the CLEAN, PREP, EJECT haloes are 45%, 15%, and 40%, respectively.

2.2 Semi-analytical galaxies
In order to assess the effect of assembly bias on dwarf galaxy formation, we use the semi-analytical galaxy formation model of Guo et al. (2011, hereafter G11) to derive galaxy properties. With MS and MS-II simulations, the G11 SAM model well reproduces various observed galaxy properties. In particular, it reproduces the stellar mass function of the Universe across 5 orders of magnitude. In this work, we also apply the SAM on the Phoenix simulations.
Galaxy formation and evolution is subjected to environmental effects, which are reasonably modeled in the G11 SAM. For galaxies forming in the CLEAN haloes, the environmental dependence is expected to come from the halo growth history. For example, in high density environments, the high velocity dispersion of dark matter particles and the local tidal fields may suppress the growth of low mass haloes (e.g. Wang et al., 2007; Dalal et al., 2008; Hahn et al., 2009), and suppress the gas accretion in these haloes. For the PREP and the EJECT halo samples, additional effects come from interactions with their former host haloes. When a dark matter halo is accreted by a larger system, tidal forces strip both its baryonic and dark matter components. In addition, ram pressure strips the hot gas component. Both mechanisms suppress star formation and influence galaxy properties. Below, we briefly describe the physical prescriptions of these two effects in the G11 model.
In the G11 model, the hot gas distribution in subhalo is assumed to parallel that of the dark matter. Since the tidal force is identical for both components, the fraction of the stripped hot gas is in proportion to that of the dark matter. The latter has already been followed in the original N-body simulation. Thus, we have
| (1) |
where and are the dark matter and the hot gas masses of the subhalo, while and are the masses of these two components at the time of infall. If we assume that the hot gas follows a profile, the tidal radius can be written as:
| (2) |
where is the viral radius of the subhalo at its infall. Beyond the tidal radius, the hot gas is assumed to be stripped off.
Unlike tidal stripping, ram pressure stripping only exerts on the hot gas component. The gas pressure of a host halo at radius is , where is the hot gas density and is the orbit velocity at . The self-gravity of the subhalo balances the host halo hot gas pressure at radii , i.e.
| (3) |
where is the hot gas density of the satellite at radius , is the virial velocity of the subhalo at infall (which is assumed to be constant as the subhalo orbits around the main halo). The ram-pressure dominates over gravity beyond and removes the hot gas of subhaloes outside the radius. Therefore, the final stripping radius is defined as:
| (4) |
The stripped gas is added to the hot gas component of the host halo. In the G11 model, stripping does not modify the gas profile within . Thus the cooling rate onto the center is not affected immediately. However, removal of the hot gas suppresses gas cooling and quenches star formation eventually. We refer readers to G11 for more details.
3 Halo properties
In this section, we present the properties of dwarf-sized dark matter haloes in the Phoenix simulations and compare them to those of MS-II.
3.1 Mass function
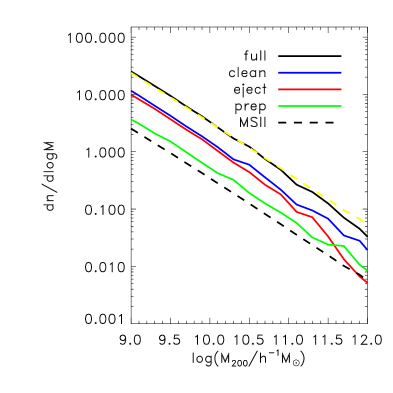
We first examine whether the shape of the halo mass function in the regions around the Phoenix clusters differs from the cosmic mean derived from the MS-II simulation. The amplitude of the halo mass function is expected to be higher in cluster regions because of the higher density, but it is not clear whether the shape of the mass function changes with environment. To this end, we show in Fig. 2 the halo mass function in the specified volumes of the Phoenix and the MS-II simulations. The black solid line corresponds to the mass function of all surrounding haloes residing within (full sample) of the Phoenix clusters, and the dashed black line stands for the halo mass function of the MS-II simulation. For easier comparison, we rescale the MS-II mass function vertically (yellow dashed line) to match the amplitude of the full Phoenix sample. Clearly, the slopes of the two halo mass functions are identical in all shown halo mass ranges except for the high mass end, where the Poisson noise is largest. We also show the mass functions of CLEAN, EJECT and PREP samples separately with different lines. Again, there is no apparent difference at the low halo mass end, while the mass function of EJECT sample is steeper above halo mass . This may reflect the fact that the massive haloes in the EJECT sample suffer strong stripping effect and lost substantial fraction of mass during interaction with massive clusters.
3.2 Halo assembly history
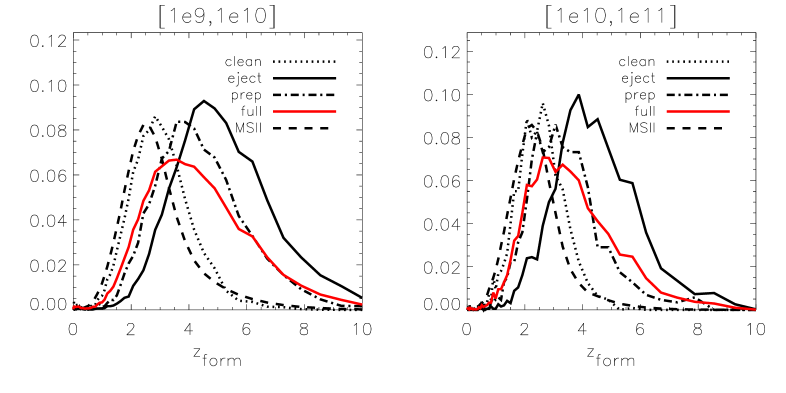
We show the formation time distribution of dark haloes in different simulations and for different halo samples in Fig. 3. Here we define the halo formation time to be the epoch at which the main progenitor of the halo reaches the half of its present day mass. The results are shown for two halo mass ranges: (left-hand panel) and (right-hand panel). Compared to the MS-II haloes, the haloes in the regions around the Phoenix clusters form earlier. For haloes in the mass range of , the median formation time is about for the Phoenix haloes, while it is at a much later redshift for the MS-II haloes. We also show the formation time distribution for our three Phoenix halo samples. The median formation redshift of the CLEAN sample, , is only slightly larger than MS-II average, while the PREP and EJECT samples forms much earlier than the MS-II sample. In the right panel, we show that the results for more massive haloes have the same trend.
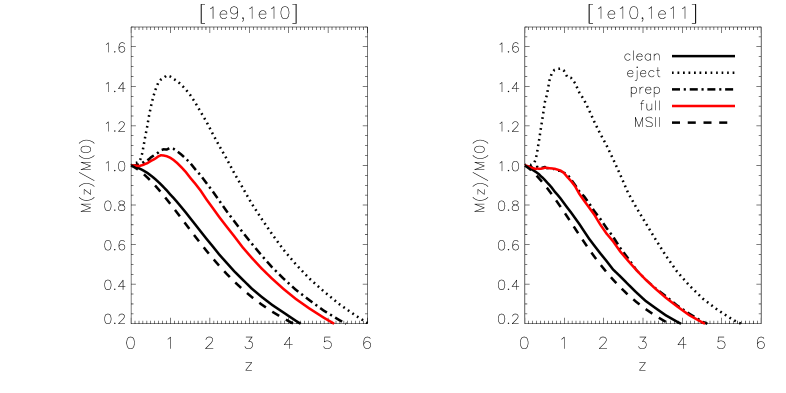
We further explore the assembly history of the haloes in the two mass ranges for different samples. In Fig. 4, we plot the growth history of haloes as a function of redshift. The growth history of the halo is defined as the ratio of its mass at redshift to its present day mass, . For different halo samples, the median values of are shown with different lines. For the CLEAN haloes, their mass increases monotonically with time and their assembly is only slightly earlier than that of the MS-II haloes. The EJECT haloes acquire their mass much earlier than the other two samples. Statistically, EJECT haloes reach their maximum mass, which is percent more than their present day value, at redshift , then lose a significant fraction of mass afterwards due to their interactions with the clusters. The same is true for the PREP sample, except for the peak mass. On average, the Phoenix dwarf-sized haloes are percent more massive than the MS-II haloes at , reflecting the fact that most interactions occur after redshift 2. The results for our two different mass ranges are similar.
3.3 Halo structure
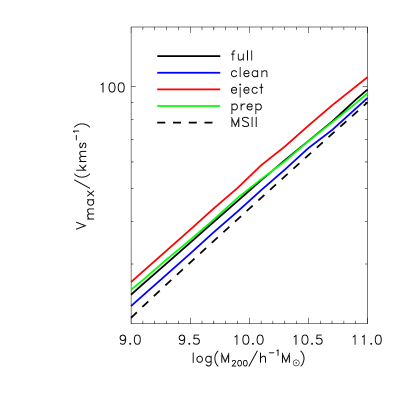
To examine how assembly bias affects halo structure, we plot the maximum circular velocity of dark matter haloes, , as a function of the halo mass for different halo samples in Fig. 5. For a given mass, the of a halo is a proxy for its concentration. More concentrated haloes have larger . For the dwarf-sized haloes of the Phoenix simulations, the median value is percent larger than that of the MS-II haloes. The differences are noticeable yet very small between the CLEAN sample and the MS-II sample. The median values of PREP and EJECT haloes are and larger than that of MS-II haloes. Recent studies (e.g. Gao et al., 2012) show that while the tidal force removes a significant fraction of dark matter from the subhalo, it only reduces slightly. Thus, the larger in the Phoenix haloes may reflect the fact that these haloes were more massive in the past and interactions with larger haloes do not reduce their maximum circular velocity significantly. On the other hand, the small difference between the CLEAN sample and MS-II sample implies that the direct influence from large scale density field and large scale tidal field on the structure of dwarf-sized haloes is weak.
Note that, while the assembly bias effects shown above are mainly due to tidal interactions between the ejected haloes and their former hosts, it doesn’t mean that the assembly bias seen in the clustering of haloes is also dominated by this mechanism. Dalal et al. (2008) argued that at the low mass end, the assembly bias in the clustering of haloes is due to the formation of a non-accreting population of haloes in the vicinity region of massive haloes. However, Keselman & Nusser (2007) found that assembly bias in the clustering of haloes is still present even after excluding the non-linear effects such as tidal disruption. Wang et al. (2009) investigated the properties of ejected haloes in mass range from to , and found that though the ejected haloes have a much higher halo bias than the field haloes, they can not fully account for the assembly bias in the clustering of haloes because of their low abundance (less than 10%). The large scale environmental effects such as large scale tidal field also play an important role in assembly bias in the clustering of haloes(e.g. Wang et al., 2007; Hahn et al., 2007, 2009).
4 Galaxy properties
As shown in the previous sections, assembly bias affects the properties of dark matter haloes significantly. It may in turn influence galaxy properties such as halo occupation, color, etc. In this work, We explore the effects of assembly bias on the properties of dwarf galaxies in the galaxy formation model of Guo et al. (2011), which incorporates all the necessary baryon physics.
We divide the Phoenix galaxies into different categories according to their host halo samples. We refer to the galaxies in the EJECT, PREP and CLEAN haloes as the EJECT, PREP and CLEAN galaxies, respectively. Here we also use the MS-II galaxy catalog of G11 to represent the galaxy population in the field. For a fair and easy comparison, we only consider galaxies which reside in the haloes considered in previous sections, i.e. within the mass range of .
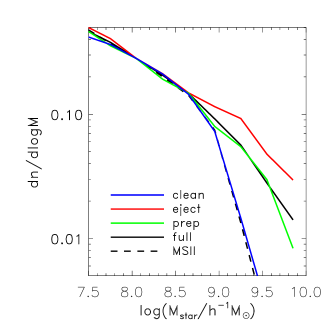
Fig. 6 shows the stellar mass functions of galaxies. In order to compare the shapes of the stellar mass functions in different halo samples, we normalize these curves at the same stellar mass scale . Clearly the stellar mass functions of different samples have identical shapes at the low mass end but start to differ at the stellar mass of . At the high mass end, the slope of the stellar mass function is flatter for the galaxies in the regions around clusters. The difference becomes larger as mass increases. For Phoenix galaxies, the stellar mass function of EJECT galaxies has very flat slope at the high mass end, and the mass function of CLEAN galaxies roughly follows that of MS-II. The difference of the stellar mass functions at the high mass end between Phoenix and MS-II galaxies is caused by our restriction on the host halo mass range. Since tidal striping causes significant mass loss in EJECT and PREP haloes, galaxies near clusters occupy less massive haloes than the field galaxies of the same stellar mass (also see Fig. 7). Therefore, for a given upper mass limit of haloes, the fraction of massive galaxies is larger for the Pheonix sample. Note that, without the restriction on the halo mass, the shape of stellar mass function of the two simulations will be very similar, in agreement with observation results of Calvi et al. (2013).
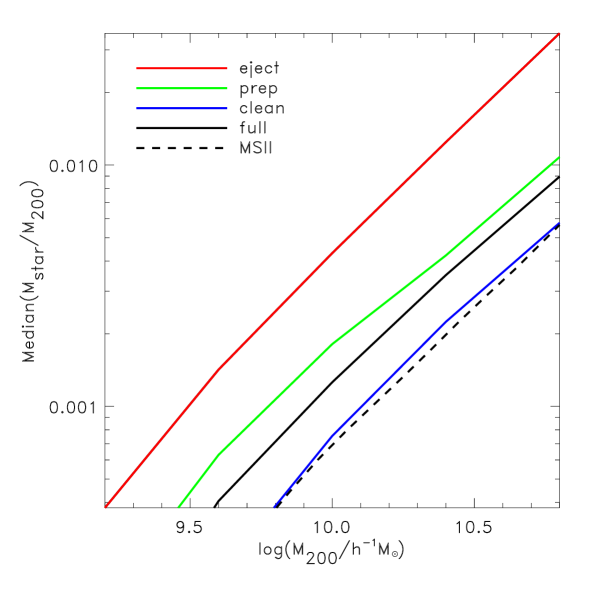
We show in Fig. 7 the ratio of stellar mass to halo mass as a function of halo mass for the Phoenix (black solid) and MS-II simulations (black dashed). The ratios for both simulations have very similar power law relations with halo mass, while the amplitude of the former is a factor of 2 higher. The results for our 3 samples of Phoenix galaxies are also shown in the same plot. For a given halo mass, the median stellar mass fraction of the EJECT halo sample is a factor of 5 higher than that of the MS-II halo sample. This can be easily understood within the SAM framework that the stellar component of a dwarf galaxy changes little even when a large fraction of the dark matter is stripped. For the CLEAN sample, the stellar mass to halo mass ratio is only about 10 percent higher than that of the MS-II, suggesting that the environmental dependence of the dwarf galaxies mainly comes from the tidal interactions between the ejected haloes and their former host haloes. Recent work by Wetzel et al. (2013) explored the stellar mass-halo mass ratio using the abundance matching method. For galaxies in the stellar mass range, they find this ratio for the ejected galaxies is times higher than that of field galaxies. This is similar to the results found in our work for lower mass galaxies. We expect that this environmental dependence can be measured with future galaxy-galaxy lensing surveys (Li et al., 2013).
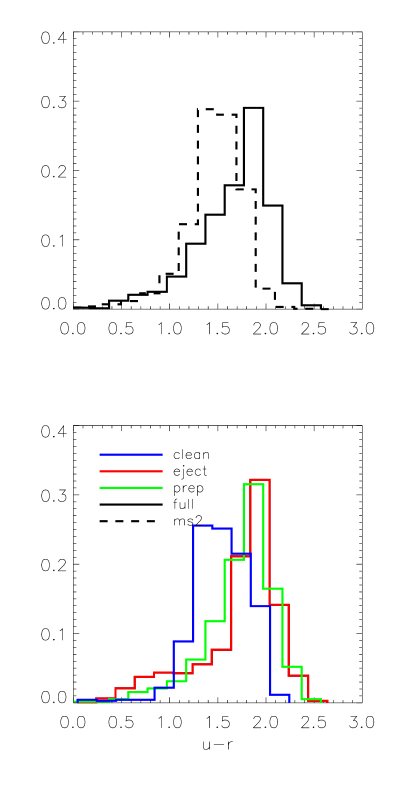
As discussed before, interactions with massive haloes remove the hot gas and therefore suppress star formation activity, which in turn may affect the color of galaxies. In Fig. 8, we compare the SDSS u-r color for the Phoenix and MS-II galaxies. Dwarf galaxies near Phoenix clusters are on average magnitudes redder than MS-II galaxies, while the color distribution of the CLEAN galaxies is almost the same with that of MS-II galaxies. We also show the colors for our three Phoenix galaxy samples separately. The EJECT and PREP samples are much redder than the CLEAN sample. Combining the results shown in Fig.8 and Fig.7, we expect an enhanced stellar-halo mass ratio to be seen in the reddest dwarf galaxies near clusters.
Recent studies show that there might be tension between the G11 model and observational data. It was shown in Guo et al. (2011) and Weinmann et al. (2012) that the low mass galaxies in G11 model are too red. Weinmann et al. (2011) also found that the galaxies in G11 model seem to form too early. In addition, Weinmann et al. (2012) showed that though G11 model well reproduces the red galaxy fraction in clusters for Coma and Perseus, it fails to explain the low red fraction of faint galaxies in Virgo cluster, which may be partly due to the treatment of environmental effects in G11 model. Wang et al. (2013) studied the assembly bias by investigating the dependence of the clustering of central galaxies on the specific star formation rate and found that the observed assembly bias in SDSS data is weaker than that predicted by the G11 SAM. These studies suggest that assembly bias effects may be over estimated by the G11 model. Therefore, it is important to confront our predictions with real observational data in future.
5 Discussion and summary
In this paper, we use the state-of-art dark matter simulations to explore how assembly bias affects the properties of dwarf-sized dark matter haloes and their galaxies. We divide our haloes into three different samples according to their assembly history and investigate the origin of assembly bias effects. We then combine our simulations with the semi-analytical galaxy model of G11 to examine how these effects influence the observable properties of galaxies. Our main results can be summarized as follows:
(i) Among all dwarf-sized haloes distributed in a cluster-centric range of around rich cluster haloes, about have been accreted by the cluster haloes in the past(EJECT haloes). The fraction increases with cluster-centric radii decreasing. About of haloes in the same region have ordinary growth tracks, i.e. have no substantial interactions with larger objects (CLEAN sample). The remaining of the haloes have been accreted by haloes other than the cluster haloes in the past (PREP sample). These respective fractions are largely independent of halo mass.
(ii) Dwarf-sized haloes near clusters on average forms earlier than the haloes in the field by a redshift difference . The maximum circular velocity of dwarf haloes near the clusters is also 20% larger.
(iii) On average, the mass of the EJECT halo sample reaches a peak at about redshift 1, at times the present day mass. In contrast, the mass of CLEAN haloes grow monotonically with redshift.
(iv) For a given halo mass, dwarf-sized haloes near clusters have three times as much stellar mass compared to the field haloes. This factor is largely independent of halo mass. Such a difference may be confirmed by future observations, such as galaxy-galaxy lensing surveys (Li et al., 2013).
(v) Dwarf galaxies in the regions around clusters are 0.5 magnitude redder than the galaxies in the field.
When considering the different origins of assembly bias, we find that the differences seen in halo and galaxy properties are largely due to tidal interactions between the ejected haloes and their former host haloes, while the influences from the large scale environment such as the tidal field and the velocity field are weak. It should be possible to explore the assembly bias effects on dwarf galaxies in observations.
Acknowledgements
Some of simulations used in this work were carried out on the Lenova Deepcomp7000 supercomputer of the super Computing Centre of Chinese Academy of Sciences, Beijing, China. LR is supported by China Postdoctoral Science Foundation, Grant NO. 2011M500395 and NAOC Science Funds for Youth Scholar. LG acknowledges support from the one-hundred-talents program of the Chinese academy of science (CAS), the National Basic Research Program of China (program 973 under grant No. 2009CB24901), NSFC grants (Nos. 10973018 and 11133003), MPG partner Group family, and an STFC Advanced Fellowship, as well as the hospitality of the Institute for Computational Cosmology at Durham University. The authors acknowledge the suggestions of Dr. Lan Wang and Dr. Andrew Cooper.
References
- Bahé et al. (2012) Bahé Y. M., McCarthy I. G., Crain R. A., Theuns T., 2012, MNRAS, 424, 1179
- Balogh et al. (2000) Balogh M. L., Navarro J. F., Morris S. L., 2000, ApJ, 540, 113
- Benson (2005) Benson A. J., 2005, MNRAS, 358, 551
- Berrier et al. (2009) Berrier J. C., Stewart K. R., Bullock J. S., Purcell C. W., Barton E. J., Wechsler R. H., 2009, ApJ, 690, 1292
- Blanton & Berlind (2007) Blanton M. R., Berlind A. A., 2007, ApJ, 664, 791
- Boylan-Kolchin et al. (2009) Boylan-Kolchin M., Springel V., White S. D. M., Jenkins A., Lemson G., 2009, MNRAS, 398, 1150
- Calvi et al. (2013) Calvi R., Poggianti B. M., Vulcani B., Fasano G., 2013, MNRAS, 432, 3141
- Colless et al. (2001) Colless M., Dalton G., Maddox S., et al., 2001, MNRAS, 328, 1039
- Cooper et al. (2010) Cooper M. C., Gallazzi A., Newman J. A., Yan R., 2010, MNRAS, 402, 1942
- Dalal et al. (2008) Dalal N., White M., Bond J. R., Shirokov A., 2008, ApJ, 687, 12
- Davis et al. (1985) Davis M., Efstathiou G., Frenk C. S., White S. D. M., 1985, ApJ, 292, 371
- Desjacques (2008) Desjacques V., 2008, MNRAS, 388, 638
- Duffy et al. (2008) Duffy A. R., Schaye J., Kay S. T., Dalla Vecchia C., 2008, MNRAS, 390, L64
- Gao et al. (2012) Gao L., Navarro J. F., Frenk C. S., Jenkins A., Springel V., White S. D. M., 2012, MNRAS, 425, 2169
- Gao et al. (2005) Gao L., Springel V., White S. D. M., 2005, MNRAS, 363, L66
- Gao & White (2007) Gao L., White S. D. M., 2007, MNRAS, 377, L5
- Guo et al. (2011) Guo Q., White S., Boylan-Kolchin M., et al., 2011, MNRAS, 413, 101
- Hahn et al. (2007) Hahn O., Carollo C. M., Porciani C., Dekel A., 2007, MNRAS, 381, 41
- Hahn et al. (2009) Hahn O., Porciani C., Dekel A., Carollo C. M., 2009, MNRAS, 398, 1742
- Harker et al. (2006) Harker G., Cole S., Helly J., Frenk C., Jenkins A., 2006, MNRAS, 367, 1039
- Hinshaw et al. (2012) Hinshaw G., Larson D., Komatsu E., et al., 2012, ArXiv:astro-ph/1212.5226
- Jing et al. (1998) Jing Y. P., Mo H. J., Boerner G., 1998, ApJ, 494, 1
- Jing et al. (2007) Jing Y. P., Suto Y., Mo H. J., 2007, ApJ, 657, 664
- Kauffmann et al. (2013) Kauffmann G., Li C., Zhang W., Weinmann S., 2013, MNRAS, 430, 1447
- Keselman & Nusser (2007) Keselman J. A., Nusser A., 2007, MNRAS, 382, 1853
- Lacerna & Padilla (2011) Lacerna I., Padilla N., 2011, MNRAS, 412, 1283
- Lacerna & Padilla (2012) Lacerna I., Padilla N., 2012, MNRAS, 426, L26
- Li et al. (2013) Li R., Mo H. J., Fan Z., Yang X., Bosch F. C. v. d., 2013, MNRAS, 430, 3359
- Li et al. (2008) Li Y., Mo H. J., Gao L., 2008, MNRAS, 389, 1419
- Ludlow et al. (2009) Ludlow A. D., Navarro J. F., Springel V., Jenkins A., Frenk C. S., Helmi A., 2009, ApJ, 692, 931
- McGee et al. (2009) McGee S. L., Balogh M. L., Bower R. G., Font A. S., McCarthy I. G., 2009, MNRAS, 400, 937
- Peacock & Smith (2000) Peacock J. A., Smith R. E., 2000, MNRAS, 318, 1144
- Planck Collaboration et al. (2013) Planck Collaboration, Ade P. A. R., Aghanim N., et al., 2013, ArXiv: astroph/1303.5076
- Sales et al. (2007) Sales L. V., Navarro J. F., Abadi M. G., Steinmetz M., 2007, MNRAS, 379, 1475
- Sandvik et al. (2007) Sandvik H. B., Möller O., Lee J., White S. D. M., 2007, MNRAS, 377, 234
- Skibba & Sheth (2009) Skibba R. A., Sheth R. K., 2009, MNRAS, 392, 1080
- Spergel et al. (2003) Spergel D. N., Verde L., Peiris H. V., et al., 2003, ApJS, 148, 175
- Springel et al. (2005) Springel V., White S. D. M., Jenkins A., et al., 2005, Nature, 435, 629
- Springel et al. (2001) Springel V., Yoshida N., White S. D. M., 2001, Nature, 6, 79
- Tinker et al. (2011) Tinker J., Wetzel A., Conroy C., 2011, ArXiv:astroph/1107.5046
- Tinker et al. (2008) Tinker J. L., Conroy C., Norberg P., Patiri S. G., Weinberg D. H., Warren M. S., 2008, ApJ, 686, 53
- Tinker et al. (2012) Tinker J. L., George M. R., Leauthaud A., et al., 2012, ApJL, 755, L5
- Wang et al. (2009) Wang H., Mo H. J., Jing Y. P., 2009, MNRAS, 396, 2249
- Wang et al. (2007) Wang H. Y., Mo H. J., Jing Y. P., 2007, MNRAS, 375, 633
- Wang et al. (2013) Wang L., Weinmann S. M., De Lucia G., Yang X., 2013, MNRAS
- Wang et al. (2008) Wang Y., Yang X., Mo H. J., van den Bosch F. C., Weinmann S. M., Chu Y., 2008, ApJ, 687, 919
- Wechsler et al. (2006) Wechsler R. H., Zentner A. R., Bullock J. S., Kravtsov A. V., Allgood B., 2006, ApJ, 652, 71
- Weinmann et al. (2011) Weinmann S. M., Lisker T., Guo Q., Meyer H. T., Janz J., 2011, MNRAS, 416, 1197
- Weinmann et al. (2012) Weinmann S. M., Pasquali A., Oppenheimer B. D., et al., 2012, MNRAS, 426, 2797
- Wetzel et al. (2013) Wetzel A. R., Tinker J. L., Conroy C., van den Bosch F. C., 2013, MNRAS, 432, 336
- Yang et al. (2003) Yang X., Mo H. J., van den Bosch F. C., 2003, MNRAS, 339, 1057
- Yang et al. (2006) Yang X., Mo H. J., van den Bosch F. C., 2006, ApJL, 638, L55