The Open Cluster Chemical Analysis and Mapping Survey: Local Galactic Metallicity Gradient with APOGEE using SDSS DR10
Abstract
The Open Cluster Chemical Analysis and Mapping (OCCAM) Survey aims to produce a comprehensive, uniform, infrared-based dataset for hundreds of open clusters, and constrain key Galactic dynamical and chemical parameters from this sample. This first contribution from the OCCAM survey presents analysis of 141 members stars in 28 open clusters with high-resolution metallicities derived from a large uniform sample collected as part of the SDSS-III/Apache Point Observatory Galactic Evolution Experiment (APOGEE). This sample includes the first high-resolution metallicity measurements for 22 open clusters. With this largest ever uniformly observed sample of open cluster stars we investigate the Galactic disk gradients of both [M/H] and [/M]. We find basically no gradient across this range in [/M], but [M/H] does show a gradient for kpc and a significant flattening beyond kpc. In particular, whereas fitting a single linear trend yields an [M/H] gradient of dex kpc-1 — similar to previously measure gradients inside 13 kpc — by independently fitting inside and outside 10 kpc separately we find a significantly steeper gradient near the Sun () than previously found ( dex kpc-1) and a nearly flat trend beyond 10 kpc ( dex kpc-1).
Subject headings:
Galaxy: abundances — open clusters and associations: general — Galaxy: evolution — Galaxy: Disk1. INTRODUCTION
A key observable used to constrain galaxy evolution models and often explored in external galaxies is the variation of chemical abundances across galaxy disks. The Milky Way provides the one galaxy where we can study these variations in utmost detail using high resolution spectroscopy. Open clusters have long been used as a key Galactic tracer to probe chemical and age distributions within the Milky Way disk (e.g., Carraro & Chiosi 1994; Janes & Phelps 1994) because they provide the most reliable ‘age-datable’ population tracer at low latitudes. However, as traced by open clusters, the Galactic abundance “gradient” has been fit by a single linear gradient, a 2-function gradient, a polynomial, or a step function. Thus, despite extensive work in this area (e.g., Bragaglia et al. 2008, Sestito et al. 2008, Jacobson et al. 2009, Pancino et al. 2010; Friel et al. 2010, Yong et al. 2012), a clear picture remains elusive, complicated by observational limitations — e.g., inhomogeneous datasets and small statistical samples, both numbers of clusters and stars per cluster (typically only 1-2 stars each). Yong et al. (2012) summarizes the state of the field: “that definitive conclusions await homogeneous analyses of larger samples of stars in larger numbers of clusters. Arguably, our understanding of the evolution of the outer disk from open clusters is currently limited by systematic abundance differences between various studies”
We aim to resolve this problem by analyzing open clusters while taking advantage of a unique, new survey, the Apache Point Observatory Galactic Evolution Experiment (APOGEE; Allende Prieto et al. 2008; Majewski et al. 2010), one of four projects included in the Sloan Digital Sky Survey III (SDSS-III; Eisenstein et al. 2011). APOGEE is an infrared (-band) high-resolution () survey of the Galaxy that, due to its sq. deg. field of view (Gunn et al. 2006), will eventually target stars in the fields of hundreds of open clusters in process of surveying the Galaxy. We will leverage the strength of the APOGEE cluster catalog to probe chemical trends in the Galactic disk and, in particular, the behavior of the abundances as a function of in the transition region between the solar neighborhood and the outer disk, where there remains debate about the slope and even form (e.g., linear or bilinear gradient, polynomial, or “step function”) of the abundance trend (e.g., Corder & Twarog 2001; Chen et al. 2003; Yong et al. 2005; Magrini et al. 2009; Jacobson 2009; Friel et al. 2010).
In this first contribution from the Open Cluster Chemical Analysis and Mapping survey, or “OCCAM” survey we explore the local () Galactic gradients of both [M/H] and [/M] using data from the first of three years of the APOGEE survey.
2. The Open Cluster Chemical Analysis and Mapping (OCCAM) Survey
The OCCAM survey goals are to create a high confidence catalog of cluster age, distance, reddening, abundances based on uniform data, and utilize this sample to make marked improvements to the detailed chemical measurement of the Milky Way disk that will inform models of galaxy evolution. The OCCAM survey will utilize large, uniform, well-calibrated surveys as its basis, starting with infrared (IR) photometry from the Two Micron All-Sky Survey (2MASS; Skrutskie et al. 2006), the Spitzer/IRAC-based Galactic Legacy Infrared Mid-Plane Survey Extraordinaire programs (GLIMPSE-1, -2, -3D, 360; Benjamin et al. 2003), and the Wide-field Infrared Survey Explorer (WISE; Wright et al., 2010), combined with spectroscopy from the SDSS-III/APOGEE survey. APOGEE will provide high precision radial velocities (RVs), stellar parameters (Teff, , [M/H], [C/M], [N/M], [/M]), and eventually detailed abundances for individual elements (Fe, C, N, O, Al, Si, Ca, Ni, Na, S, Ti, Mn, K). These data sets will also be combined with new precision astrometric surveys as they come available (e.g., Pan-STARRS and Gaia; Kaiser et al. 2010; Casertano et al. 1996).
2.1. The APOGEE Survey and SDSS Data Release 10
The tenth data release of the Sloan Digital Sky Survey (Ahn et al. 2013, DR10) provides the first public release of APOGEE data from first light observations in May 2012 through those taken in normal survey mode until July 2012. The spectra extracted using the APOGEE data reduction pipeline, which also measures RVs (in DR10, with typical uncertainties of 150 m s-1; Nidever et al., in prep). The stellar parameters and abundances have been determined using the APOGEE Stellar Parameters and Chemical Abundances Pipeline (ASPCAP; Garcia Perez et al., in prep). ASPCAP is a set of IDL routines and a FORTRAN code called FERRE, which finds the best fit to the observed spectrum based on a minimization from a library of synthetic spectra computed for a large range of stellar parameters and abundances. The DR10 APOGEE database contains the stellar parameters Teff and as well as [M/H], [C/M], [N/M], and [/M] from the ASPCAP matching and interpolation. The verification of ASPCAP was conducted by comparing its results to those of optical high-resolution studies for stars in a set of “calibration” open and globular clusters (Mészáros et al. 2013). The ASPCAP [M/H] provided by FERRE is well-correlated with [Fe/H], as shown in Mészáros et al. (2013).
3. The OCCAM DR10 Sample
3.1. Calibration Open Clusters
Our study includes 6 of the 10 targeted calibration open clusters (M67, NGC 2158, NGC 2420, NGC 6791, NGC 6819, NGC 7789) from Mészáros et al. (2013). We reanalyze their stellar membership and use for them DR10 parameters consistent with those used for the other clusters in our study (§3.2). The calibration stars targeted by APOGEE in these clusters are flagged in the DR10 database by apogee_target2 = 10 (Zasowski et al. 2013).
3.2. “Field” Open Clusters
Because of the large SDSS field of view and the plan for APOGEE to observe all Galactic populations, but with a particular focus on the Galactic disk and bulge, the survey is targeting a large number of open clusters with a relatively small subset of the 300 fibers available per plate. To utilize these fibers efficiently, a new technique was developed to improve the chances of targeting cluster stars in these crowded, highly contaminated, low Galactic latitude fields.
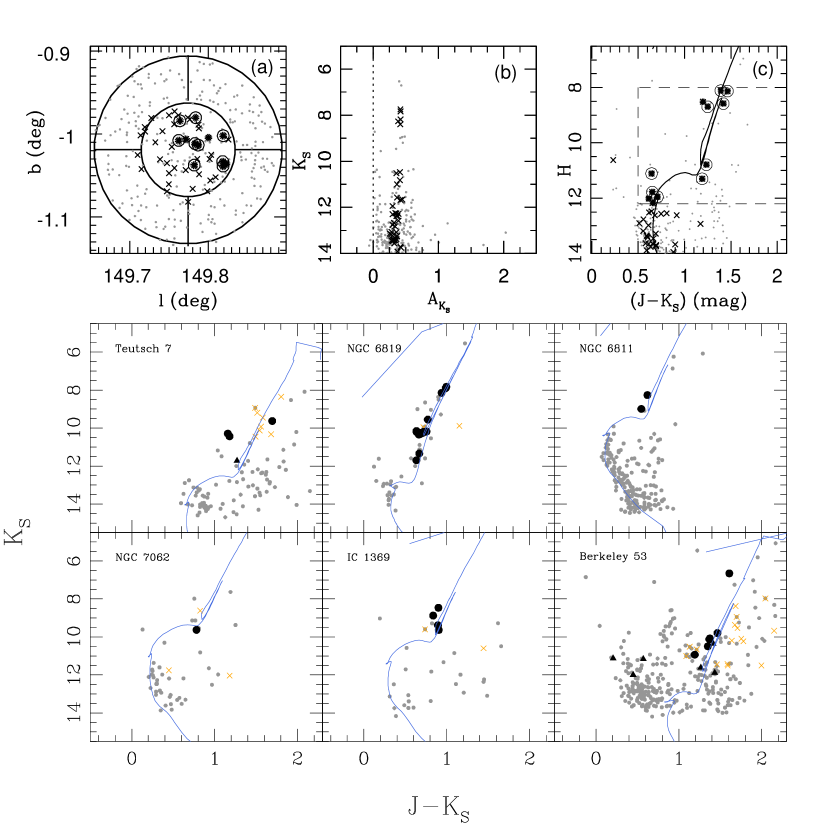
This technique to isolate cluster stars from the general field uses spatial information (color-magnitude comparisons within and outside of the cataloged cluster visual radius, ) combined with filtering by reddening as derived from the Rayleigh-Jeans Color Excess (RJCE) technique (Majewski et al. 2011), which derives star-by-star extinctions () that can be used to remove background and foreground stars This method takes advantage of the fact that all stars have IR 2MASS and Spitzer/IRAC and/or WISE photometry. This IR photometry allows a direct assessment of the line-of-sight reddening to any particular star across wavelengths where the reddening law is nearly universal. At these wavelengths the color effects of reddening and stellar atmospheres are almost completely separable: the long wavelength spectral energy distributions of stars have the same Rayleigh-Jeans shape, equivalent to saying that the Vega-based, intrinsic colors of all stars are nearly constant for the correct combination of filters. Thus, the observed mid-IR colors contain information on the reddening to a star explicitly, whereas the near IR colors contain information on the stellar types. The technique identifies the cluster by maximizing the number of stars within the cluster radius relative to the number “outside” () of the cluster radius for a given range of (). Given the difference of area and the sometimes non-uniform background, we measure the “outside” sample in four areas (Shown in Figure 1a) and then have to normalize the count by the area of sky covered (e.g., sq. degrees)
Stars that are isolated as above and that lie within the APOGEE standard color-magnitude cuts ( and for a standard 3-hr APOGEE field) can then be selected as likely cluster members. For longer length APOGEE fields, fainter stars can also be targeted (down to for a 24-hr field). This cleaning is required in most clusters for two reasons: (1) most open clusters are at low Galactic latitude and hence are heavily contaminated with field stars. (2) Due to the plate scale of the SDSS telescope and the size of the fiber ferrules, the minimum fiber-to-fiber distance is fairly large ( arcmin), which allows for the targeting of only a handful of stars () per cluster for the most distant, reddened clusters, which tend also to be the most poorly studied. This method is more fully described in Frinchaboy et al., in prep and Zasowski et al. (2013). Stars targeted by APOGEE using this method are flagged in the DR10 database by apogee_target1 = 9 (Zasowski et al. 2013).
We present a demonstration of this technique utilizing the cluster King 7, shown in Figure 1. Figure 1a shows the Galactic latitude and longitude area explored by our analysis. As described above, we selected likely cluster members utilizing , as shown in Figure 1b. For King 7, we find a moderate extinction to the cluster. The color-magnitude diagram (CMD) of the cluster shown in Figure 1c highlights the member stars having values within the selected window of extinction, and the dashed box denotes the area of APOGEE’s primary target selection ( and ). Finally, we compare our “cleaned” cluster CMD to the Padova isochrone matching catalog cluster values (Dias et al. 2002) for King 7 and find good agreement. By comparing the CMD with isochrone values, when available, we are able to isolate candidate open cluster stars with a high probability for membership.
3.3. Cluster Membership and Metallicities
To determine cluster membership, we have combined the APOGEE sample with the UCAC-4 (Zacharias et al. 2013) dataset and have used the 3D kinematical membership analysis from Frinchaboy & Majewski (2008) to derive membership probabilities for each star. For this analysis we only use the radial velocity criterion, considering cluster members as those stars with radial velocity membership probabilities %, as many cluster lack stars with UCAC-4 proper motions. For clusters with a single star in the cluster radius, if it was along the Dias et al. (2002, version 3.3) catalog based isochrone fit we assumed it was a member for this study. After determining kinematical membership, a 3 iterative cut was made on the stellar metallicities to further remove any potential non-members.
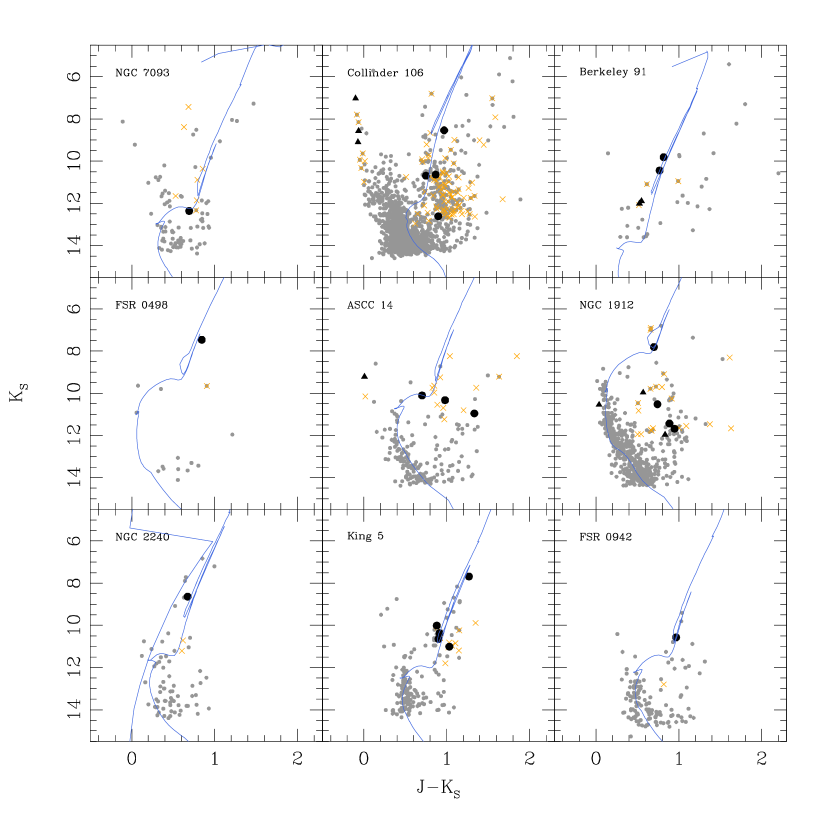
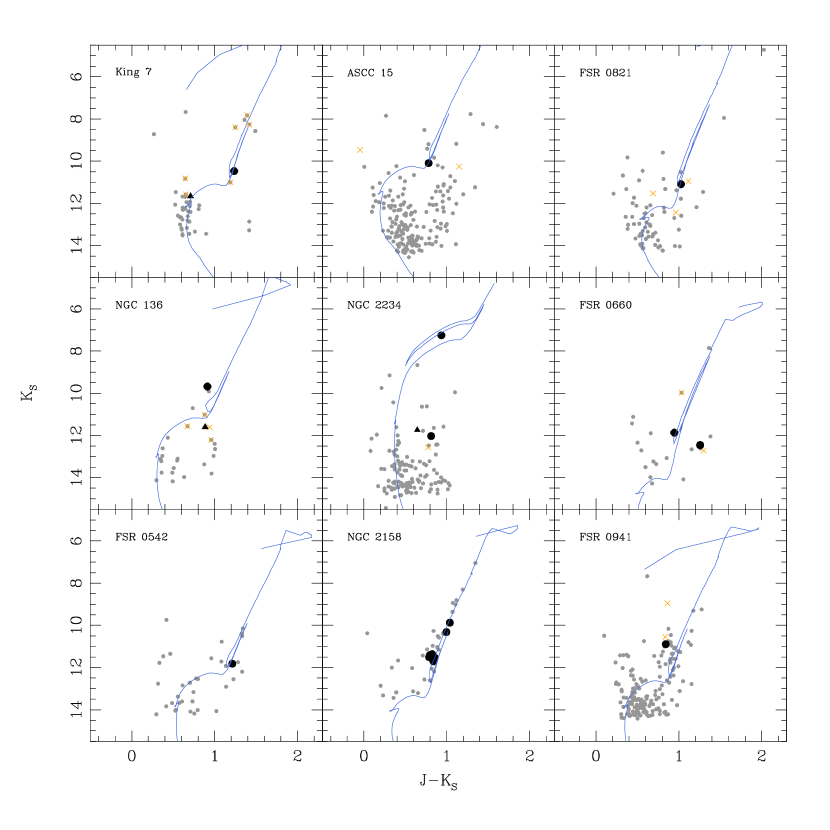
For this paper, we analyze only reliable open clusters, which comprise clusters having member stars that clearly lie near the cluster’s CMD locus (see Figures 1-3), have survey quality data in DR10, and have no ASPCAP warning flags for the analyzed stars (e.g., K and for ). The clusters presented here have a median of three cluster radial velocity members and one member star with reliable [M/H] and [/M]. A fuller description and detailed analysis for all DR10 APOGEE open clusters will be presented in Frinchaboy et al. in prep. Using the RV kinematic membership criteria we analyzed 546 stars, finding 141 member stars, in 28 open clusters whose bulk cluster parameters and metallicities presented in Table 1. For 22 of these clusters, Table 1 presents the first measured high-resolution metallicity. This study increases the number of open clusters with published high-resolution metallicities by about 30%.
After our membership census and after adopting the [M/H] derived from our analysis of the APOGEE data, we refit the CMD by eye with Padova isochrones (Marigo et al. 2008) to measure the other fundamental cluster parameters (age, distance, and reddeneing; Figure 2, blue lines). For most clusters, the Dias et al. (2002; version 3.3) catalog parameters were well fit, with only occasional minor corrections to the reddening required. For those clusters with a poor fit, we updated the parameters based on our refitting. Stars that clearly fall off the isochrone fits (e.g., ASCC 14, NGC 1912, NGC 2234, FSR 660) were excluded from determination of the cluster metallicity. The final cluster parameters used in the latter analysis are presented in Table 1, with updated parameters shown in italics.
| Cluster | Diam |
aaDias et al. (2002) catalog (version 3.3 -
jan/10/2013). Italics denote refitted values and that differ
from Dias et al.
|
DistaaDias et al. (2002) catalog (version 3.3 -
jan/10/2013). Italics denote refitted values and that differ
from Dias et al.
|
aaDias et al. (2002) catalog (version 3.3 -
jan/10/2013). Italics denote refitted values and that differ
from Dias et al.
|
Num. | [M/H] | [/M] | New? | ||
|---|---|---|---|---|---|---|---|---|---|---|
| (’) | (yr) | (kpc) | (kpc) | (kpc) | Memb. | (dex) | (dex) | |||
| Teutsch 7 | 8.0 | 8.48 | 7.070 | 1.33 | 7.97 | 0.07 | 3 | Y | ||
| NGC 6819 | 5.0 | 9.41 | 2.432 | 0.14 | 8.18 | 0.36 | 13 | N | ||
| NGC 6811 | 14.0 | 8.80 | 1.215 | 0.16 | 8.36 | 0.25 | 2 | Y | ||
| NGC 6791 | 10.0 | 9.92 | 5.035 | 0.14 | 8.29 | 0.95 | 29 | N | ||
| NGC 7062 | 5.0 | 8.46 | 2.100 | 0.51 | 8.75 | 0.10 | 1 | Y | ||
| IC 1369 | 5.0 | 8.64 | 2.083 | 0.57 | 8.74 | 0.02 | 4 | Y | ||
| Berkeley 53 | 22.0 | 9.09 | 3.100 | 1.40 | 9.07 | 0.20 | 6 | Y | ||
| NGC 7093 | 9.0 | 8.95 | 3.200 | 0.50 | 9.14 | 0.24 | 1 | Y | ||
| NGC 2682 | 25.0 | 9.45 | 0.792 | 0.04 | 9.06 | 0.42 | 21 | N | ||
| NGC 7789 | 25.0 | 9.15 | 1.795 | 0.28 | 9.41 | 0.17 | 16 | N | ||
| Collinder 106 | 35.0 | 9.90 | 1.000 | 0.40 | 9.41 | 0.01 | 3 | Y | ||
| Berkeley 91 | 3.0 | 9.35 | 4.100 | 0.12 | 9.44 | 0.02 | 2 | Y | ||
| FSR 498 | 1.5 | 8.55 | 1.800 | 0.22 | 9.54 | 0.01 | 1 | Y | ||
| ASCC 14 | 26.4 | 9.00 | 1.100 | 0.60 | 9.59 | 0.02 | 1 | Y | ||
| NGC 1912 | 20.0 | 8.50 | 1.100 | 0.35 | 9.59 | 0.01 | 1 | Y | ||
| NGC 2240 | 11.0 | 9.20 | 1.551 | 0.04 | 10.02 | 0.32 | 1 | Y | ||
| King 5 | 14.2 | 9.10 | 2.230 | 0.67 | 10.38 | 0.17 | 4 | Y | ||
| FSR 942 | 8.0 | 9.00 | 2.000 | 0.80 | 10.44 | 0.13 | 1 | Y | ||
| King 7 | 7.0 | 8.82 | 2.200 | 1.25 | 10.46 | 0.04 | 1 | Y | ||
| NGC 2420 | 5.0 | 9.30 | 2.480 | 0.06 | 10.78 | 0.83 | 11 | N | ||
| ASCC 15 | 24.0 | 8.60 | 2.400 | 0.40 | 10.88 | 0.00 | 1 | Y | ||
| FSR 821 | 9.9 | 8.80 | 2.400 | 0.85 | 10.90 | 0.01 | 1 | Y | ||
| NGC 136 | 4.0 | 8.40 | 5.220 | 0.70 | 12.03 | 0.12 | 1 | Y | ||
| NGC 2234 | 8.0 | 7.70 | 4.800 | 1.00 | 13.18 | 0.24 | 1 | Y | ||
| FSR 660 | 2.6 | 9.22 | 5.126 | 0.79 | 13.19 | 0.05 | 1 | Y | ||
| FSR 542 | 8.0 | 8.50 | 6.600 | 1.10 | 13.53 | 0.04 | 1 | Y | ||
| NGC 2158 | 5.0 | 9.02 | 5.071 | 0.50 | 13.55 | 0.16 | 11 | N | ||
| FSR 941 | 12.0 | 8.70 | 5.800 | 0.70 | 14.17 | 0.08 | 1 | Y |
4. The Galactic Disk Abundance Gradient
Using the large, uniform APOGEE sample, we explore Galactic abundance gradients near and outside the solar circle (; we assume kpc). All clusters in the sample have pc, except NGC 2420 ( pc) and NGC 6791 ( pc). In this contribution, we analyze the Galactic trends in metallicity ([M/H]) and -abundances ([/M]) only.
4.1. [M/H] Trends
Using distances and metallicities from Table 1, we assess Galactic disk metallicity trends, as shown in Figure 4. Fitting a linear trend to our full sample, we find a gradient of dex kpc-1 (see Figure 4 top), which is steeper than, but consistent within the errors of previous gradients derived from literature compilations of open clusters, e.g., dex kpc-1 found by Pancino et al. (2010), Friel et al. (2002), and Friel et al. (2012), and is closer to the gradient found by Yong et al (2012; dex kpc-1 ).
We also investigated an alternate fit by independently fitting inside and outside = 10 kpc, which is near the dynamical signature for Galactic co-rotation (Lépine et al. 2013)). This yields a significantly steeper gradient ( dex kpc-1) near the Sun ( kpc) than previously reported (Figure 3a). This inner gradient is steeper than those previously found, even for “broken”/multi-linear fits — e.g., Yong et al. (2012) measured a gradient of dex kpc-1 for kpc, a similar trend to that from our full sample fit, which covers a similar range.
We find little gradient in our sample beyond kpc ( dex kpc-1), where a plateau of [M/H] appears. This plateau is similar to the flattening found by Yong et al. (2012) for clusters beyond kpc.
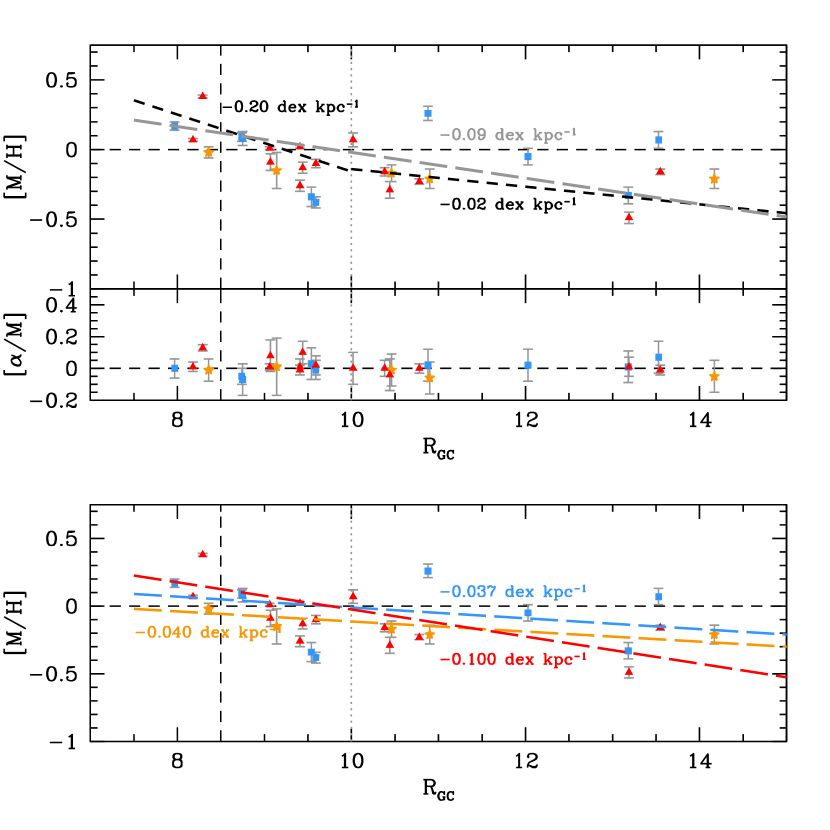
4.2. [/M] Trends
We find little to no trend in [/M] ( dex kpc-1) from analysis of the APOGEE DR10 open cluster sample across the full range of Galactic radius ( kpc, Figure 4 middle). While the sample does not yet include the most distant clusters (e.g., Berkeley 29 and Saurer 1) that have been shown to be -enhanced, we should be able to place further constraints on this trend with data from future APOGEE data releases, which target more distant clusters.
4.3. Time Evolution of the Gradient?
The large age span of our sample allows us to explore dependencies of the gradients with age. We divided the sample into three age bins: nine “young” clusters (), five “intermediate” clusters (), and fourteen “old” clusters (; see Figure 4 bottom). We fit the gradient as a function of using only clusters from each age bin and find similar behavior for the “young” ([M/H] = dex kpc-1) and “intermediate” ([M/H] = dex kpc-1) samples. The “young” sample is small and shows a large scatter, which could be intrinsic, or given that APOGEE is tuned to giant stars these could be due to less reliable parameters (e.g. the star in FSR 542 is near the warning limit in DR10) or that the one star selected could actually be a non-member. The “old” sample shows a slightly steeper gradient ([M/H] = dex kpc-1), which hints that there may be some evolution as a function of age — a shallowing of the gradient with time. We caution against significant interpretation given the limited sampling of the present study. With a larger sample from future APOGEE data releases, we should be able to place tighter constraints on the age trends in the Galactic disk.
5. Conclusions
We describe the first results from the OCCAM collaboration’s exploration of the SDSS-III/APOGEE open cluster data as presented in DR10.
-
1.
The SDSS-III/APOGEE DR10 dataset contains the largest sample of uniformly observed and analyzed high-resolution metallicity measurement of stars in open clusters, (141 member stars in 28 clusters), including the first high-resolution metallicity measurements for 22 open clusters.
-
2.
For this sample of clusters, spanning kpc we find a steep inner [M/H] gradient, dex kpc-1, but a basically flat trend ( dex kpc-1) beyond kpc. This inner gradient is steeper than found by previous measurements (Friel et al. 2010, Yong et al. 2012). The location of the split in these two samples is near the Galactic co-rotation radius, similar to the break in abundance gradient found by Lépine et al. (2013) using Cepheids. This feature may provide a useful constraint for studies of galaxy evolution.
-
3.
We find no significant [/M] trend over kpc. However, other studies that have found a trend toward the outer disk (e.g., Yong et al. 2012) have included more distant clusters than presented here (e.g., Berkeley 29 and Saurer 1 at kpc).
Future OCCAM publications will present the full, detailed analysis of the entire DR10 open cluster sample, including a reanalysis of the clusters’ fundamental parameters (age, distance, and reddening) and additional chemical elements anticipated by the full APOGEE data release DR12 (December 2014).
References
- Ahn et al. (2013) Ahn, C.P., Anderson, S.F., Anderton, T., et al. 2013, ApJ, submitted
- Allende-Prieto et al. (2008) Allende Prieto, C., Majewski, S. R., Schiavon, R., et al. 2008, AN, 329, 1018
- Benjamin et al. (2003) Benjamin, R. A., Churchwell, E., Babler, B.L., et al. 2003, PASP, 115, 953
- Bragaglia et al. (2008) Bragaglia A., Sestito, P., Villanova, S., et al. 2008, A&A, 480, 79
- Carraro & Chiosi (1994) Carraro, G. & Chiosi C. 1994, A&A, 287, 761
- Casertano et al. (1996) Casertano, S., Lattanzi, M. G., Perryman, M. A. C., Spagna, A., Ap&SS, 241, 89
- Chen et al. (2003) Chen, L., Hou, J.L., Wang, J.J. 2003, AJ, 125, 1397
- Corder & Twarog (2001) Corder, S. & Twarog, B.A. 2001, AJ, 122, 895
- Dias et al. (2002) Dias, W.S., Alessi, B.S., Moitinho, A., Lépine, J.R.D. & Alessi, B.S. 2002, A&A, 389, 8718
- Eisenstein et al. (2011) Eisenstein, D.J., Weinberg, D.H., Agol, E., et al. 2011, AJ, 142, 72
- Friel et al. (2002) Friel, E.D., Janes, K.A., Tavarez, M., et al. 2002, AJ, 124, 2693
- Friel et al. (2010) Friel, E.D., Jacobson, H.R., Pilachowski, C.A. 2010, AJ, 139, 1942
- Frinchaboy & Majewski (2008) Frinchaboy, P.M. & Majewski, S. R. 2008, AJ, 136, 188
- Gunn et al. (2006) Gunn, J.E., Siegmund, W.A., Mannery, E.J., et al. 2006, AJ, 131, 2332
- Harris (1996) Harris, W.E. 1996, AJ, 112, 1487
- Jacobson et al. (2009) Jacobson, H.R., Friel, E.D., Pilachowski, C.A. 2009, AJ, 137, 4753
- Janes & Phelps (1994) Janes, K.A. & Phelps.R.L. 1994, AJ, 108, 1773
- Kaiser et al. (2010) Kaiser, N., Burgett, W., Chambers, K., et al. 2010, SPIE, 7773, 12
- Lépine et al. (2013) Lépine, J.R.D., Andrievky, S., Barros, D.A., Junqueira, T.C., Scarano, S. 2013, Proceedings of IAU Symposium 298 (arXiv:1307.7781)
- Magrini et al. (2009) Magrini, L., Sestito, P., Randich, S., Galli, D. 2009, A&A, 494, 95
- Majewski et al. (2010) Majewski, S.R., Wilson, J.C., Hearty, F., Schiavon, R.R., Skrutskie, M.F. 2010, IAU Symposium, 265, 480
- Majewski et al. (2011) Majewski, S.R., Zasowski, G., & Nidever, D.L. 2011, ApJ,
- Mészáros et al. (2012) Mészáros, Sz., Allende Prieto, C., Edvardsson, B., et al. 2012, AJ, 144, 120
- Mészáros et al. (2013) Mészáros, Sz., Holtzman, J., García Pérez, A.E., et al. 2013, AJ, submitted
- Pancino et al. (2010) Pancino, E., Carrera, R., Rossetti, E., Gallart, C. 2010, A&A, 511, A56
- Sestito et al. (2008) Sestito, P., Bragaglia, A., Randich, S., et al. 2006, A&A, 458, 121
- Skrutskie et al. (2006) Skrutskie, M. F., Cutri, R. M., Stiening, R., et al. 2006, AJ, 131, 1163
- Wright et al. (2010) Wright, E.L., Eisenhardt, P.R.M., Mainzer, A., et al. 2010, AJ, 140, 1868
- Yong et al. (2005) Yong, D., Carney, B. & de Almeida, M.L.T. 2005, AJ, 130, 597
- Yong et al. (2012) Yong, D., Carney, B.W., Friel, E.D. 2012, AJ, 144 95
- Zachariaset al. (2013) Zacharias, N., Finch, C.T., Girard, T.,M., et al. 2013, AJ, 145, 44
- Zasowski et al. (2013) Zasowski, G., Johnson, J.A., Frinchaboy, P.M., et al. 2013, AJ, in press