Magnetization of SrCu2(BO3)2 in ultrahigh magnetic fields up to 118 T
Abstract
The magnetization process of the orthogonal-dimer antiferromagnet SrCu2(BO3)2 is investigated in high magnetic fields of up to 118 T. A 1/2 plateau is clearly observed in the field range 84 to 108 T in addition to 1/8, 1/4 and 1/3 plateaux at lower fields. Using a combination of state-of-the-art numerical simulations, the main features of the high-field magnetization, a 1/2 plateau of width 24 T, a 1/3 plateau of width 34 T, and no 2/5 plateau, are shown to agree quantitatively with the Shastry-Sutherland model if the ratio of inter- to intra-dimer exchange interactions . It is further predicted that the intermediate phase between the 1/3 and 1/2 plateau is not uniform but consists of a 1/3 supersolid followed by a 2/5 supersolid and possibly a domain-wall phase, with a reentrance into the 1/3 supersolid above the 1/2 plateau.
pacs:
75.10.Jm; 75.60.Ej; 75.40.MgGeometrical frustration can induce very interesting phases in quantum magnets Lacroix et al. (2011). For instance, the orthogonal dimer antiferromagnet SrCu2(BO3)2 exhibits fascinating phenomena due to frustration. The nearest neighbor (NN) =1/2 spins of Cu ions are antiferromagnetically coupled and form singlet dimers through the exchange interaction . Since the inter-dimer exchange interaction between the next nearest-neighbor (NNN) Cu ions is antiferromagnetic as well, the orthogonal configuration induces geometrical frustration Kageyama et al. (1999). Quite remarkably, the crystal lattice is topologically equivalent to the Shastry-Sutherland lattice that was initially investigated out of pure theoretical interest Shastry and Sutherland (1981). Since its discovery, SrCu2(BO3)2 has thus logically been the subject of a vast number of experimental and theoretical studies Miyahara and Ueda (2003); Takigawa et al. (2010); Takigawa and Mila (2011).
Quantum phase transitions have been theoretically predicted to take place when the ratio is tuned. It is clear that the ground state is a product of dimer singlets if , and that it supports antiferromagnetic Néel order when . An intermediate gapped plaquette phase has been predicted to appear Koga and Kawakami (2000); Takushima et al. (2001); Chung et al. (2001); Läuchli et al. (2002) when Lou et al. (2012); Corboz and Mila (2013). SrCu2(BO3)2 is believed to be located at , thus to have an exact dimer singlet ground state Miyahara and Ueda (2003); Takigawa et al. (2010).
In addition to the interest raised by the exotic ground state of the Shastry-Sutherland model, the presence of several magnetization plateaux in SrCu2(BO3)2 has attracted significant attention. Distinct 1/8, 1/4, and 1/3 plateaux have been reported early on in the magnetization process Kageyama et al. (1999); Onizuka et al. (2000). More recently, additional plateaux between 1/8 and 1/4 have been observed Sebastian et al. (2008); Takigawa et al. (2013), and evidence in favor of the presence of the long predicted 1/2 plateau has been provided by magnetostriction measurements Jaime et al. (2012). However, the entire 1/2 plateau phase has not been unveiled in Ref. Jaime et al., 2012 because of the technical upper limit of the magnetic field at 100.75 T.
The 1/2 plateau has been predicted to be less stable than the 1/3 plateau and to disappear for large Momoi and Totsuka (2000). In fact, according to Ref. Miyahara and Ueda, 2000, the length of the 1/2 plateau is less than half that of the 1/3 plateau, although the 1/2 plateau can be expected to be quite stable considering the checkerboard pattern of the triplet excitation suggested by the boson picture. Hence, the experimental determination of the stability range of the 1/2 plateau is of particular interest in itself, and also important for checking the validity of the theoretical model. Moreover, in addition to the 1/2 plateau, exotic high-field spin states have been predicted such as supersolid phases between the 1/3 and 1/2 plateaux and above the 1/2 plateau Momoi and Totsuka (2000); Lou et al. (2012). The quantum spin state realized when the density of triplets becomes very high has not been uncovered yet.
In the present work, we have investigated the spin states of SrCu2(BO3)2 by magnetization measurements in high magnetic fields up to 118 T. A clear 1/2 magnetization plateau phase has been observed in the field range from 84 to 108 T, and at the upper critical field, a sharp magnetization increase suggests a first-order phase transition. Theoretical calculations based on the infinite projected entangled-pair state (iPEPS) tensor network algorithm Verstraete and Cirac (2004); Jordan et al. (2008); Corboz et al. (2010, 2011); Bauer et al. (2011), exact diagonalizations, density-matrix renormalization group (DMRG) simulations and series expansions have shown that the 1/2 and 1/3 plateaux can be quantitatively reproduced by the Shastry-Sutherland model with a ratio , and they predict a variety of exotic phases between the 1/3 and 1/2 plateaux and above the 1/2 plateau, including several types of supersolid phases, in particular a first-order transition to a 1/3 supersolid above the upper critical field of the 1/2 plateau.
Experimental procedure.—
A single crystal of SrCu2(BO3)2 was used for the experiment. Pulsed magnetic fields of up to 118 T were generated by a destructive method; the vertical-type single-turn coil technique Takeyama et al. (2012) was used. The field was applied parallel to the -axis of the crystal. The magnetization () was measured using a pickup coil that consists of two small coils (1 mm diameter, 1.4 mm length for each). The two coils have different polarizations and are connected in series. The sample is inserted into one of the coils. An induction voltage proportional to the time derivative of () is obtained when the sample gets magnetized by a pulsed magnetic field , where is the time. The induction voltage due to is almost canceled out between the opposite polarization coils. The detailed experimental setup for the magnetization measurement using this vertical type single-turn coil method has been described elsewhere Takeyama et al. (2012). A liquid helium bath cryostat with the tail part made of plastic has been used; the sample was immersed in liquid helium and a measurement temperature of about 2 K has been reached by reducing the vapor pressure.
Experimental results.—
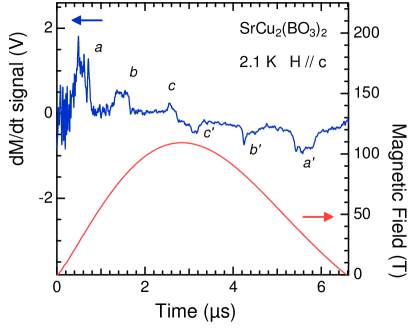
The pickup coil signal proportional to is shown as a function of time in Fig. 1 together with the magnetic field waveform. The obtained maximum field is 109 T and we name this experiment Shot-A in this paper. Distinct peak structures denoted by labels , , , , and are present in . They correspond to magnetization jumps at the phase boundaries of different spin states. Indeed, a stepwise magnetization increase gives rise to a peak in curve, and the peak is positive (negative) for increasing (decreasing) field. The one to one correspondence between and , and , and and indicates that stepwise transitions take place at these magnetic fields for both field-increasing and decreasing processes without significant hysteresis.
The magnetization curve is obtained by a numerical integration of ; the resulting magnetization is normalized by the expected saturation magnetization . The magnetic field derivative of the magnetization is obtained from the ratio .
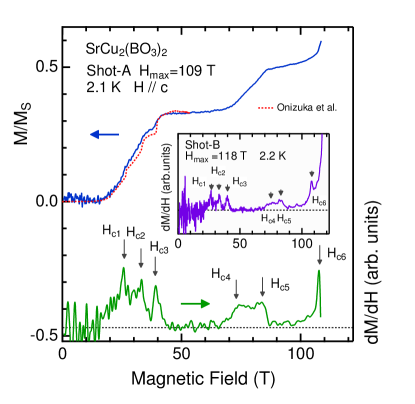
Figure 2 shows the magnetization process and the magnetic field dependence of at 2.1 K (Shot-A). We also show for comparison the magnetization up to 55 T previously reported in Ref. Onizuka et al., 2000, and the agreement is good. In the present work, we only analyze the result of the field-increasing process because the magnetic field is less homogeneous for the field decreasing process due to the mechanical deformation of the single-turn coil and to the background non-linear offset of the signal which disturbs the precise measurement Takeyama et al. (2012). The curve shows clear peaks labeled () : are attributed to structure in Fig. 1, to structure , and to structure .
We show the curve obtained from another experiment up to 118 T (Shot-B) in the inset of Fig. 2. The upward behavior at high fields over 100 T is due to the increase of the background noise: the noise becomes relatively larger near the top of the magnetic field curve because the signal becomes small when is small. Although the background noise makes it difficult to obtain a very precise magnetization curve by a numerical integration for Shot-B, peaks in are clearly observed at nearly identical values as for Shot-A. The obtained peak fields are shown in Table 1.
| Shot-A | 26 | 33 | 39 | 73 | 84 | 108 |
|---|---|---|---|---|---|---|
| Shot-B | 27 | 33 | 40 | 75 | 83 | 108 |
The peaks at , , and are attributed to the magnetization jumps at fields where the spin state enters 1/8, 1/4, and 1/3 plateau phases, respectively. Additional features probably related to extra plateaux Takigawa et al. (2013) are also present between and , but steady field measurements are more accurate in that field range, and we will not attempt to discuss them. While the measurement temperature 2.1 K seems to be too high to observe the 1/8 plateau Kodama et al. (2002) the adiabatic cooling owing to the first sweep speed of the magnetic field leads to an actual temperature lower than 0.5 K Levy et al. (2008). In the magnetization curve, the 1/3 plateau is observed in the field range from 39 to 73 T for Shot-A. Here note that we calibrate the absolute value of using the magnetization at the 1/3 plateau phase. The field region for the 1/3 plateau is in good agreement with the previous reports Onizuka et al. (2000); Sebastian et al. (2008).
After the 1/3 plateau, there is a change of slope around 74 T. Above that critical field , there is an almost smooth increase of the magnetization, followed by the appearance of the 1/2 plateau at around . Note however that a trapezoid or broad flap-top peak is expected if the slope increase was monotonous and had no anomaly. Since a peak structure is clearly observed both in up and down sweeps between the 1/3 and 1/2 plateau (see in particular feature in down sweep), some kind of transition probably takes place between the 1/3 and 1/2 plateaux.
The 1/2 plateau starts at 84 T and continues up to 108 T. The starting magnetic field seems to be slightly higher compared to the previously reported value around 82 T detected by magnetostriction Jaime et al. (2012). This might be partly due to the different ways of detection (magnetostriction versus magnetization), and also to the experimental uncertainty in the present work (the error of the absolute value of the magnetic field is within 3%). The magnetic field absolute value of the single-turn coil method contains a few percent experimental error owing to the technical limit of the precision Takeyama et al. (2012). However, even if there is an error bar on the absolute value of the magnetic field, the relative change in the field value has a smaller error bar. Hence it is safe to conclude that the plateau length of the 1/2 plateau T is considerably shorter than that of 1/3 plateau T. At higher fields, considering the appearance of a sharp peak , a first-order magnetic phase transition is expected to occur after the 1/2 plateau at a field of 108 T.
Theory.—
A good starting point to describe the magnetization process of SrCu2(BO3)2 is provided by the spin-1/2 Heisenberg model on the Shastry-Sutherland lattice defined by:
| (1) |
where the bonds with coupling build an array of orthogonal dimers while the bonds with coupling denote inter-dimer couplings. While a lot of effort has been devoted in the past to the magnetization curve up to Dorier et al. (2008); Abendschein and Capponi (2008); Nemec et al. (2012), in the range where a sequence of plateaux has been reported, comparatively little attention has been paid so far to the magnetization curve above . Shortly after the discovery of plateaux in SrCu2(BO3)2, Momoi and Totsuka Momoi and Totsuka (2000) have predicted the presence of and plateaux separated by supersolid phases. This prediction has been left unchallenged until the recent investigation of magnetostriction in very high field Jaime et al. (2012). These measurements have revealed the presence of an anomaly above the plateau that has been interpreted as a plateau, an interpretation backed by a DMRG (density matrix renormalization group) calculation at . However, a recent tensor-network calculation based on MERA (multi-scale entanglement renormalization ansatz) has just confirmed the presence of and plateaux without any evidence of a plateau Lou et al. (2012).
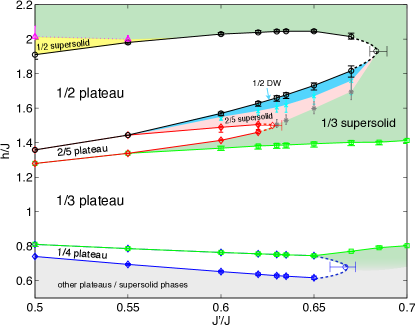
In view of the importance of this issue for the interpretation of the present results, we have decided to reinvestigate the high-field magnetization process of the Shastry-Sutherland model with a variety of state-of-the-art numerical approaches: exact diagonalizations of finite-size clusters up to 40 spins, DMRG on clusters of size up to spins, high-order series expansions, and iPEPS – a tensor network method for two-dimensional systems in the thermodynamic limit. The various methods yield a rather consistent picture (see supplemental material for a detailed comparison). The most complete phase diagram, shown in Fig. 3, has been obtained with iPEPS. Above the plateau, it consists of two additional plateaux at and , three supersolid phases with the symmetries of the , and plateaux, and a phase with domain walls separating regions of plateau structures. Note that we confirm the presence of a 2/5 plateau for , in agreement with the DMRG results of Ref. Jaime et al., 2012.
For our present purpose, the most important messages of this phase diagram are: i) The 1/2 plateau does not extend beyond a critical value of the order of , in qualitative agreement with Momoi and Totsuka Momoi and Totsuka (2000); ii) The plateau does not extend beyond . Since the present experimental data do not reveal any evidence of a plateau but show a rather broad plateau, can neither be too large nor too small, and a comparison of the critical fields of the and plateaux with the experimental ones point to a ratio .
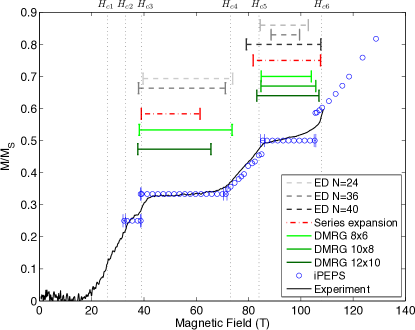
A detailed comparison of the experimental magnetization curve with the theoretical predictions of the various methods at above the 1/4 plateau is shown in Fig. 4. First of all, the critical fields to are accurately reproduced by iPEPS. The predictions of the other methods are scattered around the iPEPS values, but altogether they support the main features of the iPEPS results (for a detailed comparison as a function of , see supplemental material). Secondly, the magnetization jumps at and , which point to first-order transitions, are well accounted for by the theoretical results: at , there is a first-order transition between the 1/4 and 1/3 plateau, while at , there is one between the 1/2 plateau and the 1/3 supersolid. The smoother transitions at and also correspond to much weaker anomalies in the theoretical results. For the upper boundary of the 1/3 plateau, series expansions point to a gap closing when increasing , hence to a second order phase transition, around T, significantly below . This is not incompatible with the broad onset of magnetization around , with a slope that takes off around T in shot-A and T in shot-B. Below the lower boundary of the 1/2 plateau at , iPEPS predicts a series of first order phase transitions from a 1/3 supersolid to a 2/5 supersolid, then to a phase with domain walls, and then finally to the 1/2 plateau. In the magnetization curve, these transitions translate into small jumps. This is presumably related to the peak observed in both shots around T, i.e., between the 1/3 and 1/2 plateaux, consistent with the prediction that the intermediate field range between these plateaux is not a single phase.
Finally, let us comment on the experimental slope of the 1/2 plateau between and , which is anomalously large as compared, e.g., to that of the 1/3 plateau. This slope is definitely too large to be due to Dzyaloshinskii-Moriya interactions, but it might be simply explained as a temperature effect. Indeed, the difference in energy per spin between the 1/2 plateau and the competing 1/3 supersolid state obtained with iPEPS is very small ( ), whereas the competing phases are definitely higher in the middle of the 1/3 plateau.
Conclusion.—
To summarize, we have performed ultra-high field measurements of the magnetization of SrCu2(BO3)2, revealing for the first time the extent of the 1/2 plateau. The length of the 1/2 plateau has been found to be around 70% of that of the 1/3 plateau. We have not found any indication of the 2/5 plateau that was previously suggested on the basis of magnetostriction measurements. As revealed by large-scale numerical simulations, these results are consistent with the Shastry-Sutherland model provided the ratio of inter to intra-dimer coupling is neither too small, in agreement with recent results on Zn doped samples Yoshida et al. , nor too large, the best agreement being reached for a ratio of about . These numerical simulations further predict that the magnetization between the 1/3 and 1/2 plateau and above the 1/2 plateau is not uniform, but that the system is always in a phase that breaks the translational symmetry, either to form a supersolid, or because of the spontaneous appearance of domain walls in the 1/2 plateau phase. It would be very interesting to test this prediction with measurements that can detect a change of lattice symmetry such as X-rays or neutrons, or with a local probe such as NMR. Given the field range of interest, this is however a huge experimental challenge.
Acknowledgement.—
Y. H. M. thanks M. Takigawa for fruitful discussions. A. H. and P. C. acknowledge support through FOR1807 (DFG / SNSF). We acknowledge allocation of CPU time at the HLRN Hannover. The iPEPS simulations have been performed on the Brutus cluster at ETH Zurich.
References
- Lacroix et al. (2011) C. Lacroix, P. Mendels, and F. Mila, eds., Introduction to Frustrated Magnetism, Springer Series in Solid-State Sciences, Vol. 164 (Springer Berlin Heidelberg, 2011).
- Kageyama et al. (1999) H. Kageyama, K. Yoshimura, R. Stern, N. V. Mushnikov, K. Onizuka, M. Kato, K. Kosuge, C. P. Slichter, T. Goto, and Y. Ueda, Phys. Rev. Lett. 82, 3168 (1999).
- Shastry and Sutherland (1981) B. S. Shastry and B. Sutherland, Physica B+C 108, 1069 (1981).
- Miyahara and Ueda (2003) S. Miyahara and K. Ueda, J. Phys.: Condens. Matter 15, R327 (2003).
- Takigawa et al. (2010) M. Takigawa, T. Waki, M. Horvatić, and C. Berthier, J. Phys. Soc. Jpn. 79, 011005 (2010).
- Takigawa and Mila (2011) M. Takigawa and F. Mila, Introduction to Frustrated Magnetism: Materials, Experiments, Theory, Chapter 10, edited by C. Lacroix, P. Mendels, and F. Mila (Springer Series in Solid-State Sciences, 2011).
- Koga and Kawakami (2000) A. Koga and N. Kawakami, Phys. Rev. Lett. 84, 4461 (2000).
- Takushima et al. (2001) Y. Takushima, A. Koga, and N. Kawakami, J. Phys. Soc. Jpn 70, 1369 (2001).
- Chung et al. (2001) C. H. Chung, J. B. Marston, and S. Sachdev, Phys. Rev. B 64, 134407 (2001).
- Läuchli et al. (2002) A. Läuchli, S. Wessel, and M. Sigrist, Phys. Rev. B 66, 014401 (2002).
- Lou et al. (2012) J. Lou, T. Suzuki, K. Harada, and N. Kawashima, Preprint (2012), arXiv:1212.1999v1 .
- Corboz and Mila (2013) P. Corboz and F. Mila, Phys. Rev. B 87, 115144 (2013).
- Onizuka et al. (2000) K. Onizuka, H. Kageyama, Y. Narumi, K. Kindo, Y. Ueda, and T. Goto, J. Phys. Soc. Jpn. 69, 1016 (2000).
- Sebastian et al. (2008) S. E. Sebastian, N. Harrison, P. Sengupta, C. D. Batista, S. Francoual, E. Palm, T. Murphy, N. Marcano, H. A. Dabkowska, and B. D. Gaulin, PNAS 105, 20157 (2008).
- Takigawa et al. (2013) M. Takigawa, M. Horvatić, T. Waki, S. Krämer, C. Berthier, F. Lévy-Bertrand, I. Sheikin, H. Kageyama, Y. Ueda, and F. Mila, Phys. Rev. Lett. 110, 067210 (2013).
- Jaime et al. (2012) M. Jaime, R. Daou, S. A. Crooker, F. Weickert, A. Uchida, A. E. Feiguin, C. D. Batista, H. A. Dabkowska, and B. D. Gaulin, PNAS 109, 12404 (2012).
- Momoi and Totsuka (2000) T. Momoi and K. Totsuka, Phys. Rev. B 62, 15067 (2000).
- Miyahara and Ueda (2000) S. Miyahara and K. Ueda, Phys. Rev. B 61, 3417 (2000).
- Verstraete and Cirac (2004) F. Verstraete and J. I. Cirac, Preprint (2004), arXiv:cond-mat/0407066 .
- Jordan et al. (2008) J. Jordan, R. Orús, G. Vidal, F. Verstraete, and J. I. Cirac, Phys. Rev. Lett. 101, 250602 (2008).
- Corboz et al. (2010) P. Corboz, R. Orús, B. Bauer, and G. Vidal, Phys. Rev. B 81, 165104 (2010).
- Corboz et al. (2011) P. Corboz, S. R. White, G. Vidal, and M. Troyer, Phys. Rev. B 84, 041108 (2011).
- Bauer et al. (2011) B. Bauer, P. Corboz, R. Orús, and M. Troyer, Phys. Rev. B 83, 125106 (2011).
- Takeyama et al. (2012) S. Takeyama, R. Sakakura, Y. H. Matsuda, A. Miyata, and M. Tokunaga, J. Phys. Soc. Jpn. 81, 014702 (2012).
- Kodama et al. (2002) K. Kodama, M. Takigawa, M. Horvatić, C. Berthier, H. Kageyama, Y. Ueda, S. Miyahara, F. Becca, and F. Mila, Science 298, 395 (2002).
- Levy et al. (2008) F. Levy, I. Sheikin, C. Berthier, M. Horvatić, M. Takigawa, H. Kageyama, T. Waki, and Y. Ueda, Europhys. Lett. 81, 67004 (2008).
- Dorier et al. (2008) J. Dorier, K. P. Schmidt, and F. Mila, Phys. Rev. Lett. 101, 250402 (2008).
- Abendschein and Capponi (2008) A. Abendschein and S. Capponi, Phys. Rev. Lett. 101, 227201 (2008).
- Nemec et al. (2012) M. Nemec, G. R. Foltin, and K. P. Schmidt, Phys. Rev. B 86, 174425 (2012).
- (30) M. Yoshida et al., unpublished .