11email: gupta@astron.nl 22institutetext: IUCAA, Post Bag 4, Ganeshkhind, Pune 411007, India 33institutetext: UPMC-CNRS, UMR7095, Institut d’Astrophysique de Paris, F-75014 Paris, France
21-cm absorption from galaxies at
We report the detection of 21-cm absorption from foreground galaxies towards quasars, specifically =0.3120 towards SDSS J084957.97+510829.0 (=0.584; Pair-I) and =0.3714 towards SDSS J144304.53+021419.3 (=1.82; Pair-II). In both the cases, the integrated 21-cm optical depth is consistent with the absorbing gas being a damped Lyman- (DLA) system. In the case of Pair-I, strong Na i and Ca ii absorption lines are also detected at in the QSO spectrum. We identify an early-type galaxy at an impact parameter of 14 kpc whose photometric redshift is consistent with that of the detected metal and 21-cm absorption lines. This would be the first example of an early-type galaxy associated with an intervening 21-cm absorber. The gas detected in 21-cm and metal absorption lines on the outskirts of this luminous red galaxy could be associated with the reservoir of cold H i gas with a low level of star formation activity in the outer regions of the galaxy as reported in the literature for 0.1 early-type galaxies. In the case of Pair-II, the absorption is associated with a low surface brightness galaxy that, unlike most other known quasar-galaxy pairs (QGPs), i.e. QSO sight lines passing through disks or halos of foreground galaxies, is identified only via narrow optical emission lines detected on top of the QSO spectra. Using SDSS spectra we infer that the emission lines originate within 5 kpc of the QSO sight line, and the gas has metallicity [12+O/H8.4 and star formation rate0.7-0.8 M⊙ yr-1. The measured 21-cm optical depth can be reconciled with the (H i) we derive from the measured extinction (AV=0.6) if either the H i gas is warm or the extinction per hydrogen atom in this galaxy is much higher than the mean value of the Small Magellanic Cloud. Finally, using a sample of 9 QGPs with 21-cm absorption detection from our observations and literature, we report a weak anti-correlation (Spearman rank, =-0.3) between the 21-cm optical depth and galaxy impact parameter. Milliarcsecond scale images and spectra are required to understand the implications of this.
Key Words.:
quasars: absorption lines – galaxies: evolution – galaxies: ISM – galaxies: star formation.1 Introduction
It is well known that physical conditions in the diffuse interstellar medium (ISM) of galaxies are influenced by various radiative and mechanical feedback processes associated with in-situ star formation (e.g., Wolfire et al. 2003). Therefore, volume-filling factors of different phases of gas in a galaxy are expected to depend on its star formation history. Of particular interest is the evolution of the volume-filling factor of cold neutral medium (CNM) phase that also serves as a gaseous reservoir for star formation in galaxies. It is expected to contain an imprint of the collective outcome of all the processes that shape the star formation history of the Universe (e.g., Hopkins & Beacom 2006). Systematic searches of high- intervening 21-cm absorbers in samples of Mg ii systems and damped Ly systems (DLAs) towards QSOs to measure CNM filling factor of galaxies have resulted in detections of 21-cm absorption towards 10-20% of Mg ii systems (e.g., Briggs & Wolfe 1983; Lane 2000; Gupta et al. 2009; Kanekar et al. 2009; Gupta et al. 2012) and DLAs (e.g., Kanekar & Chengalur 2003; Curran et al. 2010; Srianand et al. 2012). However, establishing a connection between the redshift evolution of 21-cm absorbers and global star formation rate density is not straight forward due to (i) small number statistics of 21-cm absorbers, (ii) ambiguities regarding the origin of absorbing gas (i.e., gaseous disk, halo or outflowing/infalling gas etc.) and (iii) issues related to the small scale structure in absorbing gas and the extent of radio source.
Blind searches of 21-cm absorption with Square Kilometre Array (SKA) pathfinders in the near future are expected to significantly increase the number of intervening 21-cm absorbers over a wide redshift range. To understand the nature of absorbers detected from these, it is important to establish a link between the properties of galaxies and intervening 21-cm absorbers, and address issues related to points (ii) and (iii) mentioned above. At present, both these points are best addressed at where it is possible to determine properties of absorbing gas on pc and kpc scales via arcsecond and milliarcsecond scale spectroscopy, and detect the galaxy responsible for absorption in 21-cm and various optical emission lines. However, almost all the intervening 21-cm absorption line searches until now have happened at 0.2. The notable exceptions in the recent past are Gupta et al. (2010), Borthakur et al. (2011), and Darling et al. (2011) (see also Carilli & van Gorkom 1992). The first two are based on samples of QSO sight lines passing through disks or halos of foreground galaxies, which we henceforth refer to as quasar-galaxy pairs (QGPs), whereas the last is a blind search for 21-cm absorption at using the Arecibo telescope. All three have detected one 21-cm absorber each and showcase difficulties in detecting 21-cm absorbers at low- in the absence of large catalogs of Mg ii systems and DLAs.
To move forward, we are systematically searching the Sloan Digital Sky Survey (SDSS) for QGPs with angular separation 10′′ and background quasar flux density 100 mJy in the Faint Images of the Radio Sky at Twenty-Centimeters (FIRST) catalog. The objective is to search for 21-cm absorption in QGPs with impact parameter 30 kpc and systematically increase the number of low- intervening 21-cm absorbers/DLAs. This sample of low- absorbers can then be used as a comparison sample to understand the nature of high- 21-cm absorbers and DLAs (see Krogager et al. 2012 and references therein for the current status of DLA host galaxies). In this paper, we report the detection of 21-cm absorption from two foreground galaxies at 0.3 towards quasars SDSS J084957.97+510829.0 (=0.584, hereafter J0849+5108) and SDSS J144304.53+021419.3 (=1.82, hereafter J1443+0214). These two pairs with foreground galaxies at were identified while scanning the SDSS images and spectra of bright radio sources and are interesting in their own right. In both these cases, the measured 21-cm optical depth is consistent with the absorbing gas being a DLA. The nature of background radio source in the case of QGP J0849+5108 has been the subject of considerable debates and is suspected of being affected by foreground galaxy lensing. The quasar sight line is positioned close to a pair of low- (0.07) interacting spiral galaxies, and the field contains many bright galaxies within 60′′ of the quasar (Stickel et al. 1989). The sight line has been previously searched for 21-cm and molecular absorption lines (Boisse et al. 1988; Wiklind & Combes 1995; Gupta et al. 2010).
The QGP J1443+0214 differs in the way it has been identified. Unlike most other QGPs studied to date, this QGP is identified by the novel technique of detecting emission lines from a foreground galaxy in the spectra of QSOs (see e.g., Noterdaeme et al. 2010b; York et al. 2012). The foreground galaxy is otherwise invisible in this case. In Section 2, we present details of our observations. We then detail the properties of individual QGPs in Section 3. In Section 4, we discuss implications of our results. Throughout this paper we use the CDM cosmology with =0.27, =0.73, and Ho=71 km s-1 Mpc-1.
2 Radio observations
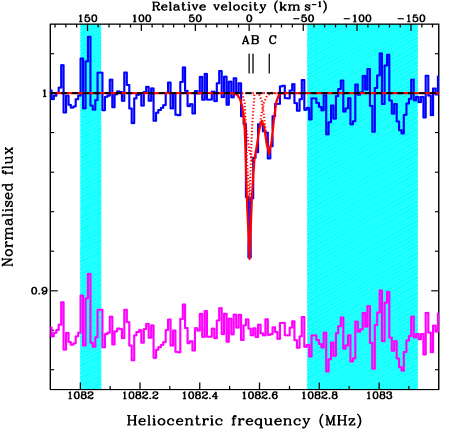
Both the pairs were observed with Giant Metrewave Radio Telescope (GMRT) using a baseband bandwidth of 4.17 MHz split into 512 spectral channels (resolution2.3 km s-1) centered on the redshifted 21-cm frequency of foreground galaxies. The QGP J0849+5108 was observed on 2011 July 18 (2.7 hrs on source) and J1443+0214 on 2012 June 2 (5.7 hrs on source). Standard calibrators were regularly observed during the observations for flux density, bandpass, and phase calibrations. The data were reduced using the Astronomical Image Processing System (AIPS) following standard procedures as in Gupta et al. (2010). Both the quasars are represented well by a single Gaussian component, i.e. unresolved in our GMRT images that have spatial resolution of 43′′. The flux densities of J0849+5108 and J1443+0214 were measured to be 245 mJy and 163 mJy, and spectral rms to be 2.0 mJy beam-1 channel-1 and 0.9 mJy beam-1 channel-1, respectively. In both cases, we detected 21-cm absorption consistent with the redshift of the foreground galaxy. In the case of J0849+5108, a few frequency channels on either side of the detected absorption feature were found to be affected by RFI (see shaded regions in Fig. 1). We therefore reobserved this QGP on 2012 July 3 (3.5 hrs on source) to confirm the absorption. The flux density of the quasar was measured to be 221 mJy, i.e. 10% lower than the value measured in the first observing run. The velocity shift due to heliocentric motion of the Earth between the two observing runs on this QGP is 5.6 km s-1. The repeat observation reproduced the previously detected absorption feature at the expected frequency. This confirms the reality of the absorption. The spectrum presented in Fig. 1 is obtained by the inverse-rms-square weighted average of the normalized spectra obtained from two observing runs. The 21-cm absorption spectrum towards J1443+0214 is presented in Fig. 2.
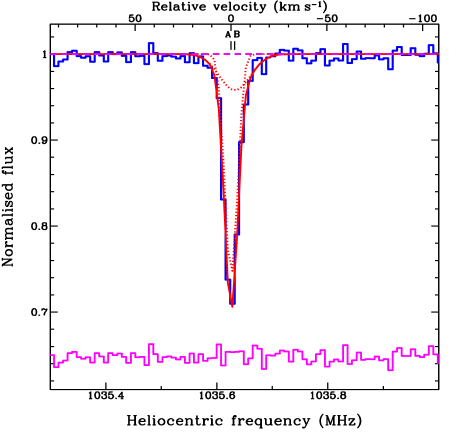
In the case of absorber towards J0849+5108, the total integrated 21-cm optical depth, = 0.950.06 km s-1. Overall, 90% of the total optical depth is contained within 22.5 km s-1. In the case of J1443+0214, the total integrated 21-cm optical depth is 3.40.1 km s-1, and 90% of the total optical depth is contained within 16.5 km s-1. We parametrize both the absorption profiles using multiple Gaussian components. The fits are shown in Figs. 1 and 2, and details of Gaussian components are provided in Table 1.
| Quasar | ID | FWHM | ||
|---|---|---|---|---|
| (kms-1) | ||||
| J0849+5108 | A | 0.312074 | 41 | 0.0590.010 |
| B | 0.312058 | 132 | 0.0350.008 | |
| C | 0.311992 | 82 | 0.0310.004 | |
| J1443+0214 | A | 0.371544 | 81 | 0.2970.017 |
| B | 0.371535 | 194 | 0.0430.015 |
3 Physical properties in individual cases
3.1 = 0.3120 galaxy towards J0849+5108
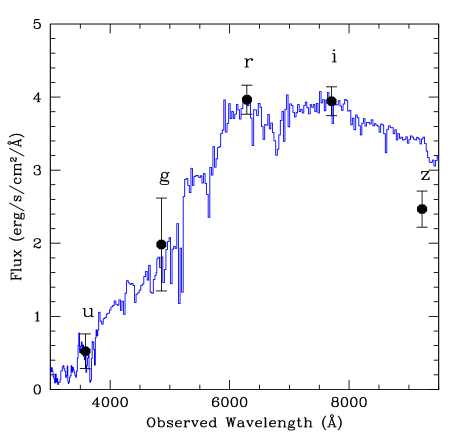
The background radio source in this case is a well-known object that has a BL Lacertae-like spectrum during outbursts (Arp et al. 1979). The nature of this object has been the subject of considerable debate. There are speculations about its optical spectrum being affected by foreground galaxy lensing and/or reddening (Stickel et al. 1989; Östman et al. 2006). Interestingly, there are two foreground galaxies at angular separation less than 15′′ to the radio source (see Fig. 7 of Gupta et al. 2010), and the sight line has been previously searched for 21-cm and molecular absorption (Boisse et al. 1988; Wiklind & Combes 1995). The galaxy J084957.48+510842.3 (=0.073) situated at 14′′ (19 kpc) north of the radio source is a member of an interacting pair of galaxies (Stickel et al. 1989). No 21-cm absorption was detected from this galaxy by Boisse et al. (1988). The 3 21-cm optical depth limit, , was 0.32 km s-1. A deeper 21-cm absorption optical depth limit, =0.08 km s-1, was obtained for this galaxy using GMRT by Gupta et al. (2010). They also reported the detection of Na i and Ca ii absorption at = 0.3120 in the spectrum of the QSO and associated it to a luminous red galaxy (LRG), identified as ‘G1’ in their Fig. 7, at an angular separation of 2.3′′ (14 kpc) southeast of the QSO. While the spectrum of this galaxy is not available in the SDSS catalog, Fig. 3 shows that the SDSS photometry is consistent with an LRG at the absorber’s redshift. Here, we report the detection of 21-cm absorption at the redshift of Na i and Ca ii absorption lines (see Fig. 1). The 21-cm absorption profile is well fitted with three Gaussian components presented in Table 1. In principle, the width of 21-cm absorption line can be used to constrain the kinetic temperature, 21.86FWHM2, of absorbing gas (e.g., Heiles & Troland 2003). For J0849+5108, the FWHM of the strongest and narrowest Gaussian component ‘A’ implies kinetic temperature, 350 K.
The observed equivalent widths of Na i absorption lines correspond to (Na i) (62) cm-2, assuming the optically thin case. Consequently, we derive log (H i) following the relation
| (1) |
from the known correlation between (H i) and (Na i) found in our Galaxy (Ferlet et al. 1985; Wakker & Mathis 2000). By assuming an optically thin cloud with spin temperature and covering factor , the total integrated 21-cm optical depth estimated from the GMRT spectrum corresponds to the H i column density, (H i)=1.71020(/100)(1.0/) cm-2. Therefore, if the absorber was to follow the (H i)-(Na i) relation seen in our galaxy, the harmonic mean spin temperature K. Since such high values are typically seen in high- DLAs (Kanekar & Chengalur 2003; Srianand et al. 2012), it will be important to have a direct Ly measurement of (H i) for this system .
The extent of gas detected in absorption is determined by the size of the background source. At milliarcsecond (mas) scales, J0849+5108 exhibits a core-jet morphology with an overall separation of 4 mas, i.e. 20 pc at the (D’Ammando et al. 2012). The 5 GHz Very Long Baseline Array (VLBA) observations simultaneous with the Very Large Array (VLA) observations recover 75% to 85% of the total arcsecond scale flux (see Tables 6 and 7 of D’Ammando et al. 2012). The remaining flux originates in structures on scales 40 mas (i.e., 200 pc at ). This suggests that the region probed in the GMRT spectrum probably corresponds to scales 20 pc. If the extent of the absorbing gas is 20 pc then this would imply 0.7. Actually, the ‘core’ component is unresolved with size0.3 mas (i.e., 1.4 pc at =0.3120) and contains about 95% of the total mas-scale flux at 5-10 GHz. Thus, the derived constraints on and extent of the region probed in 21-cm absorption are conservative.
As previously mentioned, while J0849+5108 has a spectral energy distribution (SED) similar to that of a blazar, Yuan et al. (2008) identified it as a radio-bright narrow-line Seyfert 1 AGN with an additional contribution to the optical flux coming from a mildly relativistic jet. The intrinsic spectrum is uncertain and most likely very different from the median QSO spectrum of Vanden Berk et al. (2001). Therefore, unlike the case of QGP J1443+0214 discussed next, it is not possible to obtain an independent estimate of (H i) by SED fitting in this case.
3.2 =0.3714 galaxy towards J1443+0214
 |
 |
 |
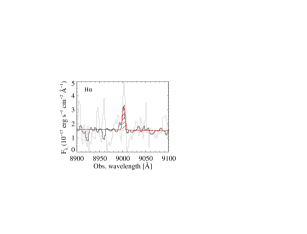 |
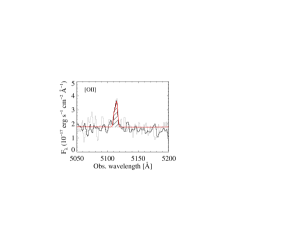
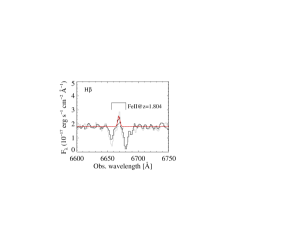
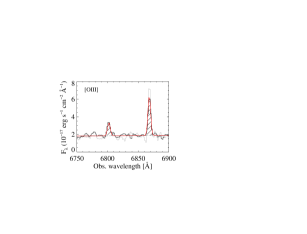
Unlike most QGPs studied until now, where one clearly identifies a foreground galaxy in optical images, the galaxy in the case of QGP J1443+0214 is identified by the detection of emission lines in the SDSS spectrum of QSO. The foreground galaxy is invisible otherwise. The SDSS spectrum [both in SDSS-II (DR7) and SDSS-III (DR9)] of QSO J1443+0214 shows broad emission lines at = 1.82 and a set of narrow emission lines (i.e., [O ii], [O iii], H , and H ) at =0.3714 (see Fig. 4) like the foreground galaxies detected by Noterdaeme et al. (2010b) in the SDSS spectra of high- QSOs. We do not detect any significant difference in the line strengths between the SDSS-II (DR7) and SDSS-III (DR9) spectra, while the fiber diameters are of 3″(15 kpc at ) and 2″(10 kpc at ), respectively. Therefore the line emission probably originates in a low surface brightness region within 5 kpc to the QSO sight line. This is also confirmed by the non-detection of the galaxy in SDSS images after subtracting the QSO contribution and by the fact that the SED fitting as in Fig. 5 (see below) did not require any additional contribution from the galaxy continuum.
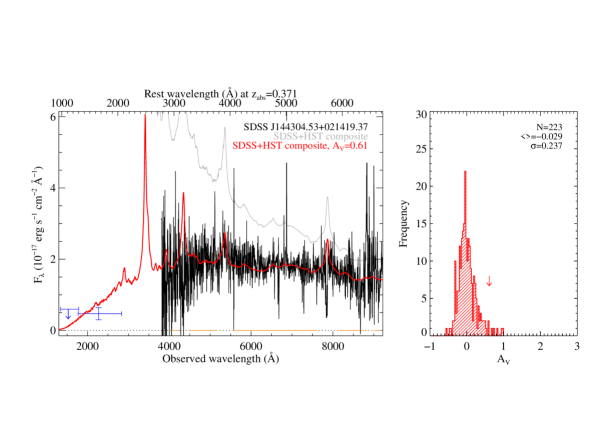
We estimated the color excess E(B-V) by fitting the SDSS-II SED of QSO J1443+0214 by the SDSS-II QSO composite from Vanden Berk et al. (2001). The 2000 Å rest-wavelength coverage for the composite spectrum was taken from Telfer et al. (2002). We reddened the composite spectrum using the Galaxy, the LMC, and the SMC extinction curves (see Srianand et al. 2008; Noterdaeme et al. 2009, 2010a for the detailed procedure). These extinction curves differ significantly only at 2500 Å. For J1443+0214, the SMC extinction curve is favored by the ultraviolet photometric points from the GALEX images. The J1443+0214 SED, along with the composite QSO SED reddened using the SMC extinction curve at with the best fit A, is shown in Fig. 5. We went on to apply the same procedure to a control sample of 223 SDSS-II QSOs from Schneider et al. (2010) with emission redshifts within from that of J1443+0214, where we removed QSOs with strong BAL activity using Allen et al. (2011). We estimated the uncertainty due to intrinsic shape variations from the width of AV distribution and corrected for the “zero-point” (the median AV value). The extinction we thus derive for J1443 +0214 is A, i.e., evidence of reddening along the sight line when compared to the control sample. Since we did not attempt to remove intervening absorbers from the control sample, the estimated AV and its statistical significance are conservative.
Next we use the Balmer decrement to obtain an independent estimate of the extinction. Various emission line fluxes estimated through the Gaussian profile fitting using a higher signal-to-noise ratio DR9 spectrum (Pâris et al. 2012) are given in Table 2. As noted above, different extinction curves are identical over the wavelength range of emission lines considered here and therefore yield similar values. From the observed Balmer decrement, we estimate the color excess 0.19 and 0.20 assuming intrinsic and for the SMC- and the Galaxy-type dust respectively (Gordon et al. 2003). This corresponds to for = 2.74 seen in the SMC. The extinction detected towards the QSO is significantly higher than the value (E(B-V)0.03) generally seen towards intervening DLAs and Mg ii systems (e.g., York et al. 2006; Khare et al. 2012). It is also interesting to note that the extinction derived in the star-forming region using emission lines is remarkably consistent with the value derived along the QSO line of sight using SED fitting. This suggests that the abundance of dust is homogeneous over the length scale corresponding to the impact parameter (5 kpc), over which the line fluxes are measured. Using the mean vs (H i) relationship found for the SMC (Gordon et al. 2003), we infer (H i) = cm-2.
| Line | (a)𝑎(a)(a)𝑎(a)footnotemark: | Derived | |
|---|---|---|---|
| ( erg s-1 cm-2) | ( erg s-1) | quantities | |
| O ii | 11.7 | 12.5 | SFR = 0.8 M⊙ yr-1(b)𝑏(b)(b)𝑏(b)footnotemark: |
| O iii5007 | 24.8 | 21.4 | R23 = 13.8 |
| H | 3.4 | 3.0 | = 0.20 |
| H | 12.1 | 8.5 | SFR = 0.7 M⊙ yr-1(c)𝑐(c)(c)𝑐(c)footnotemark: |
The profile of the 21-cm absorption line detected towards J1443+0214 is relatively simple (Fig. 2). In addition to a narrow component that can be modeled with a Gaussian of FWHM8 km s-1 (1400 K), a broad component is also required to reasonably fit absorption in wings (Table 1). The total integrated 21-cm optical depth corresponds to (H i)=6.21020(/100)(1.0/) cm-2, which is less than the (H i) we inferred from the SED fitting. This could either be due to the covering factor of the gas being much less than 1 or the harmonic mean being as high as 1400 K. No mas-scale images or (H i) measurements using Ly are available to distinguish between these scenarios. Another possibility is that the extinction per hydrogen atom in this absorber is much higher than what is measured in the SMC. It has been suggested that this may be the case in some high- dusty Mg ii absorbers with 21-cm absorption (Gupta et al. 2012) and DLAs with CO detections (Noterdaeme et al. 2010a).
Now we use nebular emission line properties to obtain insight into the nature of the absorbing galaxy. We correct emission line fluxes for extinction and use these to estimate the global metallicity and star formation rate (SFR) of the galaxy (Table 2). For J1443+0214 we estimate the R23 ratio, defined as ([O ii] + [O iii])/H, to be 13.8. In general, the R23 calibration is double-valued with respect to metallicity, and additional line ratios are required to break this degeneracy. For J1443+0214, the measured ratio is a high value at the turnover of the high- and low-metallicity branches of R23-metallicity calibration (see e.g., Kobulnicky et al. 1999; Pilyugin 2000), indicating 12 + log (O/H) i.e., 0.5Z⊙ using 12 + log (O/H)⊙ = 8.69 (Asplund et al. 2009). From extinction-corrected luminosity, (H), and using the following relation from Kennicutt (1998),
| (2) |
we derive SFR0.7 M⊙ yr-1. Using the following relation from Kewley et al. (2004)
| (3) |
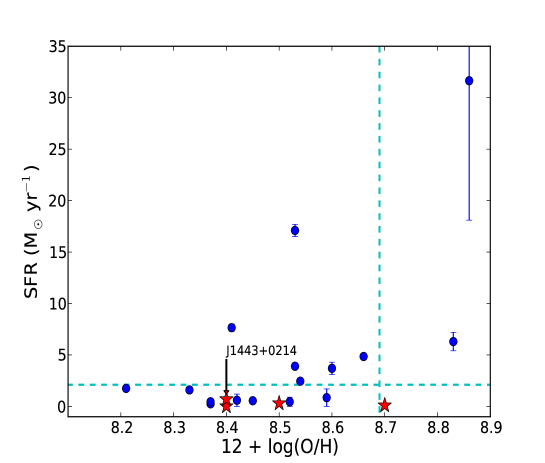
a similar value of 0.80.2 M⊙ yr-1 is derived using L(O ii). Thus, the SFR is slightly below the median value, and the metallicity is well within the range of values found for such [O iii]-emitting galaxies by Noterdaeme et al. (2010b) (see Fig. 6). In Fig. 6, the metallicity measurements for galaxies detected by Noterdaeme et al. (2010b) correspond to the upper branch of R23-metallicity calibration. The corresponding metallicities on the lower R23 branch would be typically 0.4 dex lower. The SFRs for these have been estimated using calibrations (Eqs. 23 and 24) from Argence & Lamareille (2009) that use uncorrected [O ii] and H luminosities. The error bars in Fig. 6 indicate the range of SFRs allowed by variations in dust attenuation and metallicity but do not account for fiber losses.
| Quasar | Galaxy | dv | 12+log(O/H) | [O/H](a)𝑎(a)(a)𝑎(a)footnotemark: | SFR | (b)𝑏(b)(b)𝑏(b)footnotemark: | Reference | |||
|---|---|---|---|---|---|---|---|---|---|---|
| (kpc) | (km s-1) | (M⊙ yr-1) | ||||||||
| J104257+074850 | 2.7 | J104257+074751 | 0.03 | 1.7 | 0.2 | 8.4 | 0.29 | 0.01 | 4.1 | Borthakur et al. (2010) |
| J124157+633241 | 2.6 | J124157+633237 | 0.14 | 11 | 2.9 | 8.7 | 0.01 | 0.1 | 2.9 | Gupta et al. (2010) |
| J144304+021419 | 1.8 | 0.37 | 5 | 3.4 | 8.4 | 0.29 | 0.7 | 3.8 | This work | |
| J163956+112758 | 1.0 | J163956+112802 | 0.08 | 4.0 | 15.7 | 8.5 | 0.19 | 0.3 | 18 | Srianand et al. (2013) |
In addition to QGP J1443+0214, galactic emission lines superimposed on top of QSO continuum in SDSS fiber (diameter 3′′) spectra have been detected for three other 21-cm absorbers. For these four absorbers, we are able to obtain SFR, SFR per unit area () and metallicity (see Table 3 and references given in the last column for details). The SFR and metallicity for these 21-cm absorbers are also plotted in Fig. 6 for comparison with the sample of [O iii]-selected normal galaxies of Noterdaeme et al. (2010b). Figure 6 suggests that the SFR of 21-cm absorbers is less than the median SFR of [O iii]-selected Mg ii absorbers. While in the case of J1443+0214 we are sure that all the galactic emission is included in the SDSS fiber, in other cases a large fraction of foreground galaxy emission falls outside the SDSS fiber. Therefore, SFRs for these galaxies are at best lower limits, and are in general underestimated with respect to the higher redshift (0.40.7) sample of Noterdaeme et al. (2010b). Therefore, within uncertainties SFRs for these QGPs with 21-cm absorption seem to be consistent with [O iii]-selected Mg ii absorbers.
4 Discussion
We have detected 21-cm absorption from two foreground galaxies at 0.3 towards quasars J0849+5108 (b14 kpc) and J1443+0214 (b5 kpc). In both cases, we infer (H i) 21020 cm-2, which qualifies these systems as DLAs. The integrated 21-cm optical depths are 0.95 km s-1 for J0849+5108 and 3.4 km s-1 for J1443+0214. As can be noted from Fig. 19 of Gupta et al. (2010), such high values are observed among DLAs with host galaxy located at 15 kpc. In the case of J0849+5108, the SDSS photometry suggests that the Na i, Ca ii, and 21-cm absorption lines detected by us are associated with an LRG having a smooth optical morphology that is typical of a passively evolving early-type galaxy. In the case of J1443+0214, the absorption is probably associated with a low surface brightness (LSB) galaxy identified via optical emission lines within 5 kpc of the QSO sight line. Late-type or LSB galaxies have been identified with a few low- DLAs and 21-cm absorbers (see Table 4 of Rao et al. 2003; Le Brun et al. 1997). However, the case of LRG associated with the absorber towards J0849+5108 is the first example of an early-type galaxy associated with an intervening 21-cm absorber. The gas detected in 21-cm and metal absorption lines in the outskirts (b14 kpc) of this LRG could be associated with the extended H i disks ((H i)1020 cm-2) detected in deep H i 21-cm emission observations of local early-type galaxies (e.g., Serra et al. 2012). In particular, the cold gas detected in 21-cm absorption could be serving as fuel to the renewed star formation activity in the outer regions of the galaxy. This idea is supported by detections of ultraviolet rings that correspond to extended low-level recent or ongoing star formation in outskirts of early-type galaxies (Salim et al. 2012; Fang et al. 2012).
DLAs, as well as 21-cm absorption line surveys at , are generally based on QSO sight lines selected via Mg ii absorption (Rao et al. 2006), and it is well known that LRGs offer very little cross-section to Mg ii absorption (Bowen & Chelouche 2011). Indeed, in an Mg ii selected sample of DLAs, sub-DLAs and Lyman limit systems at 0.11.0 Rao et al. (2011) find that absorber galaxies comprise a mix of spectral types that are predominantly late type. Of eight DLA galaxies in the part of their sample with sufficient photometry to carry out galaxy template fits, only one is found to be early type. Clearly, much larger samples are required to quantify the prevalence of early-type galaxies in samples of DLA and 21-cm absorber hosts. The techniques that rely solely on the detection of nebular emission lines to identify absorber hosts may miss such cases.
Now we turn to low- 21-cm absorbers with detections of nebular emission lines in QSO spectra. The SFR of absorbing galaxy in the case of J1443+0214 presented here is well below the median SFR found for [O iii]-selected Mg ii absorbers at 0.40.7 (Noterdaeme et al. 2010b). A large fraction (87%) of these [O iii]-selected absorbers exhibits strong Mg ii absorption (1Å). This, along with the detection of strong Fe ii absorption in several cases, suggests that most of these systems could be DLAs (see Rao et al. 2006). Wolfe et al. (2003) have used C ii∗ to infer in DLAs. For the CNM-model i.e. where QSO sight lines pass through CNM, they measure =10-2.2 M⊙ yr-1 kpc-2 and measure =10-1.3 M⊙ yr-1 kpc-2 for the warm neutral medium (WNM)-model. The that we measure for low- QGPs in Table 3 are more in line with the CNM-model. This is not surprising since the presence of CNM in these cases is confirmed by the detection of 21-cm absorption. The abundances we infer for these QGPs using emission lines are in the range, [O/H] -0.3 to 0.3 (Table 3), and are significantly higher than the values generally inferred for DLAs using absorption lines. It will be interesting to obtain ultraviolet spectra of these QGPs to measure (H i) and metallicity. This will also provide a direct measurement of spin temperature and CNM fraction along the sight lines, and will be crucial for understanding low CNM fractions in DLAs inferred from the observations of 21-cm and H2 absorption (e.g., Kanekar & Chengalur 2003; Srianand et al. 2012).
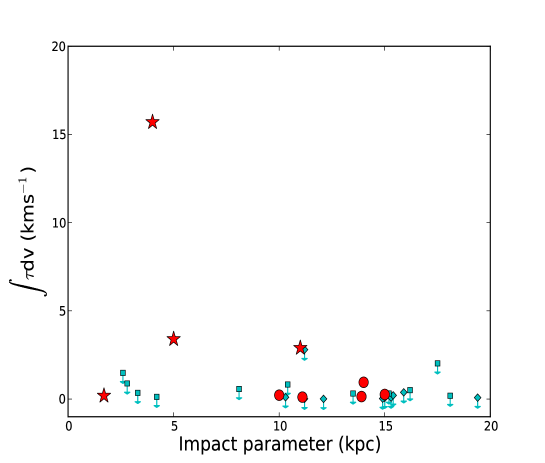
At , where it is possible to build large samples of DLAs via ground-based optical surveys (Noterdaeme et al. 2012b), searches to detect DLA host galaxies have mostly resulted in non-detections (e.g., Moller & Warren 1993; Rahmani et al. 2010). Recently, thanks to powerful instrumentation on the VLT, detections of a few DLA host galaxies have been possible by specifically targeting high-metallicity/(H i) DLAs (see e.g., Fynbo et al. 2011; Noterdaeme et al. 2012a). Using a sample of ten DLA hosts at , Krogager et al. (2012) report anti-correlation (Spearman rank, =0.6) between log (H i) and the galaxy impact parameter (see also Péroux et al. 2011). A similar trend is expected between 21-cm optical depth and impact parameter albeit with a large scatter probably due to further dependence on and . The strength of this correlation can potentially shed light on processes driving the CNM filling factor of DLAs. In Fig. 7, we plot 21-cm optical depth versus impact parameter for all the 0.4 QGPs with 21-cm absorption measurements (Gupta et al. 2010; Borthakur et al. 2011). The Spearman rank correlation coefficient test suggests weak (=-0.3) anti-correlation between dv and for QGPs with 21-cm detection. Milliarcsecond scale images and 21-cm absorption spectra along with a much larger sample, especially with 10 kpc, are required to confirm and understand the implication of this trend. Because the number of DLAs and consequently DLA hosts at is expected to steadily increase with the availability of large samples of QSO spectra from the SDSS Baryon Oscillation Spectroscopic Survey (Noterdaeme et al. 2012b), all this clearly motivates the need for large surveys of 21-cm absorption line especially at low- where it is relatively easy to identify and determine the properties of absorbing galaxy. Such surveys will become possible in the near future with SKA pathfinders and will uncover a new population of high-(H i) absorbers i.e., DLA/sub-DLAs that have escaped optical/ultraviolet absorption line surveys due to biases caused by either dust extinction or pre-selection of QSO sight lines based on various metal absorption lines or on the proximity to a certain galaxy type.
Acknowledgments
We gratefully acknowledge V. Mohan’s help with the subtraction of QSO contribution from SDSS images and useful discussions with P. Serra. We thank the GMRT staff for their help during the observations. GMRT is run by the National Centre for Radio Astrophysics of the Tata Institute of Fundamental Research. We acknowledge the use of SDSS spectra from the archive (http://www.sdss.org/). RS and PPJ gratefully acknowledge support from the Indo-French Centre for the Promotion of Advanced Research (Project N.4304-2).
References
- Allen et al. (2011) Allen, J. T., Hewett, P. C., Maddox, N., Richards, G. T., & Belokurov, V. 2011, MNRAS, 410, 860
- Argence & Lamareille (2009) Argence, B. & Lamareille, F. 2009, A&A, 495, 759
- Arp et al. (1979) Arp, H., Sargent, W. L. W., Willis, A. G., & Oosterbaan, C. E. 1979, ApJ, 230, 68
- Asplund et al. (2009) Asplund, M., Grevesse, N., Sauval, A. J., & Scott, P. 2009, ARA&A, 47, 481
- Boisse et al. (1988) Boisse, P., Dickey, J. M., Kazes, I., & Bergeron, J. 1988, A&A, 191, 193
- Borthakur et al. (2011) Borthakur, S., Tripp, T. M., Yun, M. S., et al. 2011, ApJ, 727, 52
- Borthakur et al. (2010) Borthakur, S., Tripp, T. M., Yun, M. S., et al. 2010, ApJ, 713, 131
- Bowen & Chelouche (2011) Bowen, D. V. & Chelouche, D. 2011, ApJ, 727, 47
- Briggs & Wolfe (1983) Briggs, F. H. & Wolfe, A. M. 1983, ApJ, 268, 76
- Carilli & van Gorkom (1992) Carilli, C. L. & van Gorkom, J. H. 1992, ApJ, 399, 373
- Curran et al. (2010) Curran, S. J., Tzanavaris, P., Darling, J. K., et al. 2010, MNRAS, 402, 35
- D’Ammando et al. (2012) D’Ammando, F., Orienti, M., Finke, J., et al. 2012, MNRAS, 426, 317
- Darling et al. (2011) Darling, J., Macdonald, E. P., Haynes, M. P., & Giovanelli, R. 2011, ApJ, 742, 60
- Fang et al. (2012) Fang, J. J., Faber, S. M., Salim, S., Graves, G. J., & Rich, R. M. 2012, ApJ, 761, 23
- Ferlet et al. (1985) Ferlet, R., Vidal-Madjar, A., & Gry, C. 1985, ApJ, 298, 838
- Fynbo et al. (2011) Fynbo, J. P. U., Ledoux, C., Noterdaeme, P., et al. 2011, MNRAS, 413, 2481
- Gordon et al. (2003) Gordon, K. D., Clayton, G. C., Misselt, K. A., Landolt, A. U., & Wolff, M. J. 2003, ApJ, 594, 279
- Gupta et al. (2010) Gupta, N., Srianand, R., Bowen, D. V., York, D. G., & Wadadekar, Y. 2010, MNRAS, 408, 849
- Gupta et al. (2012) Gupta, N., Srianand, R., Petitjean, P., et al. 2012, A&A, 544, A21
- Gupta et al. (2009) Gupta, N., Srianand, R., Petitjean, P., Noterdaeme, P., & Saikia, D. J. 2009, MNRAS, 398, 201
- Heiles & Troland (2003) Heiles, C. & Troland, T. H. 2003, ApJ, 586, 1067
- Hopkins & Beacom (2006) Hopkins, A. M. & Beacom, J. F. 2006, ApJ, 651, 142
- Kanekar & Chengalur (2003) Kanekar, N. & Chengalur, J. N. 2003, A&A, 399, 857
- Kanekar et al. (2009) Kanekar, N., Prochaska, J. X., Ellison, S. L., & Chengalur, J. N. 2009, MNRAS, 396, 385
- Kennicutt (1998) Kennicutt, Jr., R. C. 1998, ARA&A, 36, 189
- Kewley et al. (2004) Kewley, L. J., Geller, M. J., & Jansen, R. A. 2004, AJ, 127, 2002
- Khare et al. (2012) Khare, P., vanden Berk, D., York, D. G., Lundgren, B., & Kulkarni, V. P. 2012, MNRAS, 419, 1028
- Kobulnicky et al. (1999) Kobulnicky, H. A., Kennicutt, Jr., R. C., & Pizagno, J. L. 1999, ApJ, 514, 544
- Krogager et al. (2012) Krogager, J.-K., Fynbo, J. P. U., Møller, P., et al. 2012, MNRAS, 424, L1
- Lane (2000) Lane, W. 2000, PhD thesis, University of Groningen
- Le Brun et al. (1997) Le Brun, V., Bergeron, J., Boisse, P., & Deharveng, J. M. 1997, A&A, 321, 733
- Moller & Warren (1993) Moller, P. & Warren, S. J. 1993, A&A, 270, 43
- Noterdaeme et al. (2012a) Noterdaeme, P., Laursen, P., Petitjean, P., et al. 2012a, ArXiv e-prints
- Noterdaeme et al. (2009) Noterdaeme, P., Ledoux, C., Srianand, R., Petitjean, P., & Lopez, S. 2009, A&A, 503, 765
- Noterdaeme et al. (2012b) Noterdaeme, P., Petitjean, P., Carithers, W. C., et al. 2012b, A&A, 547, L1
- Noterdaeme et al. (2010a) Noterdaeme, P., Petitjean, P., Ledoux, C., et al. 2010a, A&A, 523, A80+
- Noterdaeme et al. (2010b) Noterdaeme, P., Srianand, R., & Mohan, V. 2010b, MNRAS, 403, 906
- Östman et al. (2006) Östman, L., Goobar, A., & Mörtsell, E. 2006, A&A, 450, 971
- Pâris et al. (2012) Pâris, I., Petitjean, P., Aubourg, É., et al. 2012, A&A, 548, A66
- Péroux et al. (2011) Péroux, C., Bouché, N., Kulkarni, V. P., York, D. G., & Vladilo, G. 2011, MNRAS, 410, 2237
- Pilyugin (2000) Pilyugin, L. S. 2000, A&A, 362, 325
- Rahmani et al. (2010) Rahmani, H., Srianand, R., Noterdaeme, P., & Petitjean, P. 2010, MNRAS, 409, L59
- Rao et al. (2011) Rao, S. M., Belfort-Mihalyi, M., Turnshek, D. A., et al. 2011, MNRAS, 416, 1215
- Rao et al. (2003) Rao, S. M., Nestor, D. B., Turnshek, D. A., et al. 2003, ApJ, 595, 94
- Rao et al. (2006) Rao, S. M., Turnshek, D. A., & Nestor, D. B. 2006, ApJ, 636, 610
- Salim et al. (2012) Salim, S., Fang, J. J., Rich, R. M., Faber, S. M., & Thilker, D. A. 2012, ApJ, 755, 105
- Schneider et al. (2010) Schneider, D. P., Richards, G. T., Hall, P. B., et al. 2010, AJ, 139, 2360
- Serra et al. (2012) Serra, P., Oosterloo, T., Morganti, R., et al. 2012, MNRAS, 422, 1835
- Srianand et al. (2012) Srianand, R., Gupta, N., Petitjean, P., et al. 2012, MNRAS, 421, 651
- Srianand et al. (2008) Srianand, R., Gupta, N., Petitjean, P., Noterdaeme, P., & Saikia, D. J. 2008, MNRAS, 391, L69
- Srianand et al. (2013) Srianand, R., Gupta, N., Rahmani, H., et al. 2013, MNRAS, 428, 2198
- Stickel et al. (1989) Stickel, M., Fried, J. W., & Kuehr, H. 1989, A&A, 224, L27
- Telfer et al. (2002) Telfer, R. C., Zheng, W., Kriss, G. A., & Davidsen, A. F. 2002, ApJ, 565, 773
- Vanden Berk et al. (2001) Vanden Berk, D. E., Richards, G. T., Bauer, A., et al. 2001, AJ, 122, 549
- Wakker & Mathis (2000) Wakker, B. P. & Mathis, J. S. 2000, ApJ, 544, L107
- Wiklind & Combes (1995) Wiklind, T. & Combes, F. 1995, A&A, 299, 382
- Wolfe et al. (2003) Wolfe, A. M., Prochaska, J. X., & Gawiser, E. 2003, ApJ, 593, 215
- Wolfire et al. (2003) Wolfire, M. G., McKee, C. F., Hollenbach, D., & Tielens, A. G. G. M. 2003, ApJ, 587, 278
- York et al. (2006) York, D. G., Khare, P., Vanden Berk, D., et al. 2006, MNRAS, 367, 945
- York et al. (2012) York, D. G., Straka, L. A., Bishof, M., et al. 2012, MNRAS, 423, 3692
- Yuan et al. (2008) Yuan, W., Zhou, H. Y., Komossa, S., et al. 2008, ApJ, 685, 801