Heavy dust obscuration of galaxies in a cosmological hydrodynamic simulation
Abstract
Hubble Space Telescope observations with Wide Field Camera 3/IR reveal that galaxies at z7 have very blue ultraviolet (UV) colors, consistent with these systems being dominated by young stellar populations with moderate or little attenuation by dust. We investigate UV and optical properties of the high- galaxies in the standard cold dark matter model using a high-resolution adaptive mesh refinement cosmological hydrodynamic simulation. For this purpose, we perform panchromatic three-dimensional dust radiative transfer calculations on 198 galaxies of stellar mass with three parameters, the dust-to-metal ratio, the extinction curve, and the fraction of directly escaped light from stars (). Our stellar mass function is found to be in broad agreement with Gonzalez et al., independent of these parameters. We find that our heavily dust-attenuated galaxies () can also reasonably match modest UV–optical colors, blue UV slopes, as well as UV luminosity functions, provided that a significant fraction (10%) of light directly escapes from them. The observed UV slope and scatter are better explained with an Small Magellanic Cloud-type extinction curve, whereas Milky Way-type dust predicts too blue UV colors due to the 2175 bump. We expect that upcoming observations by ALMA will be able to test this heavily obscured model.
Subject headings:
galaxies: high-redshift — galaxies: ISM1. Introduction
Observational techniques based on photometric properties of star-forming galaxies have proven to be successful in identifying galaxies at high redshift (Steidel et al., 1996). In particular, the arrival of recent Wide Field Camera 3 / Infrared (WFC3/IR) data taken with the Hubble Space Telescope has enlarged the sample of -dropout galaxies () (e.g., Bouwens et al., 2012), allowing for the investigation of ultraviolet (UV) properties of the early galaxies. These candidates reveal colors close to zero or sometimes negative (Bouwens et al., 2010; Wilkins et al., 2011; McLure et al., 2011; Dunlop et al., 2012; Finkelstein et al., 2012; Bouwens et al., 2012; Dunlop et al., 2013; Bouwens et al., 2013), indicating a very blue spectral energy distribution with , where the UV-continuum slope relates to the flux density per unit wavelength () as . Given that a small amount of dust can substantially redistribute the spectral energy distribution, the low value has been taken to indicate a limited amount of dust in these systems.
On the other hand, using Infrared Array Camera (IRAC) and WFC3/IR data, Labbé et al. (2010) reported that their galaxies have moderate rest-frame optical colors , implying the presence of evolved stellar population older than Myr. In fact, for a realistic rising star formation (SF) history, the age of the population alone seemed very difficult to explain such colors without significant attenuation by dust and/or nebular line emission (Finlator et al., 2011; Labbé et al., 2010). Several authors pointed out the possibility that these apparently conflicting results are may be due to contamination by nebular emission lines, such as H and [Oiii] 4959, 5007 doublet (Schaerer & de Barros, 2010; Labbe et al., 2012; Curtis-Lake et al., 2013; Stark et al., 2013; Schenker et al., 2013; Bouwens et al., 2013), to the IRAC 3.6 m band. For example, Labbe et al. (2012) claim that the galaxies show – colors that are much bluer than – colors, supporting the view that the high- galaxies are young and affected by moderate or little dust attenuation.
However, some hydrodynamic simulations in a cold dark matter cosmology predict that galactic metal enrichment occurs in a very short time scale (e.g., Finlator et al., 2011), leading to the formation of galaxies of stellar mass with a metallicity close to solar at . Given that galaxies are more compact and denser at higher redshift (e.g., Ferguson et al., 2004; Trujillo et al., 2006; van Dokkum et al., 2008), one may expect that the simulated galaxies are significantly dust attenuated, and may be in conflict with observations. In this study, we test this idea by confronting simulated UV luminosity and stellar mass functions, UV and optical colors of galaxies with observations. A self-consistent three-dimensional radiative transfer calculation on galaxies produced by a cosmological simulation with 30 times better spatial resolution (29 pc) is a significant improvement over previous studies (Devriendt et al., 2010; Salvaterra et al., 2011; Finlator et al., 2011). More importantly, we show that, with an Small Magellanic Cloud (SMC)-type extinction curve, our substantially dust attenuated galaxies can also simultaneously explain the observed red UV–optical colors, blue UV colors, as well as UV luminosity functions if the escape fraction of stellar photons is 10%.
The outline of this paper is as follows. We first describe the simulation details in Section 2. In Section 3, simulated galaxies with different assumptions on dust properties are compared with observations. Finally, we discuss implications of these results and conclude in Section 4.
2. Simulations
The cosmological simulation is performed with the Eulerian hydrodynamics code, enzo (Bryan, 1999; O’Shea et al., 2005; Joung et al., 2009; Bryan et al., 2013). For more details on the simulation setup and implemented physics, the reader is referred to Cen (2012). Briefly, this is a large zoom-in simulation of embedded in a periodic box. The simulation includes a uniform Haardt-Madau UV background where the cosmic reionization occurs at , a shielding of UV radiation by neutral hydrogen, metal-dependent radiative cooling down to K, star formation, and supernova feedback (Cen, 2012). The physical prescriptions have been validated by a large suite of independent observations, including the cosmic star formation history (Cen, 2011), and damped Lyman alpha systems at redshift (Cen, 2012). The maximum spatial resolution is , and dark matter particles of are used within the zoomed-in region. The initial condition is generated with the cosmological parameters that are consistent with the WMAP7 results (Komatsu et al., 2011): .
To compute the spectral energy distributions (SEDs) of each galaxy, we post-process the simulation output at using a three-dimensional dust radiation transfer code, sunrise (Jonsson, 2006; Jonsson et al., 2010). The main advantage of sunrise is the use of a polychromatic algorithm, which can trace information in all wavelengths per each ray. It makes use of the standard dust cross-sections (e.g., Weingartner & Draine, 2001; Draine & Li, 2007) to simulate absorption and multiple scattering by dust. The input stellar spectrum is taken from starburst99 (Leitherer et al., 1999) assuming a Kroupa initial mass function with the low (high) mass cut-off of 0.1 (100 ). sunrise also uses the spectrum of Hii or photo-dissociation regions (PDRs) computed by a photo-ionization code, mappingsiii (Dopita et al., 2005; Groves et al., 2008), to take into account the immediate absorption and emission by birth clouds. This is done by replacing SEDs of young () star particles with re-processed SEDs of a population with constant star formation for 10 Myr by mappingsiii (see Jonsson et al., 2010). The fraction of light processed by PDRs is controlled by a parameter, , which we adopt following Jonsson et al. (2010). The amount of dust is inferred from the amount of metals by assuming an adjustable dust-to-metal ratio (). We use the maximum resolution available from the AMR hydrodynamic simulation () to compute absorption and scattering by dust. We test the convergence of the Sunrise results by degrading the most refined cells in each halo by one level, before performing dust radiative transfer. We find that the attenuated UV and UV-optical colors are well converged (within 0.01 dex). Note that the attenuated spectra is redshifted to in order to match the typical redshift of the sample (e.g., Bouwens et al., 2013) and then convolved with WFC3/IR F125W, F160W and IRAC filter throughputs to yield , , and mag in AB magnitude, respectively.
3. Results
Our simulated sample consists of 198 galaxies of stellar mass at . The simulated galaxies with have the specific star formation rate (sSFR) of , with more massive galaxies having smaller sSFR (see also Cen, 2011), compatible with the recent measurements by Schaerer & de Barros (2010); Bouwens et al. (2012); Stark et al. (2013). A simple fit to the stellar mass and SFR gives . Predicted stellar (gas) metallicities of galaxies with , and are 0.5, and 1.0 (0.6, and 0.5 ), respectively, indicating that more massive galaxies have more metal-rich populations. We note that similar metal enrichment is found in Finlator et al. (2011, Fig. 11), which is based on an entirely independent numerical technique and feedback prescription.
3.1. Calibrations to stellar mass and UV luminosity functions
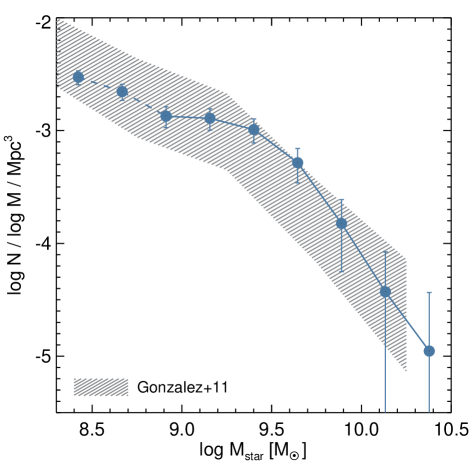
The left panel of Fig. 1 shows the stellar mass function (SMF) of simulated galaxies at , which is seen to match reasonably well the observed SMF based on SED fitting with + data (González et al., 2011; Labbé et al., 2010). However, we note that nebular emission lines, such as or [Oiii] 5007, may contribute to Spitzer/IRAC 3.6 m bands, resulting in possible overestimation of stellar mass of observed galaxies (Schaerer & de Barros, 2010; Stark et al., 2013; Curtis-Lake et al., 2013). Bearing this in mind, we also discuss a model in which stellar mass, stellar and gas metallicities are artificially lowered by a factor of 2.5, such that galaxies with have stellar metallicity of .
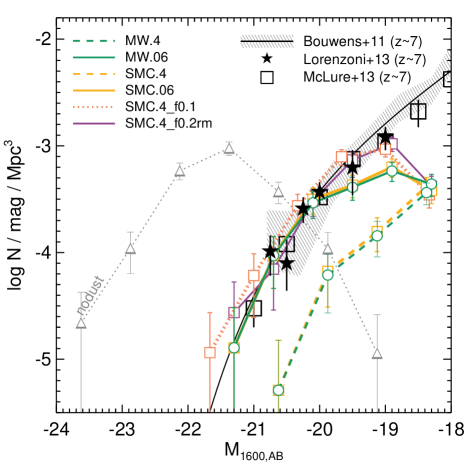
In the right panel of Fig. 1, we present rest-frame UV luminosity functions (UVLFs) at . The absolute UV magnitude () is measured by integrating the SED at through a square filter of width . We find that the intrinsic UV of simulated galaxies (gray dotted line) would be too bright compared with observations (Bouwens et al., 2011; Lorenzoni et al., 2013; Dunlop et al., 2013) by about 2–3 magnitudes. Performing dust radiative transfer substantially improves the agreement of simulated UVLFs with observations. We find that a dust-to-metal ratio of successfully reproduces the observed UVLFs up to (corresponding to , e.g., Stark et al. 2013), above which our simulation is incomplete. The resulting attenuation in FUV is found to be . On the other hand, adopting the dust-to-metal ratio , inferred from local metal-rich galaxies (e.g., Dwek, 1998; Draine et al., 2007), we find that the simulated galaxies would suffer from too much extinction (dashed lines). This is the case regardless of whether the extinction curve is MW-type (green lines) or SMC-type (orange lines), as the dust extinction cross-section around 1600 is similar in the two cases (e.g., Weingartner & Draine, 2001).
We stress that it is possible that our simulation under-resolves the porosity of the interstellar medium, potentially giving rise to a higher covering fraction of dusty gas around young stars (c.f., Wise & Cen, 2009). In this case, the number of UV photons directly coming out of galaxies may be under-estimated. We explore this possibility by introducing a free parameter, , which quantifies the fraction of directly escaped light from stars. Conceptually, differs from in the sense that the former is related to the global ISM structure, while the latter is only applicable to young stars and their birth clouds. We find that adding 10% of the intrinsic stellar light to the strongly attenuated spectrum with can also give a reasonable match to the observed UVLF (orange dotted line), indicating that there is a degeneracy between a dust-to-metal ratio and the escape fraction. This particular case may be viewed as the model with the maximum , as opposed to the models with (MW.06 or SMC.06). The resulting difference between the two cases is the differential reddening in UV and optical bands, as we discuss in the next section.
It is worth noting that our simulated galaxies represent actively star-forming, dusty galaxies. In the case of the model with SMC-type extinction, , and (SMC.4_f0.1), galaxies with turn out to have . Given that high- galaxies are generally more compact than the local counterpart (e.g., Ferguson et al., 2004), such heavy attenuation may not be too surprising. As aforementioned, however, if our galaxies formed too many stars and overproduced metals, the extinction is likely to be overestimated. To quantify a possible change in the extinction, we compare an ad hoc case () in which stellar mass, metallicity, and gas metallicity are reduced by a factor of 2.5 before performing radiative transfer calculations. We use an escape fraction of to match the observed UVLFs in this case. Even in this model with smaller galaxy masses and smaller amounts of dust, it turns out that the galaxies still show more significant attenuation of compared to derived based on a single dust screen model fitting of the observed SED (Schaerer & de Barros, 2010).
3.2. UV and optical colors
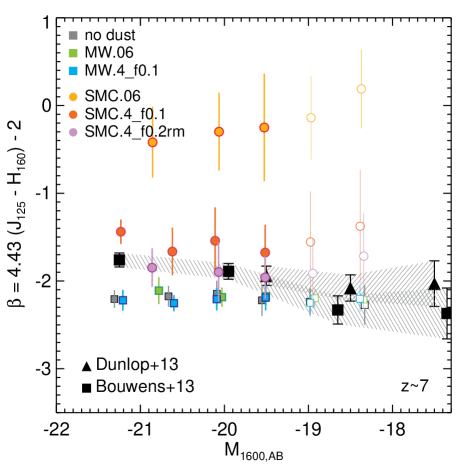
Fig. 2 shows the UV slope () as a function of UV luminosity, where is computed from the UV color as (Dunlop et al., 2013). The latest determinations of the slope from two independent studies, Bouwens et al. (2013) and Dunlop et al. (2013), are shown as squares and triangles. Several interesting features can be found in this figure. First, our simulated galaxies show intrinsically blue UV colors () with little dependence on luminosity. Although SFRs of our simulated galaxies increase with increasing stellar mass, we find that a considerable scatter in the relation ( dex) leads to the scatter in the intrinsic for a given stellar mass, weakening the dependence on the UV slope (Fig. 2, gray squares). Second, the UV slope in the models with MW-type dust turns out to be too steep for bright galaxies () regardless of the amount of dust (MW.4_f0.1 and MW.06). This is because the dust cross-sections in and bands are comparable due to the 2175 bump. For the same reason, the models predict a much smaller scatter in the UV slope than observed. These suggest that dust in the galaxies is unlikely to share the same grain distribution as Milky Way. Third, the model in which SMC-type dust pervades (SMC.06) predicts too shallow UV slope () than observed due to stronger attenuation at FUV than at NUV wavelengths. We find that predicted UV slopes of luminous galaxies () are broadly consistent with observations, within error bars, only in the models with SMC-type dust and a large escape fraction (SMC.4_f0.1 and SMC.4_f0.2rm). For the less luminous bins (), our simulation is incomplete (Fig. 1), and thus may not be compared directly to the observations. Nevertheless, the correlation between the UV slope and luminosity in this model appears to be weak in the bright regime, consistent with observations. It is also noteworthy that the scatter in the UV slope is more notable than that of MW-type dust, as there is a mixture of galaxies with different attenuation for a given UV luminosity.
Another factor that can alter the UV slope is the covering fraction of the PDR (). As shown in Fig. 6 from Groves et al. (2008), a covering fraction close to 1 considerably reddens the UV spectrum of young stellar populations. We examine how sensitive the predicted UV slope is to the choice of , and find that our results do not depend strongly on the parameter. In the case of , the UV slope of the input SED (i.e. mappingsiii + starburst99 ) is only slightly steeper () than the one with the fiducial value, . Conversely, setting makes the slope shallower by only +0.09 dex. After extinction, the difference becomes even smaller. Such a small change in is essentially because i) the impact of on the UV slope is only prominent at , and ii) a significant fraction () of the intrinsic UV flux arises from the stars older than 10 Myr. However, even when is assumed, the change in the slope of the input SED is found to be , which is a smaller effect than that of attenuation by the intervening interstellar dust or the escape fraction.
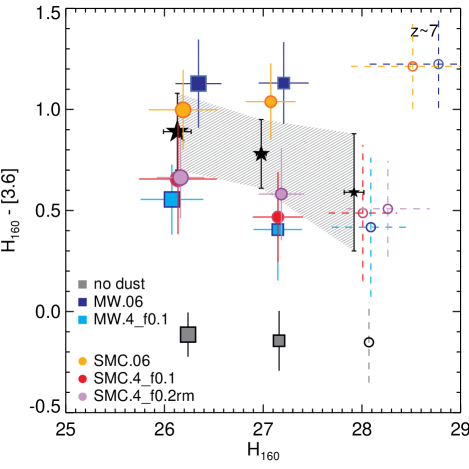
An interesting puzzle of galaxies is their red UV–optical color –. As pointed out by Finlator et al. (2011), obtaining such a red UV–optical color is not trivial for actively star-forming galaxies with little dust. In accord with Finlator et al. (2011), we predict that our simulated galaxies are indeed very blue, , in the absence of dust attenuation and nebular emission lines, shown as gray filled circles in Fig. 3. For a fair comparison with Labbé et al. (2010), we present average colors and their dispersions by dividing the simulated galaxy sample into three magnitude bins, , , and . Notice that the last bin () is incomplete due to finite resolution (Fig. 1), and displayed as empty circles.
Inclusion of nebular emission lines can improve the agreement by increasing the flux in the optical band. Strictly speaking, several strong emission lines, such as [Oii] 3726/3729 doublet or [Oiii] 4959, 5007, do not fall within Spitzer/IRAC window for galaxies. However, for galaxies at redshift , [Oiii] 4959, 5007 lines can contribute to the flux. In order to take into account the contribution, we add the emission lines corresponding to the equivalent width of , motivated by observations111We could directly compute the equivalent width of the emission lines from the sunrise output, but we decided not to do so, mainly because the prediction is uncertain in the case of the models with a non-zero escape fraction. Accordingly, we removed the emission lines from the simulated SEDs, and then increased the magnitude by 0.3 dex, motivated by observations (Labbe et al., 2012; Schenker et al., 2013).(Labbe et al., 2012; Schenker et al., 2013). This means that the UV bright (faint) galaxies are likely to have moderate (blue) UV–optical continuum colors. Nevertheless, inclusion of nebular emission does not suffice to account for the observed colors, indicating that it may not be fully responsible for the observed red – colors (see also Finlator et al., 2011, c.f. Stark et al. 2013).
We find that red UV–optical colors can naturally arise by dust extinction. Fig. 3 clearly shows that the models with a zero escape fraction (MW.06 and SMC.06) produce sufficiently red galaxies , as the dust extinction cross-section is larger in the UV wavelengths than in the optical range (Weingartner & Draine, 2001). In particular, the models showing reasonable UV slopes (SMC.4_f0.1 and SMC.4_f0.2rm) predict UV–optical colors that are compatible with observations. Note that the contribution from nebular line emission (0.3 dex) is already included in theses calculations, and dust extinction accounts for the reddening of dex in the two models (SMC.4_f0.1 and SMC.4_f0.2rm). We expect that higher dark matter resolution would lead to better agreement, as more stars would form in smaller dark matter halos at earlier epochs. For example, we find that increasing the mean stellar age from 100 Myr to 200 Myr can easily redden the UV–optical colors by 0.2 dex without changing UV slopes significantly. Thus, we conclude that our heavily obscured galaxies with SMC-type dust and a high escape fraction can also simultaneously explain the blue UV colors and moderate UV-optical continuum colors.
4. Conclusions and Discussion
Utilizing an ab initio cosmological adaptive mesh refinement hydrodynamic simulation with high resolution ( pc), we investigate – and -optical colors of 198 simulated galaxies at . We post-process our metal-rich galaxies () through three-dimensional panchromatic dust radiative transfer calculations by varying three parameters, the dust-to-metal ratio (), the extinction curve, and the fraction of directly escaped light (). By matching simulated UV luminosity functions to the ones observed, we identify two sets of models with (, ) = (0.06, 0) or (0.4, 0.1), corresponding to the cases with the minimum and the maximum escape fraction.
We find that the observed moderate UV–optical continuum colors as well as blue UV colors of galaxies can be reproduced simultaneously with SMC-type dust, a large dust-to-metal ratio of 0.4, and =10%. The resulting attenuation in the V band is found to be more significant () than the one derived based on a single dust screen model fitting of the observed SED (Schaerer & de Barros, 2010). On the other hand, the model with a zero escape fraction and produces galaxies with too shallow UV slopes () compared with observations (Dunlop et al., 2013; Bouwens et al., 2013).
After searching through the parameter space, the fact that the model with a is favored over to a model with much smaller is worth noting. Observations of cosmological reionization infer the Thomson optical depth (Hinshaw et al., 2012), indicating a reionization redshift of (assuming a sudden reionization picture). In order to reionize the universe at this redshift range by stellar sources, is likely required (e.g., Cen, 2003). Moreover, detailed radiative transfer simulations indicate a porous interstellar medium and, is within the range of predictions for galaxies at high redshift (Wise & Cen, 2009; Razoumov & Sommer-Larsen, 2010; Yajima et al., 2011).
By contrast, we find that predicted UV slopes are too steep regardless of the amount of dust in the case of MW-type dust due to the presence of the 2175 Å bump. The bump also results in a much smaller scatter in the UV slope than observed, suggesting that galaxies are more likely to have SMC-type dust. The most successful models (SMC.4_f0.1 and SMC.4_f0.2rm) predicts the UV slope to be weakly dependent on UV luminosity in the range , as shown in observations (Bouwens et al., 2013; Dunlop et al., 2013). These conclusions remain largely unchanged even if we assume that our galaxies overproduced stars and metals by a factor 2.5 to take into account possible overestimation in stellar mass of observed galaxies (Schaerer & de Barros, 2010; Stark et al., 2013; Curtis-Lake et al., 2013), except that becomes slightly lower .
Our simulated galaxies are found to be dusty, and heavily affected by attenuation (). The predicted attenuation is larger than in star-forming galaxies with similar masses at lower redshift () (e.g., Buat et al., 2012), but in a direction expected since high- galaxies are more compact than the low- counterparts (e.g., Ferguson et al., 2004). An important question is whether a large amount of dust can form in galaxies at , given that a substantial fraction of stardust may originate from the late stage of stellar evolution (e.g., Draine, 2009). Interestingly, observations of quasars at report the detection of large masses of dust (Bertoldi et al., 2003; Dwek et al., 2007; Wang et al., 2008; Venemans et al., 2012), supporting that a majority of dust is grown in the ISM (Draine, 2003, see also for an alternative explanation by Bianchi & Schneider 2007). A most direct test of our model is by detection of strong infrared emission from the UV selected galaxies and details will be presented in a companion paper (Cen & Kimm 2013, in prep.).
Acknowledgements
We are grateful to the referee for a careful review of the paper. We also thank Silvio Lorenzoni and Rychard Bouwens for sharing their data, and the YT community (Turk et al., 2011) for providing useful analysis routines. Computing resources were in part provided by the NASA High- End Computing (HEC) Program through the NASA Advanced Supercomputing (NAS) Division at Ames Research Center. The research is supported in part by NSF grant AST-1108700 and NASA grant NNX12AF91G.
References
- Bertoldi et al. (2003) Bertoldi, F., Carilli, C. L., Cox, P., et al. 2003, A&A, 406, L55
- Bianchi & Schneider (2007) Bianchi, S., & Schneider, R. 2007, MNRAS, 378, 973
- Bouwens et al. (2010) Bouwens, R. J., Illingworth, G. D., Oesch, P. A., et al. 2010, ApJ, 708, L69
- Bouwens et al. (2011) —. 2011, ApJ, 737, 90
- Bouwens et al. (2012) —. 2012, ApJ, 754, 83
- Bouwens et al. (2013) —. 2013, ArXiv e-prints
- Bryan (1999) Bryan, G. L. 1999, Comput. Sci. Eng., Vol. 1, No. 2, p. 46 - 53, 1, 46
- Bryan et al. (2013) Bryan, G. L., Norman, M. L., O’Shea, B. W., et al. 2013, astro-ph/1307.2265
- Buat et al. (2012) Buat, V., Noll, S., Burgarella, D., et al. 2012, A&A, 545, A141
- Cen (2003) Cen, R. 2003, ApJ, 591, 12
- Cen (2011) —. 2011, ApJ, 741, 99
- Cen (2012) —. 2012, ApJ, 748, 121
- Curtis-Lake et al. (2013) Curtis-Lake, E., McLure, R. J., Dunlop, J. S., et al. 2013, MNRAS, 429, 302
- Devriendt et al. (2010) Devriendt, J., Rimes, C., Pichon, C., et al. 2010, MNRAS, 403, L84
- Dopita et al. (2005) Dopita, M. A., Groves, B. A., Fischera, J., et al. 2005, ApJ, 619, 755
- Draine (2003) Draine, B. T. 2003, ARA&A, 41, 241
- Draine (2009) Draine, B. T. 2009, in Astronomical Society of the Pacific Conference Series, Vol. 414, Cosmic Dust - Near and Far, ed. T. Henning, E. Grün, & J. Steinacker, 453
- Draine & Li (2007) Draine, B. T., & Li, A. 2007, ApJ, 657, 810
- Draine et al. (2007) Draine, B. T., Dale, D. A., Bendo, G., et al. 2007, ApJ, 663, 866
- Dunlop et al. (2012) Dunlop, J. S., McLure, R. J., Robertson, B. E., et al. 2012, MNRAS, 420, 901
- Dunlop et al. (2013) Dunlop, J. S., Rogers, A. B., McLure, R. J., et al. 2013, MNRAS, 432, 3520
- Dwek (1998) Dwek, E. 1998, ApJ, 501, 643
- Dwek et al. (2007) Dwek, E., Galliano, F., & Jones, A. P. 2007, ApJ, 662, 927
- Ferguson et al. (2004) Ferguson, H. C., Dickinson, M., Giavalisco, M., et al. 2004, ApJ, 600, L107
- Finkelstein et al. (2012) Finkelstein, S. L., Papovich, C., Salmon, B., et al. 2012, ApJ, 756, 164
- Finlator et al. (2011) Finlator, K., Oppenheimer, B. D., & Davé, R. 2011, MNRAS, 410, 1703
- González et al. (2011) González, V., Labbé, I., Bouwens, R. J., et al. 2011, ApJ, 735, L34
- Groves et al. (2008) Groves, B., Dopita, M. A., Sutherland, R. S., et al. 2008, ApJS, 176, 438
- Hinshaw et al. (2012) Hinshaw, G., Larson, D., Komatsu, E., et al. 2012, astro-ph/1212.5226
- Jonsson (2006) Jonsson, P. 2006, MNRAS, 372, 2
- Jonsson et al. (2010) Jonsson, P., Groves, B. A., & Cox, T. J. 2010, MNRAS, 403, 17
- Joung et al. (2009) Joung, M. R., Cen, R., & Bryan, G. L. 2009, ApJ, 692, L1
- Komatsu et al. (2011) Komatsu, E., Smith, K. M., Dunkley, J., Bennett, C. L., & Gold, B. 2011, ApJS, 192, 18
- Labbé et al. (2010) Labbé, I., González, V., Bouwens, R. J., et al. 2010, ApJ, 716, L103
- Labbe et al. (2012) Labbe, I., Oesch, P. A., Bouwens, R. J., et al. 2012, ArXiv e-prints
- Leitherer et al. (1999) Leitherer, C., Schaerer, D., Goldader, J. D., et al. 1999, ApJS, 123, 3
- Lorenzoni et al. (2013) Lorenzoni, S., Bunker, A. J., Wilkins, S. M., et al. 2013, MNRAS, 429, 150
- McLure et al. (2011) McLure, R. J., Dunlop, J. S., de Ravel, L., et al. 2011, MNRAS, 418, 2074
- O’Shea et al. (2005) O’Shea, B. W., Abel, T., Whalen, D., & Norman, M. L. 2005, ApJ, 628, L5
- Razoumov & Sommer-Larsen (2010) Razoumov, A. O., & Sommer-Larsen, J. 2010, ApJ, 710, 1239
- Salvaterra et al. (2011) Salvaterra, R., Ferrara, A., & Dayal, P. 2011, MNRAS, 414, 847
- Schaerer & de Barros (2010) Schaerer, D., & de Barros, S. 2010, A&A, 515, A73
- Schenker et al. (2013) Schenker, M. A., Ellis, R. S., Konidaris, N. P., & Stark, D. P. 2013, astro-ph/1306.1518
- Stark et al. (2013) Stark, D. P., Schenker, M. A., Ellis, R., et al. 2013, ApJ, 763, 129
- Steidel et al. (1996) Steidel, C. C., Giavalisco, M., Pettini, M., Dickinson, M., & Adelberger, K. L. 1996, ApJ, 462, L17
- Trujillo et al. (2006) Trujillo, I., Förster Schreiber, N. M., Rudnick, G., et al. 2006, ApJ, 650, 18
- Turk et al. (2011) Turk, M. J., Smith, B. D., Oishi, J. S., et al. 2011, ApJS, 192, 9
- van Dokkum et al. (2008) van Dokkum, P. G., Franx, M., Kriek, M., et al. 2008, ApJ, 677, L5
- Venemans et al. (2012) Venemans, B. P., McMahon, R. G., Walter, F., et al. 2012, ApJ, 751, L25
- Wang et al. (2008) Wang, R., Carilli, C. L., Wagg, J., et al. 2008, ApJ, 687, 848
- Weingartner & Draine (2001) Weingartner, J. C., & Draine, B. T. 2001, ApJ, 548, 296
- Wilkins et al. (2011) Wilkins, S. M., Bunker, A. J., Stanway, E., Lorenzoni, S., & Caruana, J. 2011, MNRAS, 417, 717
- Wise & Cen (2009) Wise, J. H., & Cen, R. 2009, ApJ, 693, 984
- Yajima et al. (2011) Yajima, H., Choi, J.-H., & Nagamine, K. 2011, MNRAS, 412, 411