Newly-Discovered Globular Clusters in NGC 147 and NGC 185 from PAndAS
Abstract
Using data from the Pan-Andromeda Archaeological Survey (PAndAS), we have discovered four new globular clusters (GCs) associated with the M31 dwarf elliptical (dE) satellites NGC 147 and NGC 185. Three of these are associated with NGC 147 and one with NGC 185. All lie beyond the main optical boundaries of the galaxies and are the most remote clusters yet known in these systems. Radial velocities derived from low resolution spectra are used to argue that the GCs are bound to the dwarfs and are not part of the M31 halo population. Combining PAndAS with UKIRT/WFCAM data, we present the first homogeneous optical and near-IR photometry for the entire GC systems of these dEs. Colour-colour plots and published colour-metallicity relations are employed to constrain GC ages and metallicities. It is demonstrated that the clusters are in general metal poor ([Fe/H] -1.25 dex), while the ages are more difficult to constrain. The mean (V-I)0 colours of the two GC systems are very similar to those of the GC systems of dEs in the Virgo and Fornax clusters, as well as the extended halo GC population in M31. The new clusters bring the GC specific frequency () to in NGC 147 and in NGC 185, consistent with values found for dEs of similar luminosity residing in a range of environments.
keywords:
galaxies: globular glusters - galaxies: individual (NGC 147) - galaxies: individual (NGC 185)1 Introduction
Globular clusters (GCs) are ubiquitous in massive galaxies and their properties are believed to contain important clues about the galaxy assembly process. GCs are thought to form during major star forming episodes which occur in the early Universe, as well as in subsequent major merger events (e.g. West et al., 2004; Brodie & Strader, 2006). Their relative ages and metallicities therefore help constrain the star formation timescale of the host galaxies in which they reside. GCs can also be accreted onto galaxies alongside their hosts in minor mergers. At present, we witness the Sagittarius dwarf spheroidal galaxy being accreted onto the Milky Way (MW) while donating at least five GCs to the MW GC system (e.g. Bellazzini et al., 2003; Law & Majewski, 2010). Furthermore, almost 80% of the outer halo GCs in M31 lie on top of stellar streams supporting an accretion origin for most of them (Mackey et al., 2010b). Studying the GC systems of satellite galaxies is not just interesting in its own right but can also give insight into how the GC systems of more massive galaxies are assembled.
Detailed study of GCs in satellite galaxies is uniquely accessible within the Local Group (LG) since individual stars can be easily resolved from both space and the ground (e.g. Mackey et al., 2006, 2010a; Dotter et al., 2011). Identifying LG GCs does not need to rely on colour and magnitude criteria alone, as almost any globular cluster candidate can be visually confirmed, effectively removing the possibility of contamination. Two particularly interesting LG satellites are the dwarf ellipticals (dEs) NGC 147 and NGC 185. Amongst the brightest of the LG dwarf galaxies, they reside in the outer halo of M31 at projected galactocentric radii of kpc, and 3D distances of 118 kpc and 181 kpc respectively (Conn et al., 2012). For reference, taking the halo core radius of M31 to be 5 kpc (Gilbert et al., 2012), the 3D distances of NGC 147 and NGC 185 correspond to and core radii respectively. It has been argued that the two systems may form a physical binary (van den Bergh, 1998; Geha et al., 2010) although this claim has been questioned (Battinelli & Demers, 2004; Watkins et al., 2013). The stellar populations and star formation histories of these two dwarf galaxies have been extensively studied (e.g. Lee et al., 1993; Young & Lo, 1997; Butler & Martínez-Delgado, 2005; McConnachie et al., 2005; Davidge, 2005). Despite their initial similarities, they exhibit some notable differences. NGC 147 is a typical dE composed primarily of old stars and is dust and gas free (Young & Lo, 1997). However, NGC 185 has a substantial number of intermediate age stars (Martínez-Delgado et al., 1999), as well as gas and dust (Young, 2001). Bender et al. (1991) found NGC 147 to be rotating, while NGC 185 to be entirely pressure supported. In contrast, Geha et al. (2010) found both galaxies to have significant internal rotation through study of stars out to 8 effective radii.
Previous studies have discovered a number of GCs in NGC 147 and NGC 185, all of which lie in or near the main bodies of these systems (Baade, 1944; Hodge, 1976; Ford et al., 1977; Sharina & Davoust, 2009). Thorough photometric (Baade, 1944; Hodge, 1974) and spectroscopic studies (Da Costa & Mould, 1988; Sharina et al., 2006; Sharina & Davoust, 2009) have been undertaken on these clusters, some of which are the brightest GCs known to reside in LG dwarf galaxies. This work has shown that in general the GCs hosted by NGC 147 and NGC 185 are old (7 Gyrs) and metal poor ([Fe/H] -0.8 dex). However, it is becoming increasingly appreciated that GCs can reside far from their host galaxies (e.g. Galleti et al., 2004; Hwang et al., 2011; Huxor et al., 2011; Huxor et al., 2012; Jang et al., 2012) and this has motivated us to explore the remote environs of these systems to search for additional members. In this paper, we present the discovery of four outlying GCs, three of which belong to NGC 147 while one is hosted by NGC 185. We derive the first homogeneous optical and near-IR photometry for the entire GC populations of the dEs which we use to constrain their ages and metallicities. In addition, we present radial velocity measurements for the newly-discovered GCs which are used to argue that they are bound to the dEs themselves as opposed to the extended M31 halo system.
For the purposes of this work, we adopt distance moduli of 24.26 0.06 and 23.96 for NGC 147 and NGC 185 respectively (Conn et al., 2012). The absolute magnitudes of these dwarf galaxies are taken from McConnachie (2012) and are -14.6 0.1 and -14.8 0.1 for NGC 147 and NGC 185 respectively.
The paper has the following structure. The observations and data reduction are described in Section 2. Sections 3 and 4 present the discovery and the photometric data of all known GCs in these two dwarf galaxies. The radial velocities of the newly-discovered GCs are presented in Section 5. In Section 6, the optical and near-IR colours are used to constrain ages and metallicities and we compare some properties of the GCs to those observed in other systems. The content of the paper is summarised in Section 7. Finally, in Appendix A we present a review of the discovery history of the GCs found around NGC 147 and NGC 185, pointing out certain inconsistencies in the literature, with the aim being to reduce the possibility of confusion when studying these systems in the future.
2 Observations and data reduction
2.1 Optical data
The optical imaging used in this work was taken as part of the recently completed “Pan-Andromeda Archaeological Survey” (PAndAS; McConnachie et al., 2009). This optical imaging survey mapped M31 and its close companion M33 with the wide-field MegaCam camera (Boulade et al., 2003) on the Canada-France-Hawaii Telescope (CFHT). In brief, the detector consists of a mosaic of 36 CCDs, giving a total field of view of 1 square, and with a pixel scale of 0.187 arcsec. The survey consisted of 400 distinct pointings, covering an area of 380 square degrees and extending to a projected radius of 150 kpc from the centre of M31. PAndAS was undertaken in the g and i bands. The observations were taken in good photometric conditions, with typical seeing 0.8″, and reaching a depth of g 25.5 and i 24.5 with S/N of 10.
The MegaCam data were initially reduced by CFHT staff using the “Elixir” pipeline which performs the standard bias, flatfield, and fringe corrections, and determines the photometric zero-point. The typical night-to-night variation of the zero-point is around 1-2% (Regnault et al., 2009). The data are further processed by the Cambridge Astronomy Survey Unit111http://casu.ast.cam.ac.uk, as described in full detail by McConnachie et al. (2010).
2.2 Near-IR data
The near-IR data were taken in October 2008, as part of a survey designed to look at red stellar populations in Local Group galaxies. It used the Wide-Field Camera (WFCAM, Casali et al. (2007)) on the United Kingdom Infrared Telescope (UKIRT). This instrument has a pixel scale of 0.4 arcsec, and the detectors are arranged such that four dithered pointings are aligned to cover a square of 0.75 deg2. The observations were done in three near-IR bands, J, H and K, with seeing of 0.8″ or better, using the microstepping option to improve the pixel sampling to 0.2″.
The data were reduced with a pipeline designed by the Cambridge Astronomy Survey Unit, performing the usual dark-correction, flatfielding, crosstalk removal, systematic noise and sky removal. The pipeline, which is part of the VDFS222VISTA data flow system, also does full astrometric and photometric calibration based on the 2MASS point source catalogue and is described in Cioni et al. (2008) and Hodgkin et al. (2009). The nightly zero-point variation on photometric nights is %. The reduced images were stacked and microstepped to produce individual detector frames. These were then resampled to form a 0.333 arcsec per pixel science mosaic (Irwin et al., 2004).
2.3 Spectroscopic data
Low resolution spectra of the new GCs were obtained during two nights in September 2010 using the ISIS instrument mounted on the William Herschel Telescope (WHT). Several exposures were made of each object with varying integration time depending on the brightness of the target. The specifics of these observations are shown in Table 1.
| ID | Date of obs. | Number of | Integration time |
|---|---|---|---|
| exposures | per exposure [s] | ||
| PA-N147-1 | 10/09/2010 | 4 | 800 |
| PA-N147-2 | 10/09/2010 | 3 | 800 |
| PA-N147-3 | 10/09/2010 | 3 | 1500 |
| PA-N185 | 11/09/2010 | 4 | 1800 |
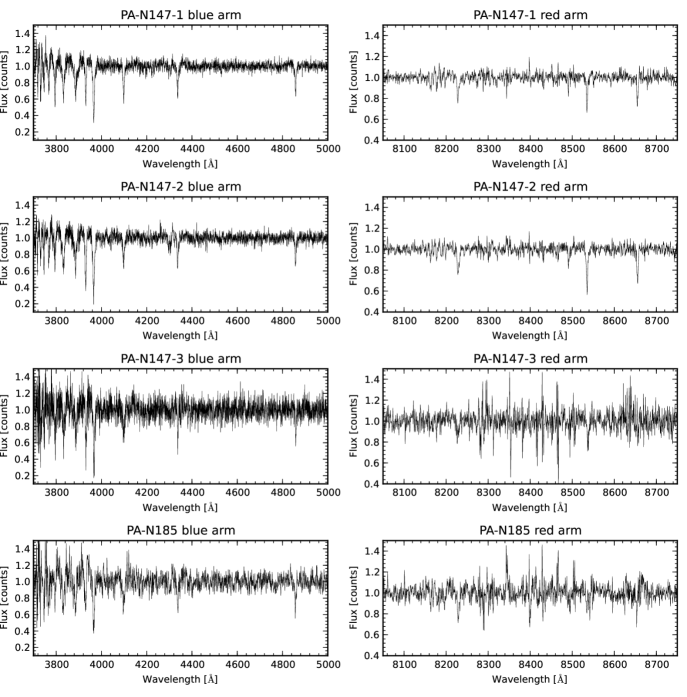
The ISIS instrument employs two detectors, each attached to a separate ‘arm’ of the spectrograph. The blue arm used the R600B grating and was selected to cover the wavelength range between 3500 - 5100 Å with a dispersion of 0.45 Å/pix. The the red arm used the R600R grating and was selected to cover the wavelength range between 7400 - 9100 Å with a dispersion of 0.79 Å/pix. The slit width was 2″ throughout the observations and no binning was applied in either the spectral or spatial directions. The S/N per pixel of the spectra observed with the blue arm vary between 7 and 22, while for the red arm between 11 and 30. The observations were undertaken under generally good atmospheric conditions with the seeing varying from 0.7 to 1.6″ over the two nights.
The reduction of the spectra (bias subtraction, flat-fielding, illumination correction) was done with standard tasks that are part of the ccdred package within IRAF333IRAF is distributed by the National Optical Astronomy Observatories, which are operated by the Association of Universities for Research in Astronomy, Inc., under cooperative agreement with the National Science Foundation. Following initial processing, the spectra were traced and extracted with a aperture using the apall task in IRAF. For each exposure, a background region was interactively selected and the sky was fit and subtracted with a second-order Chebyshev polynomial. The sky-subtraction generally worked well, with only the strongest lines in the red spectra leaving some residuals. The spectra were traced using a 3rd order cubic-spline function and extracted with the optimal variance weighting option of apall.
Wavelength calibration of the 1D spectra was based on He-Ne-Ar lamp exposures obtained before and after each target exposure. The arc spectra were extracted using the same apall settings as the target objects that they are used to calibrate. Typically 90 blue and 25 red lines were identified and the dispersion solution was fit with a 3rd order cubic-spline function. The RMS residuals of these fits were 0.050.01 Å in the blue and 0.020.01 Å in the red. The IRAF dispcor task was then used to assign the wavelength solutions to the target GC spectra. The positions of sky lines were used to verify that the wavelength calibration was accurate to 0.08 Å with no systematic shifts. The wavelength calibrated 1D spectra for each object were stacked using inverse variance weights to produce final science spectra. Finally, the continuum-normalised spectra are shown in Figure 1.
3 Discovery
At the distance of NGC 147 and NGC 185, GCs are partially resolved into stars at optical wavelengths and can be easily identified. Visual inspection of the area surrounding the two dEs was conducted by three of us (A. Huxor, D. Mackey, J. Veljanoski) and resulted in the discovery of four new GCs, three belonging to NGC 147, and one to NGC 185. We refer to these objects with the prefix ‘PA’. Images of these objects in the g and K bands are shown in Figure 2. For completeness and comparison, the previously-known GCs are also included. Table 2 lists the coordinates, projected galactocentric radii (Rproj) and Galactic reddening coefficients, E(B-V), from Schlegel et al. (1998) for all clusters. While this paper was in preparation, we found various inconsistencies in the literature regarding the nomenclature of the previously-known GCs in NGC 147 and NGC 185. These have been described in Appendix A and we have made an effort to rectify these inconsistencies throughout the paper whenever possible.
Our search is based on homogeneous and sensitive imagery covering a very large fraction of the areas around these two dEs. However, there are two sources of incompleteness that need to be considered. One is due to spatial incompleteness, arising from the many gaps between the imaging CCDs in the MegaCam focal plane, and the gaps coming from the imperfect tiling of the observations. GCs are sufficiently small on the sky that they could be missed were they to land in such a gap. The other source of incompleteness is due to our ability to visually detect GCs. We assessed incompleteness using the methodology we devised for our M31 halo GC search, which will be discussed in full detail in Huxor et al. (2013, in prep). Here we provide only a brief overview.
To quantify the spatial incompleteness, we calculate the area lost due to gaps in the imagery. First, we used the WCS information in the image headers to determine the RA and Dec boundaries of each of the 36 CCDs in a given MegaCam pointing. We then generated a set of random points around the two galaxies with a density of arcmin-2. The observed” area was simply calculated by dividing the number of points which fell within the RA and Dec boundaries by the total number generated. This test indicates that the fractions of NGC 147 and NGC 185 that are imaged out to a circular radius of 15 kpc are 96.3% and 93.5% respectively.
To quantify our ability to detect GCs through visual inspection, we generated a suite of artificial GCs using the SIMCLUST (Deveikis et al., 2008) and SKYMAKER (Bertin, 2009) software packages. The clusters were generated with a range of luminosity and concentration444The concentration is defined as ; where and are the cluster tidal and core radii respectively, assuming a King (1962) profile for its radial surface density. and were embedded within field star backgrounds of varying density. Thumbnails of these generated clusters were then visually inspected by one of us (A. Huxor) who decided if a cluster was present or not based on the same criteria we applied to the real data. Using this method, we found that, for most values of concentration, the GC recovery is 100(50)% complete down to around NGC 147. Around NGC 185, the search is 100(50)% complete down to . For reference, these limits indicate that we would be able to detect most, if not all, of the Milky Way Palomar type clusters. Indeed, of the thirteen such objects known in the Milky Way that have available absolute integrated V magnitudes, ten of them are brighter than -5.0, while eleven are brighter than -4.0 (Harris, 1996). We would not be able to detect the Koposov clusters which have -1 (Koposov et al., 2007), although these are difficult to find even in the Milky Way. It thus seems likely that we have uncovered all the luminous remote GCs around these two systems.
| ID | RA(J2000) | DEC(J2000) | Rproj | E(B-V) |
| [h m s] | [d m s] | [kpc] | [mag] | |
| Hodge I | 00 33 12.2 | +48 30 32.3 | 0.03 | 0.17 |
| Hodge II | 00 33 13.6 | +48 28 48.7 | 0.34 | 0.17 |
| Hodge III | 00 33 15.2 | +48 27 23.1 | 0.64 | 0.17 |
| Hodge IV | 00 33 15.0 | +48 32 09.6 | 0.38 | 0.17 |
| SD-GC5 | 00 32 22.9 | +48 25 49.0 | 1.93 | 0.18 |
| SD-GC7 | 00 32 22.2 | +48 31 27.0 | 1.72 | 0.17 |
| SD-GC10 | 00 32 47.2 | +48 32 10.7 | 0.92 | 0.17 |
| PA-N147-1 | 00 32 35.3 | +48 19 48.0 | 2.53 | 0.15 |
| PA-N147-2 | 00 33 43.3 | +48 38 45.0 | 2.04 | 0.16 |
| PA-N147-3 | 00 34 10.0 | +49 02 39.0 | 6.97 | 0.16 |
| FJJ I | 00 38 42.7 | +48 18 40.4 | 0.53 | 0.17 |
| FJJ II | 00 38 48.1 | +48 18 15.9 | 0.45 | 0.17 |
| FJJ III | 00 39 03.8 | +48 19 57.5 | 0.20 | 0.19 |
| FJJ IV | 00 39 12.2 | +48 22 48.2 | 0.64 | 0.19 |
| FJJ V | 00 39 13.4 | +48 23 04.9 | 0.70 | 0.19 |
| FJJ VII | 00 39 18.4 | +48 23 03.6 | 0.81 | 0.19 |
| FJJ VIII | 00 39 23.7 | +48 18 45.1 | 0.83 | 0.17 |
| PA-N185 | 00 38 18.8 | +48 22 04.0 | 1.20 | 0.18 |
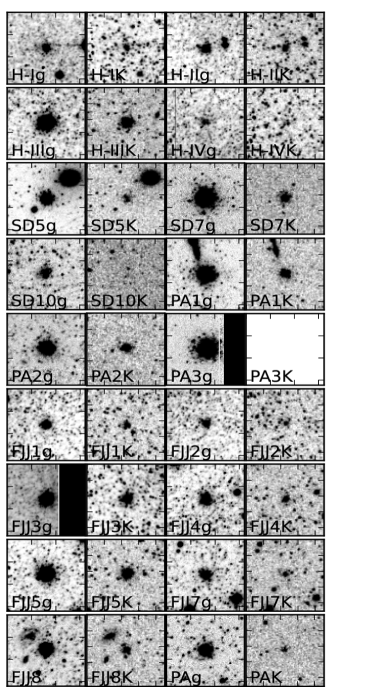
Figure 3 shows the spatial distribution of GCs in the two galaxies where it can readily be seen that the newly-discovered GCs are much more remote than the known populations. Given this, it is possible that some of them might be bound to M31 rather than to NGC 147 or NGC 185. This could be especially true for PA-N147-3 which is located at projected radius of 6.6 kpc from the centre of its host galaxy NGC 147.
To examine this possibility, we calculate the probability of finding a genuine M31 GC projecting as close to NGC 147 and NGC 185 as the new objects we have found. We consider a circular annulus spanning 90–110 kpc in projected radius from M31’s centre, the size of which is chosen to comfortably encompass the positions and extents of NGC 147 and NGC 185. Inside the annulus there are 8 M31 GCs excluding the new objects around NGC 147 and NGC 185 (Mackey et al. 2013, in prep.), which in turn equals a number density of clusters/kpc2. We define a search radius of 7 kpc and 2 kpc around NGC 147 and NGC 185 respectively, chosen to be slightly larger than the GCs that have the largest projected distance from the centres of these systems. On average one would expect to find 0.008 GCs within a circular area of 2 kpc radius and 0.098 GCs within a 7 kpc circular radius. The Poisson probability of finding one or more M31 GCs within a 2 kpc radius of NGC 185 and within a 7 kpc radius of NGC 147 is 1% and 10% respectively. The probability of finding three or more GCs within a 7 kpc radius of NGC 147 drops to 0.01%. The conclusion from this analysis is that, in absence of other information, there is a small chance that at least one of the newly-discovered GCs around NGC 147 could be part of the M31 halo GC system, while the newly discovered cluster around NGC 185 almost certainly belongs to its apparent host galaxy. It is also worth noting that two of the newly discovered GCs around NGC 147 appear to lie on top of tidal tails which emanate from this system (Lewis et al., 2013, Irwin et al. in prep).


4 Photometry
Integrated photometry of all the GCs in these two dwarf galaxies was done with the phot task within IRAF. The centroid algorithm within the phot task was used to determine accurate centres of the clusters by computing the intensity weighted means of the marginal profiles along the physical x and y axes in the g-band images. Circular apertures were then used to sum the total flux. Concentric “sky” annuli around the photometric apertures, with typical width of , were employed to determine the mean background flux contribution. The exact sizes of the background annuli were carefully selected to avoid pollutants such as bright foreground stars and background galaxies. As some of these clusters lie in very crowded fields, detailed tests were performed to ensure that the background contribution was reliably subtracted.
For each GC we constructed a curve-of-growth by measuring the flux in concentric apertures of increasing radius. The final photometric aperture size was set to be the point at which the cumulative flux becomes flat. This did not work for clusters in the very dense fields, where we adopted an aperture size based mainly on visual inspection, even though the curve-of-growth was not flat. To reduce background contamination, a smaller aperture of was used when measuring colours, valid if we assume that no colour gradients are present within the GCs. Aperture sizes for both colours and magnitudes were matched to be the same in the optical and near-IR data. For all photometric measurements, the instrumental magnitudes were zero-point calibrated, corrected for atmospheric extinction and corrected for Galactic reddening using the Schlegel et al. (1998) maps interpolated to the position of each GC. Tables 3 and 4 list the extinction-corrected magnitudes and colours of all GCs in NGC 147 and NGC 185.
Some objects required special treatment. In the cases of Hodge II and SD-GC5, a mask was applied consistently to all filters in order to exclude bright contaminating objects that entered the photometric aperture. The cluster PA-N147-3 was split between two separate CCD frames in the optical data. To account for this, we summed the flux within rectangular apertures on each frame and combined them; this strictly represents a lower limit on the total magnitude of this object. This same cluster has the largest projected radius of all GCs in our sample and it falls outside the near-IR survey area, meaning no near-IR measurement is possible. The cluster SD-10 was not detected in the near-IR imaging and the corresponding near-IR magnitudes listed provide upper limits on its brightness. The GC FJJ III lies very close to the edge of the chip in the g band, while it is split between two chips in the i band. For the optical photometry of this cluster, previously published data obtained with the Isaac Newton Telescope Wide Field Camera (INT/WFC) were used (McConnachie et al., 2005). This was not possible for PA-N147-3 as it falls outside the area covered by the INT survey. The INT/WFC survey uses the Johnson V and Gunn i passbands, which are on the Vega scale. Hence the magnitudes of FJJ III were converted to the CFHT/MegaCam system, which is on the AB scale, via transformations presented in Ibata et al. (2007).
| ID | Aperture | ||||||||
| [arcsecs] | [mag] | [mag] | [mag] | [mag] | [mag] | [mag] | [mag] | [mag] | |
| Hodge I | 6.5 | 17.17 0.04 | 16.31 0.02 | 14.84 0.02 | 14.25 0.02 | 14.13 0.03 | 16.86 0.03 | 15.92 0.02 | -7.40 |
| Hodge II1 | 4.6 | 17.79 0.04 | 17.07 0.04 | 15.93 0.02 | 15.30 0.02 | 15.14 0.02 | 17.53 0.03 | 16.71 0.04 | -6.73 |
| Hodge III | 7.4 | 16.29 0.03 | 15.65 0.02 | 14.71 0.01 | 14.15 0.01 | 14.18 0.01 | 16.05 0.02 | 15.29 0.02 | -8.21 |
| Hodge IV | 4.6 | 18.83 0.04 | 17.81 0.03 | 16.55 0.03 | 15.98 0.03 | 15.94 0.04 | 18.48 0.03 | 17.41 0.03 | -5.78 |
| GC-SD51 | 5.6 | 17.83 0.02 | 17.20 0.01 | 16.36 0.02 | 15.81 0.02 | 15.77 0.03 | 17.60 0.01 | 16.85 0.01 | -6.66 |
| GC-SD7 | 7.4 | 16.73 0.01 | 16.03 0.01 | 15.03 0.01 | 14.49 0.01 | 14.43 0.02 | 16.47 0.01 | 15.66 0.01 | -7.79 |
| GC-SD10 | 4.6 | 19.59 0.01 | 18.86 0.01 | 17.84 0.06 | 17.30 0.06 | 17.22 0.12 | 19.32 0.01 | 18.49 0.02 | -4.94 |
| PA-N147-1 | 6.5 | 16.72 0.01 | 16.09 0.01 | 15.15 0.01 | 14.69 0.01 | 14.64 0.02 | 16.49 0.01 | 15.74 0.01 | -7.77 |
| PA-N147-2 | 6.5 | 17.11 0.01 | 16.44 0.01 | 15.37 0.01 | 14.89 0.01 | 14.86 0.02 | 16.87 0.01 | 16.08 0.01 | -7.39 |
| PA-N147-3 | 17.17 0.012 | 17.63 0.012 | … | … | … | 17.38 0.012 | 17.42 0.012 | -6.882 | |
| FJJ I | 4.6 | 17.96 0.03 | 17.22 0.02 | 15.24 0.02 | 15.39 0.03 | 15.06 0.02 | 17.70 0.03 | 16.85 0.03 | -6.26 |
| FJJ II | 4.6 | 18.28 0.04 | 17.49 0.03 | 15.59 0.03 | 15.75 0.03 | 15.73 0.04 | 18.00 0.03 | 17.12 0.03 | -5.96 |
| FJJ III | 7.4 | 16.20 0.293 | 15.55 0.113 | 13.80 0.02 | 14.02 0.02 | 13.94 0.01 | 15.99 0.173 | 15.14 0.113 | -7.973 |
| FJJ IV | 5.6 | 17.58 0.03 | 17.00 0.02 | 15.24 0.02 | 15.53 0.03 | 15.60 0.04 | 17.37 0.02 | 16.65 0.02 | -6.59 |
| FJJ V | 7.4 | 16.38 0.03 | 15.66 0.02 | 13.85 0.01 | 14.09 0.02 | 14.00 0.01 | 16.12 0.02 | 15.30 0.02 | -7.84 |
| FJJ VII | 4.6 | 18.36 0.02 | 17.62 0.01 | 15.80 0.02 | 16.06 0.03 | 16.07 0.04 | 18.10 0.02 | 17.25 0.02 | -5.85 |
| FJJ VIII | 4.6 | 17.29 0.01 | 16.59 0.01 | 14.82 0.01 | 15.08 0.02 | 15.09 0.02 | 17.04 0.01 | 16.23 0.01 | -6.92 |
| PA-N185 | 4.6 | 18.65 0.01 | 17.98 0.01 | 16.23 0.03 | 16.54 0.04 | 16.39 0.06 | 18.41 0.01 | 17.62 0.01 | -5.55 |
| ID | ||||||
|---|---|---|---|---|---|---|
| [mag] | [mag] | [mag] | [mag] | [mag] | [mag] | |
| Hodge I | 0.720.04 | 1.970.04 | 2.510.04 | 2.590.04 | 0.830.04 | 2.330.03 |
| Hodge II1 | 0.680.07 | 1.750.05 | 2.300.05 | 2.350.05 | 0.790.07 | 2.110.04 |
| Hodge III | 0.610.04 | 1.570.04 | 2.070.04 | 2.100.04 | 0.730.04 | 1.870.03 |
| Hodge IV | 0.960.05 | 2.310.05 | 2.890.05 | 2.960.05 | 1.020.04 | 2.620.05 |
| GC-SD5 | 0.600.02 | 1.460.03 | 2.000.02 | 2.030.03 | 0.730.01 | 1.810.03 |
| GC-SD7 | 0.670.01 | 1.690.02 | 2.220.01 | 2.280.02 | 0.780.01 | 2.040.02 |
| GC-SD10 | 0.760.02 | 1.830.06 | 2.400.05 | 2.250.11 | 0.850.02 | 1.980.11 |
| PA-N147-1 | 0.520.01 | 1.600.02 | 2.040.01 | 2.140.02 | 0.750.01 | 1.910.02 |
| PA-N147-2 | 0.660.01 | 1.700.02 | 2.160.02 | 2.200.02 | 0.790.01 | 1.970.02 |
| PA-N147-3 | … | … | … | … | … | … |
| FJJ I | 0.730.04 | 2.640.04 | 2.410.04 | 2.550.04 | 0.840.04 | 2.300.04 |
| FJJ II | 0.750.05 | 2.630.05 | 2.460.05 | 2.520.05 | 0.850.04 | 2.250.04 |
| FJJ III2 | 0.670.31 | 2.560.29 | 2.300.29 | 2.420.29 | 0.860.19 | 2.220.16 |
| FJJ IV | 0.630.04 | 2.390.03 | 2.090.04 | 2.100.04 | 0.750.04 | 1.870.04 |
| FJJ V | 0.700.03 | 2.520.03 | 2.240.03 | 2.310.03 | 0.810.03 | 2.060.02 |
| FJJ VII | 0.730.03 | 2.600.03 | 2.340.03 | 2.360.04 | 0.840.03 | 2.100.03 |
| FJJ VIII | 0.690.02 | 2.480.02 | 2.220.03 | 2.240.02 | 0.800.02 | 2.000.02 |
| PA-N185 | 0.680.01 | 2.500.03 | 2.220.03 | 2.380.04 | 0.800.01 | 2.130.04 |
To allow comparison with other work, Tables 3 and 4 also contain magnitudes and colours converted to the more widely used Johnson/Cousins filters. The CFHT/MegaCam data was transformed into the standard V and I system via corrected relations from Huxor et al. (2008)555Note that the transformation equations in that paper were incorrectly written, but the magnitudes derived were based on the correct equations.:
These relations were derived for the filter used with CFHT/MegaCam pre-June 2007, while in October 2007 a new i filter was installed on this instrument. The data used in this paper were taken with the new i filter and so before transforming the MegaCam data to the standard V and I filters, conversion from the new i to the old filter was done using the relation derived in Ibata et al. (2013, in prep.).
In deriving magnitudes and colours, various uncertainties are included and appropriately combined. The instrumental magnitude uncertainties reported by IRAF are small, as the clusters are much brighter than the background sky. For GCs lying within the main optical bodies of their host dwarf galaxies, the main source of uncertainty comes from the local background, which is contaminated by resolved stars from the host galaxy as well as the underlying diffuse light. To assess the uncertainty in the background, we randomly placed 10 apertures around each cluster sampling the local sky. While the apertures include the resolved field star component and the diffuse light of the host dwarf galaxies, we excluded obvious contaminants such as background galaxies or foreground Milky Way stars. The sky apertures were chosen to have the same size as the magnitude and colour apertures that we used to photometer the GCs. We found the standard deviation of all 10 sky measurements around each cluster, and added this in quadrature to the instrumental and zero-point errors. Furthermore, every conversion between filters introduces an additional uncertainty to the derived magnitudes and colours that we account for as well.
5 Radial Velocities
Heliocentric radial velocities of the newly-discovered GCs were measured using a chi-squared minimisation technique between the GC spectra and spectra of high signal-to-noise radial velocity template stars and clusters (Veljanoski et al., 2013). This method is analogous to the standard cross-correlation technique, and produces similar results. The advantage of doing a chi-square minimisation is that this technique uses the uncertainties in both the template and target spectra, which helps to eliminate spurious features, and differentiate between genuine spectral lines and poorly subtracted sky lines, which might be important in the case of faint targets.
Because both ISIS arms were used during the observations, two independent velocity measurements could be made for each GC. The values reported in Table 5 represent the error-weighted averages of the individual measurements from the blue and red spectra. For comparison, the heliocentric radial velocities of NGC 147 and NGC 185 themselves are also shown (Geha et al., 2010).
| ID | Radial velocity [km/s] | Uncertainty [km/s] |
| NGC 147 | -193.1 | 0.8 |
| PA-N147-1 | -215 | 10 |
| PA-N147-2 | -219 | 10 |
| PA-N147-3 | -133 | 24 |
| NGC 185 | -203.8 | 1.1 |
| PA-N185 | -254 | 15 |
The measured velocities of the new GCs can be used as another indicator of whether they are bound to the dEs or to M31. The velocity dispersion of M31 halo GCs that lie beyond 70 kpc in projection is 50 km/s (Veljanoski et al., 2013). Given the large difference between the radial velocities of the new NGC 147 GCs and that of M31 (-301 4 km/s, Courteau & van den Bergh (1999)), it is likely that they are hosted by the dwarf galaxy. This is not the case for PA-N185, as the difference between it and the M31 velocity is comparable to the M31 outer halo GC velocity dispersion. However, when combined with the probability arguments presented earlier, the velocity measurements strengthen the conclusion that the new GCs are probably members of the dE systems and not the M31 halo.
It is interesting to point out that the cluster PA-N147-3 projects in position halfway between NGC 147 and the newly-discovered dwarf spheroidal Cass II (Conn et al. 2012, Irwin et al. in prep.). Furthermore, it has a similar radial velocity to Cass II, which is measured to be -145 3 km/s (Collins et al., 2013). It is therefore possible that this GC could be a satellite of Cass II instead of NGC 147, or else not bound to either system. We postpone a detailed kinematical analysis of GCs within the NGC 147/185 subgroup until a later publication.
6 Analysis
6.1 Ages and Metallicities
We derive age and metallicity estimates for the two cluster samples using our integrated optical and NIR photometry. In principle, one can determine accurate ages and metallicities of GCs with high quality spectroscopic data. However, our spectra have low signal-to-noise, and only two out of the four new GCs have spectra that are suitable for metallicity determination. Furthermore, as our goal is to present a homogeneous analysis of the sample, including objects for which we do not have spectra, we prefer to base our analysis on integrated photometry alone. Optical colours are well-known to suffer from an age-metallicity degeneracy, however the addition of near-IR measurements can greatly improve the situation (e.g. Puzia et al., 2002; Hempel et al., 2005; Chies-Santos et al., 2011). This is because of the different sensitivities to age and metallicity of the optical-optical and optical-near-IR colours. The optical -band is most sensitive to stars near the main sequence turn-off, the magnitudes of which are mostly driven by age. Conversely, the near-IR K band is most sensitive to red giant branch stars (Saviane et al., 2000; Yi et al., 2001). The - and -K colours have similar sensitivity to age, but -K measures the temperature of the red giant branch which more reflects metallicity than age. Plotting these colours on a colour-colour diagram and comparing to simple stellar population (SSP) model tracks allow us to derive estimates of the age and metal content of each GC.
Various SSP models have been constructed to date (e.g. Maraston, 1998; Bruzual & Charlot, 2003; Marigo et al., 2008; Vazdekis et al., 2010). Despite improvements over time, discrepancies still exist between models. One of the largest intrinsic uncertainties in SSP models comes from the limited understanding of certain phases of advanced stellar evolution such as the thermally-pulsating asymptotic giant branch (TP-AGB) phase. Different attempts to implement this phase have led to large differences in the near-IR fluxes. Stars in this phase are short-lived making calibration difficult (Girardi et al., 2010). Models having prominent TP-AGB phases cause the near-IR luminosity of objects to be overpredicted, but this only affects objects of young to intermediate ages (Kriek et al., 2010). Another problem related to each SSP model is the convergence of the isochrones in the metal poor regime which produces large uncertainties in the derived properties.
Figure 4 shows colour-colour diagrams constructed using the optical and near-IR photometry presented in Table 4. While the SSP model track shown here is from Marigo et al. (2008), we have checked that none of the results presented in this paper depend on the chosen SSP model. We resorted to using the native CFHT/Megacam rather than the more common Johnson/Cousins system in order to avoid uncertainties arising from the colour transformations, as the SSP model tracks were readily available for the CFHT/Megacam system. Figure 4 shows that all clusters with the exception of Hodge IV in NGC 147 are metal poor with [Fe/H] dex. If Hodge IV is as metal-rich as we infer, it would be rather interesting. However we note that it is the second faintest cluster in NGC 147 and appears irregular in shape in the MegaCam imaging (see Figure 2), while close to the detection limit in the near-IR data. Although one of the first clusters to be discovered in NGC 147 (Hodge, 1976), high resolution images of this object do not yet exist. Even with high quality ground-based data such as PAndAS, it is difficult to confirm it is a genuine GC and not, for example, an asterism in the NGC 147 field.

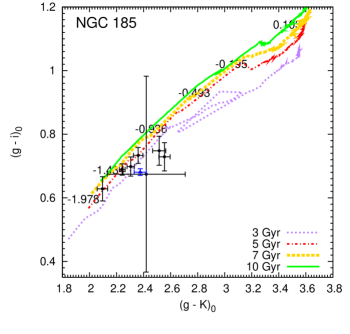
The ages of the clusters are more difficult to estimate. At face value, it appears that half of the GCs are old and half are of intermediate age. However, inspecting the clusters that lie on the young to intermediate age tracks, it is found that they are often located in or near the main bodies of their host galaxies. As discussed earlier, these regions are very crowded and often have strong non-linear background gradients that can skew the colours of the GCs. This is certainly an issue for Hodge I in NGC 147 which has a redder (K)0 colour than any of the tracks shown. The method of photometric age estimation is not particularly accurate even when free of these complications so we hesitate to claim we have found evidence for the presence of intermediate age GCs. Furthermore, due to the way the SSP model isochrones are calibrated, small changes in either of the colours used in Figure 4 will drastically affect their age estimates, while only minimally impacting their metallicity estimates.
Another outlier in Figure 4 is GC-SD10 in NGC 147 which has a redder and bluer (K)0 colour than any of the tracks. This object is the faintest out of all the clusters known in the two dEs and was not detected in our K band imaging. The quoted K band magnitude represents an upper limit, suggesting that the actual (K)0 colour must lie blueward of the point in in Figure 4. Although these colours seem unusual, GC-SD10 has been spectroscopically confirmed by Sharina & Davoust (2009) as a GC in NGC 147. Finally, even though the measured colours put FJJ III on the model tracks on Figure 4, the accompanying uncertainties make constraining the age and metallicity of this cluster nearly impossible.
An alternative way to determine the metallicities of GCs is to use empirical colour-metallicity relations. We adopt the relationship derived by Kissler-Patig et al. (2002) (eq. 1), calibrated using 129 M31 globulars that have (B-V) 0.27, to further constrain the metal content of the NGC 147 and NGC 185 GC systems. This relationship is valid over the interval [Fe/H] dex.
| (1) |
| ID | [Fe/H](a) | [Fe/H](b)1 | [Fe/H](c)1 | [Fe/H](d)2 |
|---|---|---|---|---|
| [dex] | [dex] | [dex] | [dex] | |
| Hodge I | -1.3 0.4 | -1.9 0.15 | -1.0 0.5 | … |
| Hodge II | -1.7 0.4 | -2.5 0.25 | -1.6 0.5 | … |
| Hodge III | -2.1 0.3 | … | -1.8 0.5 | -2.0 0.1 |
| Hodge IV | -0.7 0.4 | … | … | … |
| GC-SD5 | -2.2 0.3 | … | -1.7 0.3 | … |
| GC-SD7 | -1.8 0.3 | … | -1.6 0.2 | … |
| GC-SD10 | -1.9 0.4 | … | … | … |
| PA-N147-1 | -2.0 0.3 | … | … | … |
| PA-N147-2 | -1.9 0.3 | … | … | … |
| PA-N147-3 | … | … | … | … |
| FJJ I | -1.3 0.4 | -1.4 0.10 | -1.2 0.4 | -1.6 0.2 |
| FJJ II | -1.4 0.4 | -1.2 0.25 | … | -2.1 0.2 |
| FJJ III | -1.5 0.5 | -1.7 0.15 | -1.4 0.6 | -2.0 0.1 |
| FJJ IV | -2.1 0.3 | -2.5 0.25 | -1.6 0.5 | -2.0 0.2 |
| FJJ V | -1.8 0.3 | -1.8 0.15 | -1.1 0.6 | -1.5 0.1 |
| FJJ VII | -1.7 0.4 | … | -0.4 0.6 | … |
| FJJ VIII | -1.9 0.3 | … | -1.1 0.9 | … |
| PA-N185 | -1.6 0.4 | … | … | … |
Table 6 shows the metallicities derived with the above relation and affirms our conclusion that the clusters are all indeed metal poor. Although we do not use our spectra to derive metallicities here, we note that the similarly strong Balmer lines visible in Figure 1 for PA-N147-1 and PA-N147-2 supports the similar metallicities derived from their broadband colours. There is also a hint at a radial metallicity trend with GCs with projected radii kpc having systematically lower [Fe/H] values by dex compared to the central population. For comparison, Table 6 also shows metallicities for some of the previously-known GCs derived from spectroscopic studies (Da Costa & Mould, 1988; Sharina et al., 2006; Sharina & Davoust, 2009), and from colour-magnitude diagram isochrone fitting (Sharina et al., 2006). There is generally a good agreement with past studies, lending further confidence to our metallicity estimates. The only exception is FJJ VII in NGC 185 for which a difference larger than 1 dex is seen between our measurements and the spectroscopic measurements of Sharina et al. (2006). We currently have no explanation for this.
6.2 Comparison to other Dwarf Elliptical Galaxies
An oft-used statistic when comparing GC systems hosted by different galaxies is the GC specific frequency, , where is the total number of GCs in the system, and is the integrated absolute V magnitude of the host galaxy (Harris & van den Bergh, 1981). This quantity can be thought of as the formation efficiency of GCs relative to field stars, although the interpretation is more complicated if one considers that fractions of these populations may have been accreted rather than formed in situ. In the case of dwarf galaxies, the globular cluster specific frequency is poorly constrained at present due to incompleteness in terms of imaging and GC detection, but it is critical for understanding what kinds of dwarf galaxies may contribute GCs to the halos of more massive systems. Significant effort has been made to constrain this value for dEs and past surveys have focused mainly on dwarf galaxies that reside in dense environments, such as the Fornax and Virgo clusters (Durrell et al., 1996; Miller et al., 1998; Lotz et al., 2004; Miller & Lotz, 2007; Peng et al., 2008). The study by Miller & Lotz (2007) found an overall trend of increasing with increasing (decreasing galaxy luminosity), which has also been found in dwarf irregulars although with smaller samples (Seth et al., 2004; Georgiev et al., 2008, 2010). Peng et al. (2008) find dwarf galaxies with the highest values in their sample to be within 1 Mpc of the Virgo cluster core, which they interpret as an environmental effect. However, these authors also find that dEs within 40 kpc of the most massive galaxies in the Virgo cluster have few or no GCs, suggesting that they have probably been stripped away by the tidal forces from the central hosts.
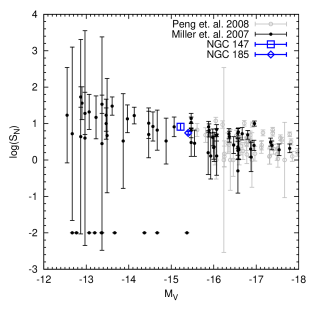
Using our updated GC census, the specific frequencies for NGC 147 and NGC 185 were recalculated and found to be 8 2 and 5.50.5, respectively. This is a slight increase from the previous values which were for NGC 147 and for NGC 185. The uncertainties quoted for NGC 147 allow for the possibility of Hodge IV and SD-10 not being genuine GCs, as well as the uncertainty in the galaxy luminosity. In the case of NGC 185, only the uncertainty in the galaxy luminosity was taken into account. Figure 5 shows the versus values for dEs observed in the Fornax and Virgo clusters and in the Leo group, taken from the studies of Miller & Lotz (2007) and Peng et al. (2008). The error bars are due to the uncertainty in the host galaxy luminosity and the uncertainty in the total number of GCs found around each galaxy, which has been corrected for background contaminants and spatial incompleteness. On the same figure overplotted are the updated values for NGC 147 and NGC 185. The values are within the range found for dEs of comparable luminosity observed by Miller & Lotz (2007), albeit residing in different environments, and appear to follow the trend of increasing value with decreasing galaxy luminosity.
Another interesting property shared by the GC systems of NGC 147 and NGC 185, and the GC systems of dE galaxies found in rich environments, is their optical colours. The mean (V-I)0 colours of NGC 147 and NGC 185 GCs are 0.85 and 0.84 with standard deviations of 0.09 and 0.03 respectively. In their study of dEs in the Fornax and Virgo galaxy clusters, Lotz et al. (2004) have reported the peak of the mean (V-I)0 colour distribution to be 0.90 for galaxies with absolute magnitudes between -15.0 and -16.0, and 0.85 for galaxies with absolute magnitude between -14.0 and -15.0. This makes the GC systems of NGC 147 and NGC 185 nearly indistinguishable from those hosted by similar luminosity dEs in rich clusters, suggesting that the large-scale present day environment has little impact on either or mean optical colour.
6.3 Comparison to M31 Halo Globular Clusters
Detailed surveys (e.g. Ferguson et al., 2002; McConnachie et al., 2009; Richardson et al., 2011) have revealed complex substructure in the halo of M31, consisting of loops, streams and filaments. This inhomogeneous halo is thought to have formed over an extended period of time via the accretion and disruption of dwarf galaxies. M31 also hosts an extended population of GCs, with clusters found up to distances of 200 kpc from its centre (Mackey et al., 2010a; Huxor et al., 2011). Evidence that the outer halo GC system may have formed predominantly by accretion was hinted at by the radial number density profile (see Figure 7 in Huxor et al. (2011)). The profile has the form of a broken power law, with characteristic flattening occurring beyond a projected radius of 30 kpc. Such a behaviour is found in the stellar halos of simulated galaxies that form via a combination of accretion and in situ star formation (Abadi et al., 2006), with the break in the power law marking the point beyond which the bulk of the matter has been accreted.
More compelling evidence for an accretion origin comes from the fact that GCs in the outer halo are spatially-correlated with the extended substructure of M31 (Mackey et al., 2010b). Statistical tests have shown that GCs preferentially project on top of stellar streams, with the probability of this being due to chance alignment being less than 1%. On this basis, it is argued that over 80% of the GCs found beyond 30 kpc from the centre of M31 have probably been donated by captured and disrupted dwarf galaxies. The fact that there is a significant number of dwarf galaxies in the halo of M31 (Richardson et al., 2011), where a few of the more luminous satellites are known to host GCs, shows that the halo is still actively evolving.
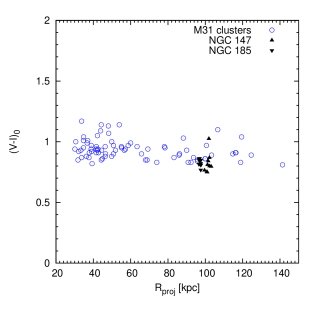
If the majority of the M31 halo GCs were indeed donated by captured dwarf galaxies, it might be expected that they share the some properties with the GCs hosted by NGC 147 and NGC 185. Figure 6 displays the (V-I)0 colours as a function of Rproj from the centre of M31 for the GCs hosted by NGC 147 and NGC 185. We also show confirmed M31 GCs that have Rproj >30 kpc taken from the Revised Bologna Catalogue (Galleti et al., 2004) and Huxor et al. 2013 (in prep). The M31 GCs have been de-reddened using extinction coefficients from Schlegel et al. (1998). One can see that the GCs found around the two dwarf galaxies fit comfortably in the range of (V-I)0 colours measured for their M31 halo counterparts. Although this does not prove that the M31 halo GCs have been accreted by systems like NGC 147 and NGC 185, it demonstrates that this idea is not inconsistent with the data. In terms of the number of GCs they currently host, only about 8 NGC 147 or 185 systems would be needed to create almost the entire M31 halo GC population that consists of 80 clusters. Such accretions would also donate L⊙ of stellar light, consistent with estimates of the halo luminosity (Irwin et al., 2005).
7 Summary
We have presented the results of a new search for remote GCs around the M31 satellites, NGC 147 and NGC 185, using data from PAndAS. The search resulted in the discovery of four new GCs, three of which are located close to NGC 147, while one is near NGC 185. Probability arguments and newly obtained radial velocities indicate that these objects are likely to belong to the dwarfs and not the M31 halo. Our findings serve as another example of the importance of studying galaxies beyond their optical boundaries.
We present the first homogeneous optical and near-IR photometry for the entire GC systems of these two dwarf galaxies. We use this to constrain the GC ages and metallicities via the use of colour-colour plots and empirical colour-metallicity relations, finding that, in general, the clusters are old and metal poor ([Fe/H] dex).
The mean colours of the GCs hosted by NGC 147 and NGC 185 are found to lie at the peak of the colour distribution of the GC systems belonging to dEs in the Fornax and Virgo galaxy clusters, despite a large difference in the environments in which they reside. Their values are consistent with the trend of increasing GC specific frequency with decreasing galaxy luminosity generally observed for dwarf galaxies, regardless of their type, and in a variety of environments. The close similarity between the (V-I)0 colours of the GCs belonging to these two dwarf galaxies and those belonging to the M31 outer halo is consistent with the idea that accretion of the former could have contributed to the assembly of the latter.
Acknowledgments
The work of APH was partially supported by Sonderforschungsbereich SFB 881 “The Milky Way System” of the German Research Foundation (DFG). ADM is grateful for support from the Australian Research Council through an Australian Research Fellowship (Discovery Projects grant: DP1093431). We thank the CFHT staff for their support and helpfulness throughout the PAndAs project. Based on observations obtained with MegaPrime/MegaCam, a joint project of CFHT and CEA/DAPNIA, at the Canada-France-Hawaii Telescope (CFHT) which is operated by the National Research Council (NRC) of Canada, the Institut National des Science de l’Univers of the Centre National de la Recherche Scientifique (CNRS) of France, and the University of Hawaii. This work is based in part on data products produced at TERAPIX and the Canadian Astronomy Data Centre as part of the Canada-France-Hawaii Telescope Legacy Survey, a collaborative project of NRC and CNRS. Based on observations made with the 4.2m William Herschel Telescope operated on the island of La Palma by the Isaac Newton Group in the Spanish Observatorio de Roque de los Muchachos of the Instituto de Astrofisica de Canarias. The United Kingdom Infrared Telescope is operated by the Joint Astronomy Centre on behalf of the Science and Technology Facilities Council of the U.K.
References
- Abadi et al. (2006) Abadi M. G., Navarro J. F., Steinmetz M., 2006, MNRAS, 365, 747
- Baade (1944) Baade W., 1944, ApJ, 100, 147
- Battinelli & Demers (2004) Battinelli P., Demers S., 2004, AAP, 417, 479
- Bellazzini et al. (2003) Bellazzini M., Ferraro F. R., Ibata R., 2003, AJ, 125, 188
- Bender et al. (1991) Bender R., Paquet A., Nieto J.-L., 1991, AAp, 246, 349
- Bertin (2009) Bertin E., 2009, MEMSAI, 80, 422
- Boulade et al. (2003) Boulade O. et al., 2003, in Iye M., Moorwood A. F. M., eds, Society of Photo-Optical Instrumentation Engineers (SPIE) Conference Series Vol. 4841, Society of Photo-Optical Instrumentation Engineers (SPIE) Conference Series. pp 72–81
- Brodie & Strader (2006) Brodie J. P., Strader J., 2006, ARAA, 44, 193
- Bruzual & Charlot (2003) Bruzual G., Charlot S., 2003, MNRAS, 344, 1000
- Butler & Martínez-Delgado (2005) Butler D. J., Martínez-Delgado D., 2005, AJ, 129, 2217
- Casali et al. (2007) Casali M. et al., 2007, AAp, 467, 777
- Chies-Santos et al. (2011) Chies-Santos A. L., Larsen S. S., Kuntschner H., Anders P., Wehner E. M., Strader J., Brodie J. P., Santos J. F. C., 2011, AAP, 525, A20+
- Cioni et al. (2008) Cioni M.-R. L. et al., 2008, AAP, 487, 131
- Collins et al. (2013) Collins M. L. M. et al., 2013, ArXiv e-prints
- Conn et al. (2012) Conn A. R. et al., 2012, ApJ, 758, 11
- Corwin et al. (1994) Corwin Jr. H. G., Buta R. J., de Vaucouleurs G., 1994, AJ, 108, 2128
- Courteau & van den Bergh (1999) Courteau S., van den Bergh S., 1999, AJ, 118, 337
- Da Costa & Mould (1988) Da Costa G. S., Mould J. R., 1988, ApJ, 334, 159
- Davidge (2005) Davidge T. J., 2005, AJ, 130, 2087
- Deveikis et al. (2008) Deveikis V., Narbutis D., Stonkutė R., Bridžius A., Vansevičius V., 2008, Baltic Astronomy, 17, 351
- Dotter et al. (2011) Dotter A., Sarajedini A., Anderson J., 2011, ApJ, 738, 74
- Durrell et al. (1996) Durrell P. R., Harris W. E., Geisler D., Pudritz R. E., 1996, AJ, 112, 972
- Ferguson et al. (2002) Ferguson A. M. N., Irwin M. J., Ibata R. A., Lewis G. F., Tanvir N. R., 2002, AJ, 124, 1452
- Ford et al. (1977) Ford H. C., Jacoby G., Jenner D. C., 1977, ApJ, 213, 18
- Galleti et al. (2004) Galleti S., Federici L., Bellazzini M., Fusi Pecci F., Macrina S., 2004, AAp, 416, 917
- Geha et al. (2010) Geha M., van der Marel R. P., Guhathakurta P., Gilbert K. M., Kalirai J., Kirby E. N., 2010, ApJ, 711, 361
- Geisler et al. (1999) Geisler D., Armandroff T., da Costa G., Lee M. G., Sarajedini A., 1999, in P. Whitelock & R. Cannon ed., IAU Symposium Vol. 192, The Stellar Content of Local Group Galaxies. p. 231
- Georgiev et al. (2008) Georgiev I. Y., Goudfrooij P., Puzia T. H., Hilker M., 2008, AJ, 135, 1858
- Georgiev et al. (2010) Georgiev I. Y., Puzia T. H., Goudfrooij P., Hilker M., 2010, MNRAS, 406, 1967
- Gilbert et al. (2012) Gilbert K. M. et al., 2012, ApJ, 760, 76
- Girardi et al. (2010) Girardi L. et al., 2010, ApJ, 724, 1030
- Harris (1996) Harris W. E., 1996, AJ, 112, 1487
- Harris & van den Bergh (1981) Harris W. E., van den Bergh S., 1981, AJ, 86, 1627
- Hempel et al. (2005) Hempel M., Geisler D., Hoard D. W., Harris W. E., 2005, AAp, 439, 59
- Hodge (1974) Hodge P. W., 1974, PASP, 86, 289
- Hodge (1976) Hodge P. W., 1976, AJ, 81, 25
- Hodgkin et al. (2009) Hodgkin S. T., Irwin M. J., Hewett P. C., Warren S. J., 2009, MNRAS, 394, 675
- Huxor et al. (2011) Huxor A. P. et al., 2011, MNRAS, p. 452
- Huxor et al. (2012) Huxor A. P., Ferguson A. M. N., Veljanoski J., Mackey A. D., Tanvir N. R., 2012, MNRAS, p. 311
- Huxor et al. (2008) Huxor A. P., Tanvir N. R., Ferguson A. M. N., Irwin M. J., Ibata R., Bridges T., Lewis G. F., 2008, MNRAS, 385, 1989
- Hwang et al. (2011) Hwang N., Lee M. G., Lee J. C., Park W.-K., Park H. S., Kim S. C., Park J.-H., 2011, ApJ, 738, 58
- Ibata et al. (2007) Ibata R., Martin N. F., Irwin M., Chapman S., Ferguson A. M. N., Lewis G. F., McConnachie A. W., 2007, ApJ, 671, 1591
- Irwin et al. (2005) Irwin M. J., Ferguson A. M. N., Ibata R. A., Lewis G. F., Tanvir N. R., 2005, ApJL, 628, L105
- Irwin et al. (2004) Irwin M. J. et al., 2004, in Quinn P. J., Bridger A., eds, Society of Photo-Optical Instrumentation Engineers (SPIE) Conference Series Vol. 5493, Society of Photo-Optical Instrumentation Engineers (SPIE) Conference Series. pp 411–422
- Jang et al. (2012) Jang I. S., Lim S., Park H. S., Lee M. G., 2012, ApJL, 751, L19
- King (1962) King I., 1962, AJ, 67, 471
- Kissler-Patig et al. (2002) Kissler-Patig M., Brodie J. P., Minniti D., 2002, AAp, 391, 441
- Koposov et al. (2007) Koposov S. et al., 2007, ApJ, 669, 337
- Kriek et al. (2010) Kriek M. et al., 2010, ApJL, 722, L64
- Law & Majewski (2010) Law D. R., Majewski S. R., 2010, ApJ, 718, 1128
- Lee et al. (1993) Lee M. G., Freedman W. L., Madore B. F., 1993, Aj, 106, 964
- Lewis et al. (2013) Lewis G. F. et al., 2013, ApJ, 763, 4
- Lotz et al. (2004) Lotz J. M., Miller B. W., Ferguson H. C., 2004, ApJ, 613, 262
- Mackey et al. (2010a) Mackey A. D. et al., 2010a, MNRAS, 401, 533
- Mackey et al. (2006) Mackey A. D. et al., 2006, ApJL, 653, L105
- Mackey et al. (2010b) Mackey A. D. et al., 2010b, ApJL, 717, L11
- Manchado et al. (2004) Manchado A. et al., 2004, in Moorwood A. F. M., Iye M., eds, Society of Photo-Optical Instrumentation Engineers (SPIE) Conference Series Vol. 5492, Society of Photo-Optical Instrumentation Engineers (SPIE) Conference Series. pp 1094–1104
- Maraston (1998) Maraston C., 1998, MNRAS, 300, 872
- Marigo et al. (2008) Marigo P., Girardi L., Bressan A., Groenewegen M. A. T., Silva L., Granato G. L., 2008, AAp, 482, 883
- Martínez-Delgado et al. (1999) Martínez-Delgado D., Aparicio A., Gallart C., 1999, AJ, 118, 2229
- McConnachie (2012) McConnachie A. W., 2012, AJ, 144, 4
- McConnachie et al. (2010) McConnachie A. W., Ferguson A. M. N., Irwin M. J., Dubinski J., Widrow L. M., Dotter A., Ibata R., Lewis G. F., 2010, ApJ, 723, 1038
- McConnachie et al. (2005) McConnachie A. W., Irwin M. J., Ferguson A. M. N., Ibata R. A., Lewis G. F., Tanvir N., 2005, MNRAS, 356, 979
- McConnachie et al. (2009) McConnachie A. W., Irwin M. J., Ibata R. A. e., 2009, Nature, 461, 66
- Miller & Lotz (2007) Miller B. W., Lotz J. M., 2007, ApJ, 670, 1074
- Miller et al. (1998) Miller B. W., Lotz J. M., Ferguson H. C., Stiavelli M., Whitmore B. C., 1998, ApJL, 508, L133
- Peng et al. (2008) Peng E. W. et al., 2008, ApJ, 681, 197
- Puzia et al. (2002) Puzia T. H., Zepf S. E., Kissler-Patig M., Hilker M., Minniti D., Goudfrooij P., 2002, AAp, 391, 453
- Regnault et al. (2009) Regnault N. et al., 2009, AAp, 506, 999
- Richardson et al. (2011) Richardson J. C. et al., 2011, ApJ, 732, 76
- Salaris & Cassisi (2006) Salaris M., Cassisi S., 2006, The Observatory, 126, 306
- Saviane et al. (2000) Saviane I., Rosenberg A., Piotto G., Aparicio A., 2000, AAp, 355, 966
- Schlegel et al. (1998) Schlegel D. J., Finkbeiner D. P., Davis M., 1998, ApJ, 500, 525
- Seth et al. (2004) Seth A., Olsen K., Miller B., Lotz J., Telford R., 2004, AJ, 127, 798
- Sharina et al. (2006) Sharina M., Afanasiev V., Puzia T., 2006, Monthly Notices of the Royal Astronomical Society, 372, 1259
- Sharina & Davoust (2009) Sharina M., Davoust E., 2009, AAp, 497, 65
- van den Bergh (1998) van den Bergh S., 1998, AJ, 116, 1688
- Vazdekis et al. (2010) Vazdekis A., Sánchez-Blázquez P., Falcón-Barroso J., Cenarro A. J., Beasley M. A., Cardiel N., Gorgas J., Peletier R. F., 2010, MNRAS, 404, 1639
- Veljanoski et al. (2013) Veljanoski J. et al., 2013, ApJL, 768, L33
- Watkins et al. (2013) Watkins L. L., Evans N. W., van de Ven G., 2013, MNRAS, p. 672
- West et al. (2004) West M. J., Côté P., Marzke R. O., Jordán A., 2004, Nature, 427, 31
- Yi et al. (2001) Yi S., Demarque P., Kim Y.-C., Lee Y.-W., Ree C. H., Lejeune T., Barnes S., 2001, ApJS, 136, 417
- Young (2001) Young L. M., 2001, AJ, 122, 1747
- Young & Lo (1997) Young L. M., Lo K. Y., 1997, ApJ, 476, 127
Chapter \thechapter
Appendix A Review of the Literature on the NGC 147 and NGC 185 GC Systems
The following is a short review of the discovery history and the nomenclature of the GCs hosted by NGC 147 and NGC 185. The motivation for this is to highlight some inconsistencies in the literature that we discovered while this paper was in preparation. By doing so, we hope to minimise the possibility of future confusion when studying the GCs of these two dEs.
The existence of GCs in both NGC 147 and NGC 185 was first reported by Baade (1944), who discovered two globulars in each of the galaxies. In his paper, the clusters were not named and coordinates were provided only for the ones hosted by NGC 185 and in terms of relative positions (measured on photographic plates) from the galaxy centre.
Hodge (1974) reported the discovery and presented photometry of five GCs in NGC 185, two of which were those previously discovered by Baade (1944). These clusters were simply labelled 1-5. While their coordinates were not provided, a finding chart was shown.
Two years later, Hodge (1976) published a paper on the structure of NGC 147, in which the discovery and photometry of two additional GCs bound to this galaxy were presented, alongside the two clusters previously discovered by Baade (1944). Once again, no coordinates for any of these objects were given, but a finding chart was published, on which the clusters are labelled 1-4. In the literature, these clusters are now known as Hodge I-IV.
In an Appendix to their paper on planetary nebulae in NGC 147 and NGC 185, Ford et al. (1977) revisited the GC systems of the two dEs. In addition to the GCs already discovered by Baade and Hodge around NGC 185, they presented the discovery of an additional four clusters from their photographic plates, while also discarding the object labelled by Hodge (1974) as “2” as a GC. In Ford et al. (1977), the objects are numbered I-VIII but the counting does not follow the pattern started by Hodge (1974). This nomenclature has propagated through the literature, and these clusters are referred to as FJJ I-VIII in recent publications. In addition, equatorial coordinates together with a finding chart were also published for the entire sample of GCs described by Ford et al. (1977).
Ford et al. (1977) also revisited the GC system of NGC 147. They recovered the objects already identified by Hodge (1976) as globulars and did not find any new members belonging to this system. They showed a finding chart and a table with equatorial coordinates for the three brightest globulars in this galaxy. Their finding chart is identical to the one published by Hodge (1976) in terms of the labelling and positions of the GCs: Hodge II is south of Hodge I and Hodge III is south of Hodge II. However, in their Table 9 that lists the clusters’ coordinates, the positions of Hodge II and Hodge III are swapped: Hodge II is listed to be south of Hodge III. This unintentional oversight is most probably the main reason for many inconsistencies in the more recent literature.
A paper published by Da Costa & Mould (1988) presented spectroscopic data and metal abundances of the GCs hosted by NGC 147 and NGC 185. Regarding the NGC 185 system, they presented V-band photometry taken from Hodge (1974) and spectroscopic data for clusters FJJ I-V, as well as Hodge 2 that Ford et al. (1977) classified not to be a cluster. For cluster FJJ IV which was not listed amongst the GC candidates by Hodge (1974) the V magnitude was estimated by eye. Analysing the cluster spectra, Da Costa & Mould (1988) showed that Hodge 2 is indeed a galaxy at redshift and not a GC.
Regarding the NGC 147 system, Da Costa & Mould (1988) took spectra only of Hodge I and Hodge III. In their Table 1 they listed the photometric V magnitude of these two clusters as reported by Hodge (1976). They did not list coordinates for any of the clusters but stated that the centres of the clusters were taken from Ford et al. (1977). This probably means that they presented metal abundances of Hodge II rather than Hodge III. There was no indication that Da Costa & Mould (1988) noticed the oversight made by Ford et al. (1977), and in Table 6 in our paper it is assumed that they have not.
Geisler et al. (1999) observed all but one cluster in NGC 185 with the HST, that were known at that time. The cluster which was not observed was FJJ VIII. They found that FJJ VI is not a GC but an elliptical galaxy. All other cluster candidates that were observed were confirmed to be genuine GCs.
In more recent literature, Sharina et al. (2006) revisited the GC systems of NGC 147 and NGC 185 using HST/WFPC2 imagery and spectroscopy taken with the SCORPIO spectrograph. They did not provide coordinates for any of the clusters, but they did provide finding charts. In the case of NGC 147, they had the positions of Hodge II and Hodge III reversed compared to the original publication by Hodge (1976), so it is highly likely the data and results presented for Hodge II actually refer to Hodge III and vice versa. In their Table 2, they have taken the V magnitudes of what they label as Hodge I and Hodge III from the original paper by Hodge (1976), while the V magnitude of their Hodge II is taken from Hodge (1974) even though this paper analysed only clusters hosted by NGC 185 and did not list photometric values for any cluster in NGC 147. This made the cluster they label as Hodge II brighter than Hodge III, which is easily seen not to be the case with simple visual inspection of their HST images.
The most recent publication regarding the NGC 147 GC system is by Sharina & Davoust (2009). In their paper they announced the discovery of three new GCs. They presented a coordinate table and a finding chart, both having correct positions compared to the original Hodge (1976) publication regarding the “classical Hodge” clusters. However, it was not stated that there are differences in the positions compared to Sharina et al. (2006). It is also possible that any values they cited from the Sharina et al. (2006) paper might be assigned to the wrong object.
Finally, in our paper we report the discovery of another three GCs hosted by NGC 147, and one hosted by NGC 185. Interestingly, all three of the new GCs in NGC 147 lie beyond areas previously imaged for GC searches, while the new GC in NGC 185 lies within the photographic plate region searched by Ford et al. (1977). We speculate that the outlying nature of this object coupled with its low luminosity caused it to be missed in the original study. The tables we present here reflect the original naming and correct coordinates for all previously-known GCs, as well as these new discoveries.