Regular quantum plasmons in segments of graphene nanoribbons
Abstract
Graphene plasmons have advantages over noble metal plasmons, such as high tunability and low loss. However, for graphene nanostructures smaller than 10 nm, little is known about their plasmons or whether a regular plasmonic behavior exists, despite their potential applications. Here, we present first-principles calculations of plasmon excitations in zigzag graphene nanoribbon segments. Regular plasmonic behavior is found: Only one plasmon mode exists in the low-energy regime (1.5 eV). The classical electrostatic scaling law still approximately holds when the width () is larger than 1.5 nm but totally fails when 1.5 nm due to quantum effects. The scaling with different doping densities shows that the plasmon is nearly free-electron plasmon instead of Dirac plasmon.
pacs:
36.40.Gk, 73.20.Mf, 73.22.LPCollective electron oscillations in nanostructures form the localized surface plasmon resonance upon interaction with light. This resonance can confine electromagnetic energy down to deep sub-wavelength regions (truly nano-meter scales) and, consequently, enhance the intensity of an incident light wave by several orders of magnitude. Therefore, it is finding promising applications of a wide range, such as nonlinear optics Danckwerts and Novotny (2007); Ozbay (2006), single-molecule sensing Talley et al. (2005), and optical harvesting of nanometer-sized objects Juan et al. (2011).
For traditional noble metal plasmon, its frequency is difficult to tune since the electron density cannot be altered. Additionally, the plasmon scattering time in metals is usually very short (typically tens of femtoseconds) and thus the plasmons decay quickly. These drawbacks limit the performance of metamaterials and transformation optical devices Boltasseva and Atwater (2011) and greatly motivate people to explore plasmons in a newly available material with unique properties Geim and Novoselov (2007): graphene. Its unique electronic properties are mainly due to the very peculiar band structure, with the and bands showing linear dispersion around the Fermi level, where they touch with each other at a single point in the Brillouin zone Geim (2009); Zhang et al. (2005). Graphene can be driven away from the charge neutrality point (CNP) and tuned into a metallic regime by applying a voltage externally Novoselov et al. (2004) or electric gating Wang et al. (2008). Fermi energies of the order of 1 eV from the CNP are currently attainable Efetov and Kim (2010), which corresponds to electron doping densities up to 1014cm-2. Compared to noble-metal plasmons, graphene plasmon possesses outstanding advantages, such as highly tunable frequency, reduced loss, and also much larger oscillator strength compared to plasmons of semiconductor 2-dimensional electron gas (2DEG) Jablan et al. (2009); Ju et al. (2011).
Recently, plasmon resonances in graphene have been probed using inelastic electron scattering spectroscopy Liu et al. (2008); Tegenkamp et al. (2011) and inelastic scanning tunnelling microscopy Brar et al. (2011). The electrostatic tunability of graphene plasmons has been demonstrated by the terahertz light absorption in engineered microribbon arrays Ju et al. (2011) and the infrared scattering strength of a tip situated near graphene Fei et al. (2011). All of these pioneering work mainly focused on systems with biggish dimensions, whose plasmon frequencies are believed to obey the electrostatic scaling law (ESL) Ju et al. (2011); Thongrattanasiri et al. (2012): with and being the width and carrier density of the system, respectively. This scaling law stems from the nature of 2DEG of the massless Dirac electrons. Besides the graphene microstructures and arrays of big sizes, very recently some small graphene nanostructures, like graphene nanoisland, have also been synthesized Phark et al. (2011). These small graphene clusters may be chemically doped and could have promising applications, for example, for achieving optical sensing of chemical changes in a fluid surrounding the cluster. To have a high sensitivity, these graphene nanoclusters should be made as small as possible so that the adding or removing of one single electron will cause a large change in the carrier density and inducing observable plasmon shifts.
Unlike graphene nanostructures larger than 10 nm where the plasmonic behavior may be still described by the classical electrodynamics Thongrattanasiri et al. (2012), graphene nanoclusters smaller than 10 nm may have quite different behavior due to the quantum confinement effects and their discrete energy levels instead of continuous energy bands present in periodic structures. As a result, the classical ESL relation may fail. Therefore, it is interesting to explore the new phenomena in the quantum regime and the physics underlying. So far, some computational studies Thongrattanasiri et al. (2012) based on the -only tight-binding modeling have been reported for circular graphene nanodisks with diameters from 2 to 24 nm. It was found that when the diameter of a nearly circular disk is smaller than 10 nm, its plasmonic behavior is very irregular, showing many scattered resonance peaks in the energy window of 0 – 0.6 eV probably due to the complicated irregular edge geometry. This largely limits its potential applications. Therefore, finding small graphene nanostructures with regular plasmonic behavior is desirable.
Another interesting question concerning graphene nanostructures is the nature of their plasmons. For graphene microribbons, the plasmon is believed to be Dirac plasmon due to the linear dispersion Ju et al. (2011). Down to the nanometer scales as in the case of graphene nanoribbons, this linear dispersion will not hold. Additionally, electron doping may not only shift the position of the Fermi level but also change the electronic structure. Recent ab initio band-structure calculations for graphene and graphane nanoribbons showed that a heavy doping may lower the energy of the nearly free-electron states to the vicinity of the Fermi level Liu et al. (2011); Hu et al. (2010). All these factors will affect the plasmonic behavior of graphene nanostructures and the nature of their plasmons is still an open question to answer.
In this work, we present, for the first time to our best knowledge, a full first-principles study of plasmon excitations in doped zigzag graphene nanoribbon segments (ZGNRSs) of different widths and doping densities by using the time-dependent density functional theory (TDDFT) calculation which have been extensively used for studying electronic excitations in nanostructures Wang et al. (2012); Lehtovaara et al. (2011); Marinopoulos et al. (2002, 2003); Tachikawa et al. (2009); Gao and Yuan (2011); Yan and Gao (2008). Our calculation shows that the plasmonic behavior of ZGNRSs is very regular: The photoabsorption spectra show only three peaks in the energy window of 0 – 1.5 eV and only the lowest one is due to the plasmon excitation, as revealed directly by the frequency-resolved induced charge density (FRID). The frequency of the only plasmon mode () as a function of the doping density () and ribbon width () is investigated. The variation with tends to approach the classical ESL Hwang and Sarma (2007); Ju et al. (2011) when nm but shows a totally different behavior when nm because of a dominant quantum effect. The variation with shows that the plasmon in ZGNRSs is nearly free-electron plasmon instead of Dirac plasmon.
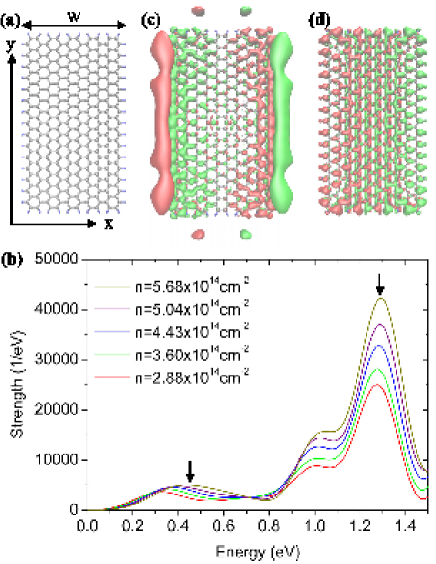
The computational details of our work are as follows. We study ZGNRSs of different widths () which can be also denoted by the number of the zigzag carbon chains () contained (labeled by -ZGNRS). In this work, =2, 4, 6, 8, and 10 with corresponding width being 5.12, 9.38, 13.64, 17.90, and 22.16Å, respectively, are considered. The length-width ratio is chosen to be about 2 (see Fig.1(a) for the structure of the 10-ZGNRS; Different length-width ratios are also checked and no qualitative effect is found). The edges of the ZGNRSs are saturated by H atoms. The ZGNRSs are placed in the -plane with zigzag chains being in the -direction (see Fig. 1(a)). A perturbation caused by an impulse field is applied along -axis to activate dipole oscillations. Different doping densities of the order of 1014 cm-2 are considered (see Fig. 1(b)) since undoped ZGNRSs do not show visible plasmon resonances. We note that the minimum doping density required to obtain a visible plasmon oscillation decreases with the increasing .
Our calculations are carried out with the TDDFT implemented in the real space and real time Marques et al. (2003). The carbon and hydrogen atoms are described by the Troullier-Martins pseudopotentials Troullier and Martins (1991) and the local density approximation (LDA) and the adiabatic LDA are adopted to describe the electron exchange and correlation for the ground-state and excited-state calculations, respectively. This scheme has been extensively tested and used in predicting the photoabsorption and plasmon resonances of clusters Vasiliev et al. (1999); Onida et al. (2002); Marinopoulos et al. (2002); Yan and Gao (2008); Wang et al. (2012). Technically, a grid in real space which is defined by assigning a sphere around each atom with a radius of 6Å and a uniform mesh grid of 0.3Å is adopted to describe the wavefunction and charge density. To obtain the excitation spectrum, the system is impulsed from its initial ground state with a very short delta-function-like perturbation, and then the time-dependent Kohn-Sham equation is evolved in the real space and real time for a certain period of time. Specifically, an electronic wave packet is evolved for 10,000 time steps with each being 0.003 /eV long. After the real-time propagation, the photoabsorption spectrum is extracted by Fourier transforming the time-dependent dipole strength. Furthermore, a 3D image of the FRID distribution is obtained for each resonance in the spectrum. This is achieved by Fourier transforming the time series of the total induced charge density at each resonance frequency for every real-space mesh grid.
Fig. 1(b) shows photoabsorption spectra for the 10-ZGNRS with different electron doping density (). The first thing to note is that there are only three peaks in the energy window 0 – 1.5 eV. Along with the increase of , the frequency of the two high-energy peaks do not change while the low-energy peak bluesifts remarkably. The different behavior with the varying reflects different natures for the two kinds of resonance. As described by the ESL, the plasmon frequency of a 2DEG should bluesift as increases, indicating that the low-energy resonance may be due to plasmon excitation while the high-energy resonances are not. To check this, we draw the FRID for the low-energy and the dominant high-energy peaks in Figs. 1(c) and (d), respectively. One can see that the FRID of the low-energy peak shows indeed a collective charge oscillation with the induced density localized around the surfaces (i.e., the two edges) – a plasmon resonance. However, the FRID of the high-energy peak shows an positive and negative induced density distribution alternatively through out the whole ZGNRS plane, indicating that it is due to the local dipole oscillation associated with the -states. Our calculations for other ZGNRSs of different widths show qualitatively the same result. Thus, we find that in ZGNRSs there exists only one plasmon mode in low-energy regime. This is in striking contrast with the case of circular graphene nanodisk Thongrattanasiri et al. (2012) where many scattered plasmon modes are found in the energy window 0 – 0.6 eV. In the following, we focus only on this plasmon mode and how it behaves with the varying and .
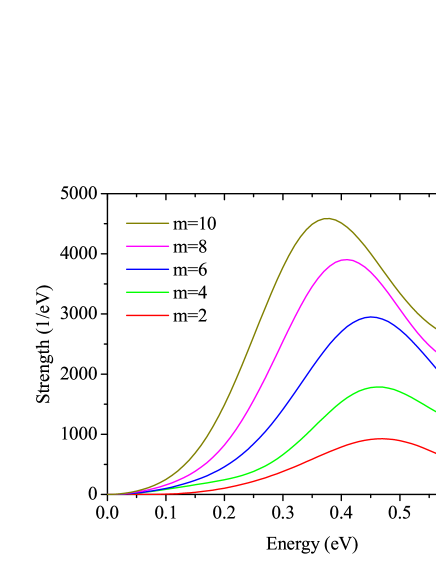
Let us start with the plasmon frequency () as a function of . In Fig.2 we plot the photoabsorption spectra of the -ZGNRS (=2, 4, 6, 8, and 10) for the doping density =4.431014 cm-2. One can see that the plasmon frequence redshifts with the increasing while the dipole strength increases. The redshift in frequency can be understood by considering the decreased energy gap involved in the plasmon excitation and the enhancement of strength results from more electrons participating in the dipole oscillation. Similar behavior was also found in other 2D systems, like 2D sodium atomic planes Wang et al. (2012), and is consistent qualitatively with the ESL of 2DEGs ().
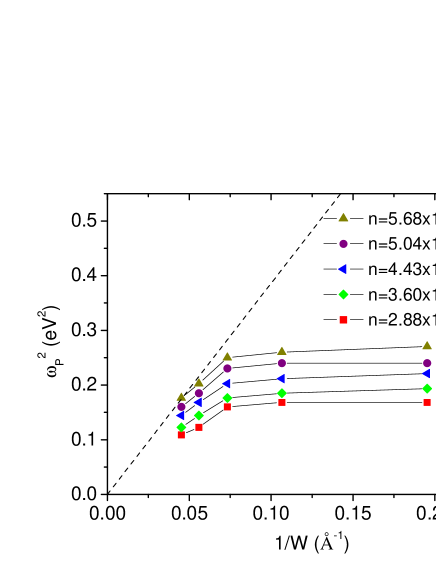
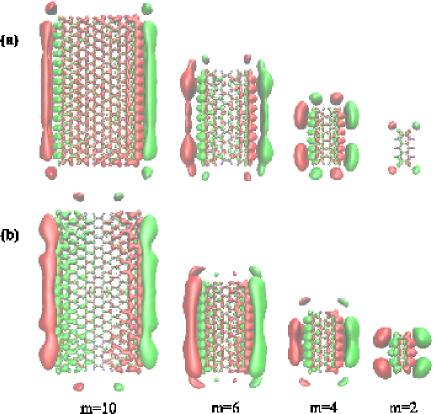
To show quantitatively the relation between and , we plot in Fig.3 the variation of with for different doping densities. The simple proportional relation of the ESL is also drawn with a dashed line through the data point of the maximum and for a comparison. It appears that when the ZGNRS is wide () its as a function of tends to approach the ESL and this agreement holds for all the different doping densities considered. This indicates that the ESL is still applicable to some extent even for ZGNRS as narrow as 2nm. However, when the ZGNRS becomes very narrow () the variation of deviates significantly from the ESL: is now little affected by . This shows that for very narrow ZGNRS the quantum finite-size effect plays an important role and the classical ESL is not applicable anymore. To understand this deviation from the ESL, we plot in Fig.4 the FRID for four different widths (=2, 4, 6, 10) and two different doping densities. For large width (=10) the FRID is mainly distributed around the two long sides of the ZGNRS, showing a (bulk) central plasmon mode which should be approximately described by the ESL. However, when the width is reduced to =2 the ZGNRS will become a quasi-1D system and the FRID is now driven to the two ends, showing an end plasmon mode. As previously demonstrated in the case of atomic chains Yan and Gao (2008); Wang et al. (2012), this end mode is a pure quantum effect and cannot be described by the ESL: Its frequency is almost a constant. This spatial evolvement of the FRID, from the central mode to the end mode, reveals that emerging quantum effect takes control gradually as the width is reduced.
It should be noted that the emergence of the end mode is completely due to the quantum finite-size effect and is not affected by the doping density. This is evident in Fig.4: The large increase of from Fig.4(a) to Fig.4(b) merely enhances the central or the end mode but affects little the nature of them.
Next, we investigate the plasmon frequency as a function of the doping density. According to the ESL, the frequency of 2D plasmon will scale as
| (1) |
for massless-electron (Dirac) plasmon or
| (2) |
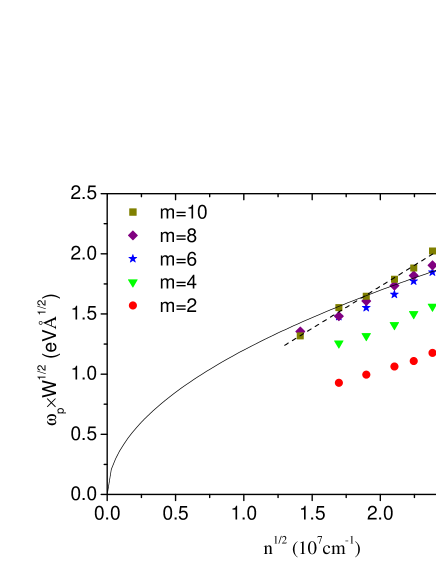
for free-electron plasmon. To date, (doped) graphene plasmon is thought to be Dirac plasmon and the experimental data for graphene microribbons reported in Ref.Ju et al., 2011 were claimed to fit Eq.(1) very well. It is interesting to see to what extent this Dirac ESL scaling still holds for the much smaller ZGNRSs. To have a detailed comparison, we plot as a function of in Fig.5 and compare the data points to the fitted parabola (only for =10), as did in the same way in Fig.3(b) of Ref.Ju et al., 2011. The first thing to note is that the normalized scaling behavior strongly depends on the width. When the width is very small (=2, 4) the scaling is very different for different widths while for large widths (=6, 8, 10) the scaling behavior tends to converge. This is a result of the quantum finite-size effect discussed previously. If one compare carefully the data points to the fitted parabola (for =10) in Fig.5 one can see that the trend of the data points (indicated by a dashed line) is not well consistent with the parabola: The slope of the dashed line is remarkably larger than that of the parabola. This discrepancy from the scaling relation of Eq.(1) indicates that the ZGNRS plasmon may not be Dirac plasmon. Interestingly, a somewhat similar discrepancy also exists in the experimental result for graphene microribbons (see Fig.3(b) of Ref.Ju et al., 2011), which may need further experiment to clarify.
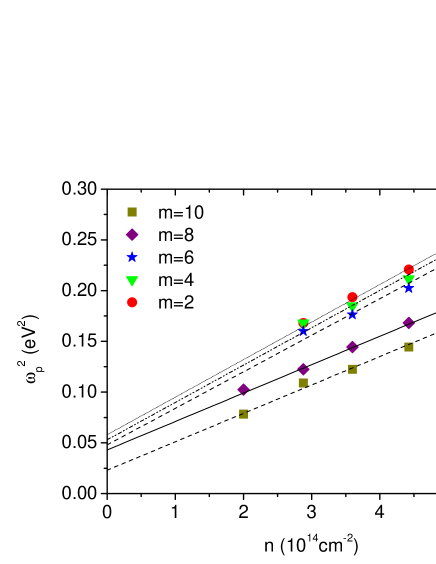
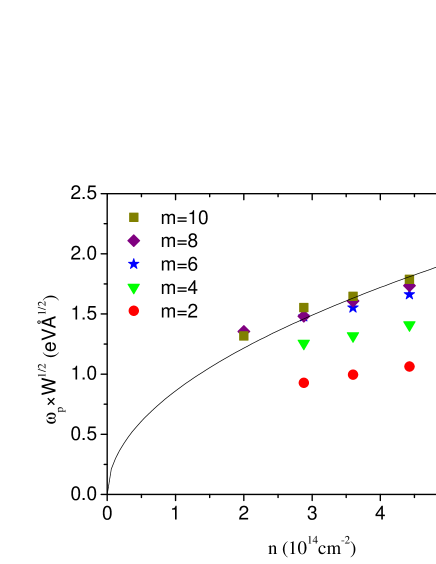
To check the scaling relation of Eq.(2), we plot as a function of in Fig.6 and compare the data points to the fitted parabola (only for =10). It can be seen that now the data points are in better agreement with the parabola, especially for the higher doping densities. This shows that Eq.(2) describes more reasonably the scaling behavior. To see this more directly, we plot as a function of for different widths in Fig.7. It is evident that all the data points are in very good agreement with the fitted straight lines, indicating that Eq.(2) holds very well for plasmons in ZGNRSs. This result suggests that the ZGNRS plasmon is nearly free-electron plasmon instead of Dirac plasmon.
In summary, by using ab initio time-dependent density functional theory calculation in the time domain, we have investigated the collective electronic excitations in doped segments of zigzag graphene nanoribbons with different widths and doping densities. It has been found that the plasmonic behavior is very regular in the low-energy regime: Only one plasmon mode exists in the energy window of 0–1.5 eV. The variation of its frequency with the width tends to approach the classical electrostatic scaling law for widths larger than 1.5 nm but shows a totally different behavior for widths smaller than 1.5 nm due to a dominant quantum effect. The variation of the plasmon frequency with the doping density shows that the plasmon is nearly free-electron plasmon instead of Dirac plasmon.
We would like to thank Jin-Long Yang at USTC for helpful discussion. This work was supported by the National Natural Science Foundation of China under Grant No. 11174220 and by the MOST 973 Project under Grant No. 2011CB922204, and by King Abdulaziz University (KAU) under Grant No. (49-3-1432/HiCi), as well as by the Shanghai Pujiang Program under Grant No. 10PJ1410000.
References
- Danckwerts and Novotny (2007) M. Danckwerts and L. Novotny, Phys. Rev. Lett. 98, 026104 (2007).
- Ozbay (2006) E. Ozbay, Science 311, 189 (2006).
- Talley et al. (2005) C. E. Talley, J. B. Jackson, C. Oubre, N. K. Grady, C. W. Hollars, S. M. Lane, T. R. Huser, P. Nordlander, and N. J. Halas, Nano Lett. 5, 1569 (2005).
- Juan et al. (2011) M. L. Juan, M. Righini, and R. Quidant, Nat. Photonics 5, 349 (2011).
- Boltasseva and Atwater (2011) A. Boltasseva and H. A. Atwater, Science 331, 290 (2011).
- Geim and Novoselov (2007) A. K. Geim and K. S. Novoselov, Nature Mater. 6, 183 (2007).
- Geim (2009) A. Geim, Science 324, 1530 (2009).
- Zhang et al. (2005) Y. Zhang, Y. Tan, H. Stormer, and P. Kim, Nature 438, 201 (2005).
- Novoselov et al. (2004) K. S. Novoselov, A. K. Geim, S. V. Morozov, D. Jiang, Y.Zhang, S. V. Dubonos, I. V. Grigorieva, and A. A. Firsov, Science 306, 666 (2004).
- Wang et al. (2008) F. Wang, Y. Zhang, C. Tian, C. Girit, A. Zettl, M. Crommie, and Y. R. Shen, Science 320, 206 (2008).
- Efetov and Kim (2010) D. K. Efetov and P. Kim, Phys. Rev. Lett. 105, 256805 (2010).
- Jablan et al. (2009) M. Jablan, H. Buljan, and M. Soljačić, Phys. Rev. B 80, 245435 (2009).
- Ju et al. (2011) L. Ju, B. Geng, J. Horng, C. Girit, M. Martin, Z. Hao, H. A. Bechte, X. Liang, A. Zettl, Y. R. Shen, et al., Nature Nanotech. 6, 630 (2011).
- Liu et al. (2008) Y. Liu, R. F. Willis, K. V. Emtsev, and T. Seyller, Phys. Rev. B 78, 201403 (2008).
- Tegenkamp et al. (2011) C. Tegenkamp, H. Pfnür, T. Langer, J. Baringhaus, and H. W. Schumacher, J. Phys. : Condens. Matter 23, 012001 (2011).
- Brar et al. (2011) V. W. Brar, S. Wickenburg, M. Panlasigui, C. H. Park1, T. O. Wehling, Y. Zhang, R. Decker, C. Girit1, A. V. Balatsky, S. G. Louie, et al., Phys. Rev. B 104, 036805 (2011).
- Fei et al. (2011) Z. Fei, G. O. Andreev, W. Bao, L. M. Zhang, A. S. McLeod, C. Wang, M. K. Stewart, Z. Zhao, G. Dominguez, M. Thiemens, et al., Nano Lett. 11, 4701 (2011).
- Thongrattanasiri et al. (2012) S. Thongrattanasiri, A. Manjavacas, and F. J. G. de Abajo, ACS Nano 6, 1766 (2012).
- Phark et al. (2011) S. Phark, J. Borme, A. Vanegas, M. Corbetta, D. Sander, and J. Kirschner, ACS Nano 5, 8162 (2011).
- Liu et al. (2011) Q.-H. Liu, Z.-Y. Li, and J.-L. Yang, Chin. J. Chem. Phys. 24, 22 (2011).
- Hu et al. (2010) S. L. Hu, Z. Y. Li, Q. H. Liu, X. D. Xiao, J. G. Hou, and J. L. Yang, arXiv:1009.3699v1 (2010).
- Wang et al. (2012) B.-J. Wang, Y. Xu, and S.-H. Ke, J. Chem. Phys. 137, 054101 (2012).
- Lehtovaara et al. (2011) L. Lehtovaara, V. Havu, and M. Puska, J. Chem. Phys. 135, 154104 (2011).
- Marinopoulos et al. (2002) A. G. Marinopoulos, L. Reining, V. Olevano, and A. Rubio, Phys. Rev. Lett. 89, 076402 (2002).
- Marinopoulos et al. (2003) A. G. Marinopoulos, L. Reining, A. Rubio, and N. Vast, Phys. Rev. Lett. 91, 046402 (2003).
- Tachikawa et al. (2009) H. Tachikawa, Y. Nagoya, and H. Kawabata, J. Chem. Theory Comput. 5, 2101 (2009).
- Gao and Yuan (2011) Y. Gao and Z. Yuan, Solid State Commun. 151, 1009 (2011).
- Yan and Gao (2008) J. Yan and S. W. Gao, Phys. Rev. B 78, 235413 (2008).
- Hwang and Sarma (2007) E. H. Hwang and S. D. Sarma, Phys. Rev. B 75, 205418 (2007).
- Marques et al. (2003) M. A. L. Marques, A. Castro, G. F. Bertsch, and A. Rubio, Comput. Phys. Commun. 151, 60 (2003).
- Troullier and Martins (1991) N. Troullier and J. L. Martins, Phys. Rev. B 43, 1993 (1991).
- Vasiliev et al. (1999) I. Vasiliev, S. Öǧ¨¹t, and J. R. Chelikowsky, Phys. Rev. Lett. 82, 1919 (1999).
- Onida et al. (2002) G. Onida, L. Reining, and A. Rubio, Rev. Mod. Phys. 74, 601 (2002).