”Self-absorbed” GeV light-curves of Gamma-Ray Burst afterglows
Abstract
We investigate the effect that the absorption of high-energy (above 100 MeV) photons produced in GRB afterglow shocks has on the light-curves and spectra of Fermi-LAT afterglows. Afterglows produced by the interaction of a relativistic outflow with a wind-like medium peak when the blast-wave deceleration sets in, and the afterglow spectrum could be hardening before that peak, as the optical thickness to pair-formation is decreasing. In contrast, in afterglows produced in the interaction with a homogeneous medium, the optical thickness to pair-formation should increase and yield a light-curve peak when it reaches unity, followed by a fast light-curve decay, accompanied by a spectral softening. If energy is injected in the blast-wave, then the accelerated increase of the optical thickness yields a convex afterglow light-curve. Other features, such as a double-peak light-curve or a broad hump, can arise from the evolution of the optical thickness to photon-photon absorption. Fast decays and convex light-curves are seen in a few LAT afterglows, but the expected spectral softening is rarely seen in (and difficult to measure with) LAT observations. Furthermore, for the effects of photon-photon attenuation to shape the high-energy afterglow light-curve without attenuating it too much, the ejecta initial Lorentz factor must be in a relatively narrow range (50-200), which reduces the chance of observing those effects.
Space & Remote Sensing, MS B244, Los Alamos National Laboratory, Los Alamos, NM 87545, USA
Subject headings: radiation mechanisms: non-thermal, relativistic processes, shock waves, gamma-ray bursts
1 Introduction
The first Fermi-LAT catalog of GRBs (Ackermann et al 2013a) presents temporal and spectral information on the emission above 100 MeV measured by the Fermi satellite during the prompt (burst) and extended (afterglow) phases of 28 GRBs. For several well-monitored sources, the high-energy emission displays a power-law decay in time. That behaviour and the X-ray and GeV fluxes being compatible with each other within the blast-wave afterglow model, prompted Kumar & Barniol Duran (2009, 2010) to attribute the LAT high-energy emission to the forward-shock that powers the afterglow emission at lower (optical and X-ray) photon energies (see also Ghirlanda et al 2010).
For four bright Fermi long-GRBs (080916C - Ackermann et al 2013a; 090902B - Abdo et al 2009a; 090926A - Ackermann et al 2011; 110731 - Ackermann et al 2013b), the LAT prompt-emission spectrum (above 100 MeV) is a power-law harder than the Band spectrum of the GBM emission (above keV). For three of those bursts, the slope of the LAT power-law spectrum does not change (within measurement errors) at the end of the prompt phase. Furthermore, the LAT light-curve is continuous at the end of the burst, in all four cases. These two facts indicate that, at least for bright long-GRBs, the LAT emission mechanism is the same as for the afterglow (i.e. the forward-shock).
The absorption of high-energy photons, discussed by Fenimore et al (1993) for CGRO-BATSE bursts, has been reconsidered for the GeV photons of Fermi-LAT bursts (e.g. Abdo et al 2009) and used to set lower limits on the burst source Lorentz factor, usually found to be between 200 and 1000 (e.g. Ackermann et al 2013a). A detailed treatment of the source dynamics has been shown to reduce those limits (Granot et al 2008, Hascoet et al 2012), as does the possibility that the burst MeV emission (the target photons for the GeV test photons) arose at a smaller radius than the LAT emission (Zou et al 2011, Hascoet et al 2012).
Direct evidence for photon-photon attenuation in LAT afterglows exists only for the afterglow 090926A (Ackermann et al 2011), whose spectrum shows a cut-off at 2 GeV. The optical thickness to pair-formation should vary with time, yielding a variable cut-off energy in the LAT spectrum and a variable slope of the attenuated spectrum. An evolving optical thickness can also alter the flux of the emergent emission, and the attenuated light-curve should be correlated with the spectral evolution. The purpose of this article is to identify the effects that pair-formation has on the afterglow light-curve, and the correlation between features of the attenuated light-curve and the spectrum evolution. First, we calculate the optical thickness to photon-photon absorption of the forward-shock emission on itself, quantifying its flux with the aid of LAT measurements (taken as a proxy for the unattenuated, intrinsic afterglow emission). Then, we consider how that optical thickness evolves while the forward-shock flux, radius, and Lorentz factor vary, and study the attenuated forward-shock light-curve. Finally, we compare the expected features of the attenuated light-curve and the corresponding spectral evolution with Fermi-LAT observations of GRB afterglows.
2 How pair-formation opacity alters afterglow light-curves
First, we argue that most of the target photons that absorb a test-photon (of energy above 100 MeV) were produced within the last dynamical timescale since the test-photon was released. The kinematics of the interaction between a target-photon emitted at radius by a spherical surface, moving at Lorentz factor , interacting with a test-photon at radius shows that the angle (relative to the radial direction) at which the target-photon was emitted is
| (1) |
with . The first line is for an undecelerated source, the second line is for a decelerating shock interacting with a wind-like ambient medium (with density radial distribution ), while the third line is for a decelerating shock interacting with a homogeneous medium. Furthermore, the angle of incidence between the target and test photons is and the target-photon was emitted from a region extending an angle , as seen from the origin.
The infinitesimal optical thickness to pair-formation for a test-photon of energy crossing a distance of the target-photon front is , where is the density of target photons above the threshold energy for pair-formation, , proportional to the flux of target photons at radius . Denoting by the relativistic boost factor, we have , where is the comoving-frame intensity of the target photons above the threshold energy and is the solid-angle extended at by the source of target photons (at ). If the target photons have a power-law number spectrum above an energy , , then . For a small incidence angle, , we have and
| (2) |
To calculate the optical thickness to pair-formation, we must evaluate the term at . For synchrotron emission, and , where is the magnetic field, is the number of radiating electrons, and is the comoving-frame energy of electrons radiating synchrotron emission at energy . If the magnetic field and the electrons acquire a constant fraction of the forward-shock’s energy, then and . The number of radiating electrons is .
With the above scalings, it can be shown that
| (3) |
Substituting in equation (2), we find
| (4) |
Thus, is a strong function of , which shows that most of the target photons are those emitted at . Their typical incidence angle on the test-photon is .
2.1 Approximate optical thickness to pair-formation
The optical thickness to pair-formation for a test-photon of observer-frame energy is , with the photon-photon absorption cross-section averaged over the power-law spectrum of the target photons with energy above the source-frame (at redshift ) threshold and the fluence of target photons at the location where the test-photon is absorbed.
The threshold energy for pair-formation is
| (5) |
where we used . In the observer-frame, the threshold photon energy
| (6) |
is not far below 100 MeV, if the source Lorentz factor is around 100, thus it is reasonable to assume that the spectrum of target photons is the extrapolation to lower energies of the afterglow spectrum measured by LAT above 100 MeV. Then, the fluence of target photons above the threshold energy is
| (7) |
Considering that the target photons are those produced within the last dynamical timescale, the above number of photons incident per unit area at the location of a test-photon is
| (8) |
for spectra with , and with the observer-frame time. The luminosity can be calculated from the measured flux: , where is the afterglow unabsorbed energy flux and the luminosity distance.
Finally, the optical thickness to pair-formation for a photon of measured energy can be related to the observed afterglow flux above energy :
| (9) |
To calculate the optical thickness from the flux measured above a photon energy , one can substitute in equation (9), leading to
| (10) |
We simplify equation (9) by considering (compatible with the slope measured by LAT for many afterglows), for which , and by using cm (this approximation has an error lower than 25 percent for ):
| (11) |
with the notations and . The afterglow unabsorbed energy flux above the test-photon energy is normalized to , which, for , corresponds to a photon flux in the 100 MeV–10 GeV range, as typically measured by LAT at 10 s after trigger.
Given some of the approximations made, the coefficient given in equation (11) is likely mis-estimated by a factor of about 2, but that leads to a small error in the following results for the ejecta Lorentz factor, because that coefficient is raised to a small, sub-unity power. A larger error is made if the afterglow power-law spectrum measured by LAT above 100 MeV does not extend sufficiently below 100 MeV, which may happen if the LAT emission process is inverse-Compton. Alternatively, if the LAT emission is synchrotron, then afterglow X-ray observations (which indicate that the peak of synchrotron spectrum is below 1 keV at 100–1000 s) imply that the synchrotron power-law spectrum is well below 100 MeV even at the earliest LAT measurement.
2.2 Burst vs. afterglow target photons
Equation (9) quantifies the optical thickness to pair-formation for a LAT test-photon absorbed by a target-photon that arose from the same mechanism as the LAT emission, i.e. a target-photon that is the extrapolation of the LAT spectrum below 100 MeV (equation 6).
During the burst, the absorption of (more than) 100 MeV LAT photons on (less than) 10 MeV GRB photons can be estimated from equation (10):
| (12) |
where denotes the fluences of each component, is the peak energy of the prompt emission, is the low edge of the LAT range, all photon energies are in units, and we allowed for different Lorentz factors of the prompt and afterglow sources.
The LAT afterglow fluence during the prompt phase is 1–50 percent of the 10 keV–1 MeV prompt emission fluence (Ackermann et al 2013a). The GRB spectrum being softer () than the spectrum of the LAT afterglow (), decreases the relative number of burst photons above the threshold of MeV (equation 6) for pair-formation by a factor , for and .
Given that the afterglow source is unlikely to be more relativistic than the GRB source (), it follows that, for the brighter LAT afterglows (), pair-formation opacity for 100 MeV photons on burst photons is negligible relative to that on afterglow photons, provided that the LAT power-law spectrum extends below MeV (equation 6). However, for the dimmer LAT afterglows (), pair-formation on burst photons should be dominant. In that case, the lower limits on the afterglow source initial Lorentz factor derived below (from the condition of optical thinness for the 100 MeV afterglow photons) are underestimations.
After the burst, a LAT test-photon can be absorbed by a GRB target-photon, even though the former was emitted (at ) after the latter (at ), provided that GRB photon moves at a sufficiently large angle relative to the LAT photon’s direction (toward the observer). According to equation (1), the GRB photon’s emission angle must be larger than the inverse of the GRB source Lorentz factor, which implies that the burst emission absorbing the LAT afterglow emission is highly ”de-beamed” relativistically, by a factor . Adding that to equation (12) and taking into account that the afterglow fluence is only slowly decreasing after the burst, it follows that the absorption of LAT photons by the GRB emission can be ignored safely.
2.3 Forward-shock emission
The interaction of the relativistic ejecta with the ambient medium drives a reverse shock into the ejecta shell and forward shock that sweeps the ambient medium. Before the reverse shock sweeps up the ejecta shell, both shocked fluids move at the same and constant Lorentz factor. After the reverse shock has crossed the ejecta shell, the motion of the shocked fluids is significantly decelerated by the interaction with ambient medium. The deceleration timescale , defined by the reverse shock having crossed the ejecta shell, is also the time when a substantial fraction of the ejecta energy has been transferred to the swept-up ambient medium. For simplicity, we consider only the case of a sufficiently thin/dense shell of relativistic ejecta; then, at , the shocked fluid moves at nearly the Lorentz factor of the unshocked ejecta. In the case of a thick/tenuous ejecta shell, the pre-deceleration Lorentz factor of the shocked fluid depends on the geometrical thickness of the ejecta shell and the following calculation would yield a constraint on instead of .
To relate the observer arrival-time of the forward-shock photons to that shock’s radius, we note that most photons are emitted from the edge of the ”visible” area, where the radiating fluid moves at an angle relative to the direction toward the observer. The electrons radiating synchrotron emission above 100 MeV are most likely cooling on timescale smaller than the dynamical time, hence they are located immediately behind the forward-shock, which moves that . Then, at , when the source moves at constant , the photon arrival-time is
| (13) |
The shock radius can be substituted in equation (11), leading to
| (14) |
To continue, the time-evolution of is needed. For that, we assume that the afterglow emission above 100 MeV is synchrotron from the forward-shock that energizes the ambient medium, but the calculations below for the attenuated flux can be easily extended to the inverse-Compton emission or to the reverse shock emission, as long as the target-photon (below 10 MeV) and the test-photon (above 100 MeV) are from the same spectral component (i.e. they arise from same emission mechanism and same radiative process). This condition allows us to relate the flux of absorbing photons (of energy below the LAT range) to that measured by LAT.
2.4 Homogeneous medium
Prior to the onset of deceleration and at photon energies above the cooling frequency of the synchrotron spectrum, the forward-shock synchrotron flux should rise as . Below the cooling frequency, the rise is ; the following calculations would be very similar, and all the important features of the photon-photon attenuation on the emergent light-curve can be captured by the low cooling-frequency case. Thus, if we parametrize the flux above 100 MeV by , to match LAT measurements at 10 s, equation (14) gives
| (15) |
At the deceleration radius, about 1/3 of the initial ejecta energy has been transferred to the energized ambient medium, whose comoving frame internal energy is larger by than its rest-mass (this is one of the shock-jump conditions). Thus, the forward-shock’s energy at is
| (16) |
Substituting in equation (13), the deceleration timescale is
| (17) |
After , the afterglow intrinsic flux should decrease as with , where is the slope of the energy spectral flux , thus is expected for . Equation (16) with and instead of and , and the general result lead to and . Then, equation (9) yields , i.e. increases for and decreases for . LAT afterglows have , thus should increase slowly as or be nearly constant at the value reached at .
Adding to this that increases with time, it leads to the conclusion that optical thickness to pair-formation plays a role in shaping the afterglow light-curve if . Substituting equation (17) in (15),
| (18) |
thus, for equal to
| (19) |
we have . Note that the critical value is quite well determined (if redshift is known), as other quantities appear at very small powers.
If , then , and pair-formation opacity is negligible, except when and could exceed it after , owing to a slow increase (for ). In this case, the peak of the LAT light-curve occurs at the deceleration time (, and equation (17) gives
| (20) |
The interesting situation occurs for , for which . In this case, reaches unity at
| (21) |
according to equation (15). After that, and the absorbed afterglow flux evolves as , reaching a maximum at , hence the timing of the attenuated light-curve peak gives
| (22) |
If and the LAT light-curve peak is erroneously identified with the deceleration timescale, then is overestimated by a factor (from eqs 20 and 22).
Given that for and for , it follows that there is an upper limit to the LAT light-curve peak epoch, reached when (i.e. for ) :
| (23) |
A somewhat lower s (with remaining quantities above at a small power) is obtained if the synchrotron cooling frequency were above 100 MeV. A similar result should be obtained if the LAT emission were inverse-Compton, as that changes only the rise of the afterglow flux before , affecting and . The existence of an upper limit to the LAT light-curve peak epoch is a consequence of the intrinsic afterglow light-curve having a peak and of the optical thickness to pair-formation increasing with time (for a wind-like medium, that optical thickness is, most likely, decreasing in time, as discussed in the next section).
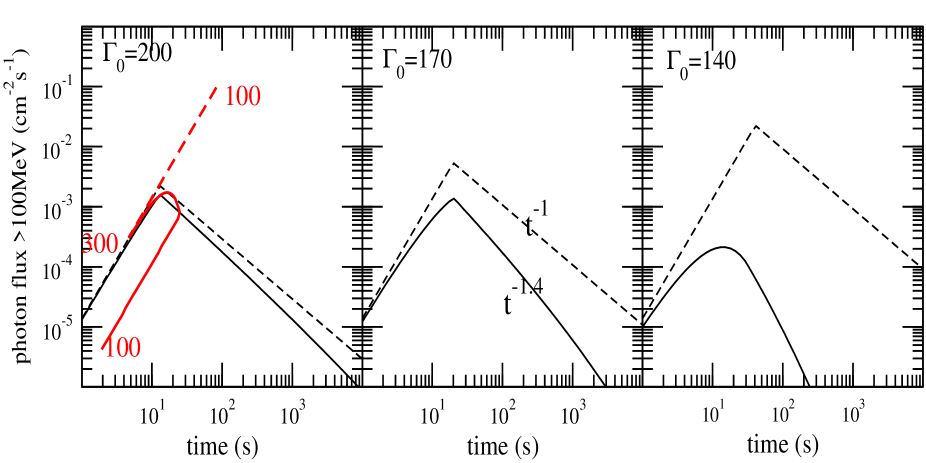
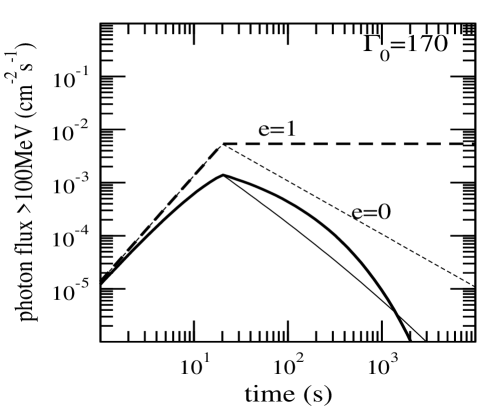
Figure 1 illustrates the effect of photon-photon absorption on the emergent flux above 100 MeV, calculated by integrating spectral flux attenuated by the optical thickness . For , the optical thickness increases after the deceleration time (the peak of the intrinsic light-curve) as and the attenuated flux displays a faster decay than the intrinsic light-curve. Note that, for such a slowly varying optical thickness, the attenuated light-curve decay, , there is little curvature in the attenuated light-curve, and it still resembles a power-law. Thus, LAT light-curves decaying faster than expected for the forward-shock model (i.e. faster than the X-ray emission at same time), may be due photon-photon attenuation in the source.
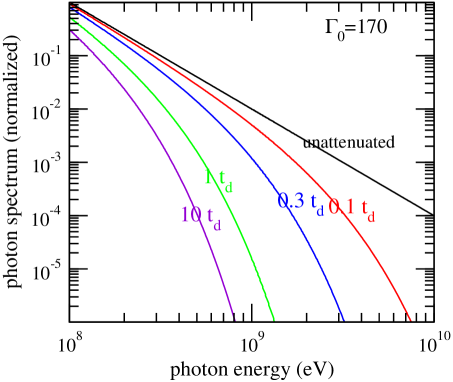
Figure 2 shows the obvious correlation between a significant effect of photon-photon attenuation on the LAT light-curve (Fig 1) and the lack of higher energy photons. Furthermore, Figure 2 illustrates the progressive softening of the afterglow spectrum above 100 MeV, owing to an increasing . Together with the intrinsic and attenuated light-curves shown in Figure 1, this suggests the less trivial, but still intuitive, conclusion that LAT light-curves decaying faster should have LAT spectra that soften faster.
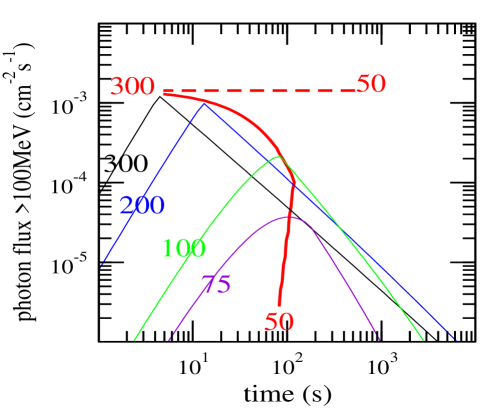
Figure 3 shows the peak flux–peak epoch curve obtained by varying the ejecta initial Lorentz factor, but with the intrinsic afterglow flux fixed at the deceleration time (instead of 10 s). An upper limit to the peak epoch of the emergent light-curve still exists, being characterized by and s. Again, for , the peak flux of the emergent emission decreases fast with decreasing .
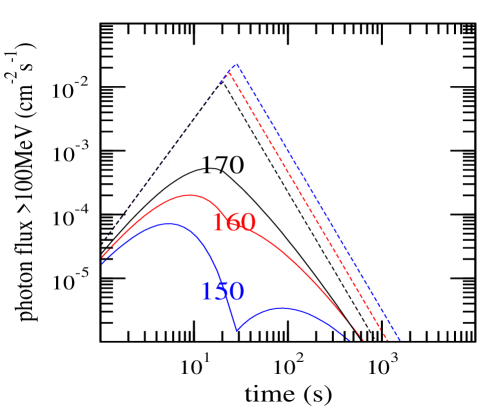
Given that , the optical thickness decreases after the peak of the intrinsic light-curve if the energy spectrum slope is . The change in the evolution of across yields a point of inflection in the attenuated light-curve if , as illustrated in Figure 4. For not much above unity, the emergent light-curve displays a power-law decay that is slower than that of the intrinsic flux, but for , the attenuated light-curve has a second peak that may be detected by LAT.
Figure 5 shows how a faster evolving induces an evident curvature in the attenuated light-curve. Considering that , a spectral slope sufficiently far from 4/3 should illustrate that effect. However, a faster evolving is obtained for the typical LAT spectrum, if there is an energy injection111The existence of an energy injection process in the blast-wave is suggested by the light-curve plateaus (slow decays) observed by XRT in a good fraction of X-ray afterglowsin the forward shock, so that its energy evolves as after . This energy-injection law yields a decay index of the intrinsic flux , the dynamics of the forward-shock becomes , , and equation (9) gives . For , and . As shown in Figure 5, afterglows for which increases sufficiently fast after may disappear at late times, their flux falling below the extrapolation of the decay seen just after the peak.
2.5 Wind-like medium
Before deceleration, the intrinsic synchrotron flux evolves as above the synchrotron cooling frequency, and as below that frequency. Considering only the former case (calculations and results are similar for the latter), and taking , we parametrize the afterglow flux as . From equation (14)
| (24) |
Thus, decreases with time before deceleration, a behavior which is maintained after , and is enhanced if there is energy injection. This is the only important difference relative to the case of a homogeneous medium.
The deceleration timescale can be found from equations (13) and (16) modified for a wind-like medium: , corresponding to the wind around a Wolf-Rayet GRB progenitor that expelled at a terminal velocity of . The result is
| (25) |
Substituting in equation (24),
| (26) |
thus if is
| (27) |
For , the falls below unity before , at
| (28) |
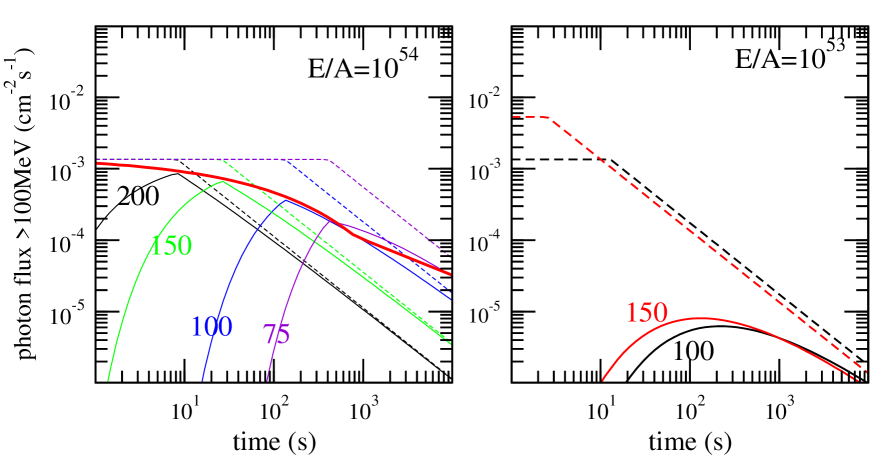
At , the emergent flux rises as , to a plateau that begins after and lasts until . The left panel of Figure 6 shows the attenuated light-curves obtained for . For the shown, the plateau is not developed; a higher would display that plateau, but at times s and, hence, cannot be monitored. Thus, for , the attenuated LAT light-curve still displays a peak at .
For , the optical thickness falls below unity after , at a time that depends only on the dynamical parameter and the intrinsic afterglow flux (at some fixed time after ), as all information about is lost after the deceleration time. At , the emergent flux rises as , which is a slow rise to a peak at . The right panel of Figure 6 shows the attenuated light-curves obtained for , displaying a broad hump after . That hump cannot be significantly brighter than shown because a higher intrinsic flux is compensated by a larger optical thickness and the peak of the emergent light-curve gets even dimmer.
3 Discussion
The results presented in the previous section indicate that pair-formation is negligible in LAT afterglows if the ejecta initial Lorentz factor is higher than . In that case, the afterglow light-curve produced by the forward-shock energizing the ambient medium should be a broken power-law peaking at the ejecta deceleration time and without any evolution of the LAT spectrum. At the other extreme, if is too low (e.g. ), the afterglow optical thickness to pair-formation could be too high and the attenuated flux too low to be detected by LAT.
For an intermediate range , photon-photon absorption is important and modifies the broken power-law light-curve of the intrinsic (unatenuatted) forward-shock emission above 100 MeV, yielding any of the following:
-
1.
a light-curve peak prior to the onset of deceleration, with a spectral softening during that peak
-
2.
a post-peak flux power-law decay steeper than measured at lower photon energies (if the unabsorbed energy spectrum is harder then ), accompanied by a spectral softening
-
3.
a flux power-law decay slower than expected (if the intrinsic energy spectrum is softer than ), simultaneous with a spectral hardening
-
4.
a convex light-curve decay, accompanied by a spectral softening
-
5.
a double peaked light-curve, for a soft intrinsic spectrum, with the second peak accompanied by a spectral hardening
-
6.
a light-curve peak at the deceleration time and a spectral hardening for the entire afterglow
-
7.
a long-lived hump/plateau, accompanied by a spectral hardening.
The first five features above are produced by the ejecta interaction with a homogeneous medium, when the optical thickness to pair-formation increases with time before the deceleration time (the peak of the intrinsic afterglow light-curve), and increases/decreases after if the intrinsic afterglow spectrum is harder/softer than . The last two features listed above arise when the ambient medium has a wind-like particle radial distribution, in which case always decreases with time. The behaviour of (increasing or decreasing) relates the corresponding afterglow feature to a spectral evolution (softening or hardening, respectively).
Steep decays. The afterglows 080916C (Abdo et al 2009b), 090510 (Ghirlanda et al 2010, Ackermann et al 2010a), 090902B (Abdo et al 2009b), 090926A (Ackermann et al 2011), 100116, 100414, 110625 (Tam et al 2012), and 110731 (Ackermann et al 2013b) display a flux decay or faster (Ghisellini et al 2010 attribute such fast decays to a highly radiative forward-shock). XRT coverage overlapping with the LAT observations exists for 090510, 100414, 110625, and 110731, showing X-ray flux decays , , , and , respectively, i.e. slower than at 100 MeV. Thus, the above LAT flux decays are faster than expected (from the X-rays) and the reason for those fast decays is not a radiative blast-wave. The afterglow 100116 shows a marginally-significant softening by , while 110625 has a more significant softening of . The spectrum of afterglow 090926A hardens and, for the rest, no spectral evolution can be measured within the uncertainty of individual spectral slope measurements (). For the last six LAT afterglows listed above, photons of more than 2 GeV were detected after s. If such high-energy photons are associated with the afterglow at such late times, then photon-photon absorption plays no role in explaining those fast flux decays.
Convex light-curves. The afterglow 080916C shows a convex light-curve (i.e. a steepening) but without a spectral softening. A convex light-curve is compatible with the LAT flux upper limits that are below the extrapolation of the flux decay seen at earlier times for the afterglows 090217 (Ackermann et al 2010b) (which shows no clear spectral evolution), 100620 (which displays a spectral softening by ), and 110120 (whose spectrum hardens by , together with the detection of a 2 GeV photon at 70 s, both suggesting that its emission is optically thin). As such light-curves are expected from a fast increase of , perhaps caused by energy injection in the forward shock, their origin in this process should be corroborated with the corresponding plateau or slow decay in the X-ray light-curve. None of the above four LAT afterglows have simultaneous XRT coverage.
Afterglow rises. LAT light-curves with rises are seen for afterglows 080916C, 090510, 090902B, 090926A, and 110731, with peaks at 1-10 s. A spectral evolution throughout the entire afterglow is evidenced only for 090926A, with a spectral hardening from at 5-10 s to after 100 s. Furthermore, the LAT spectrum displays a cut-off at GeV and at 3-20 s, and photons above 2 GeV appear after 20 s. Thus, this afterglow offers good evidence for the optical thickness to pair-formation decreasing throughout the afterglow. At late times, the spectrum should be unattenuated; being harder than , it implies that the decrease in should be associated with a wind-like ambient medium.
Two-peaked light-curves and long-lived humps (or plateaus) could be difficult to observe with LAT, given that the expected flux at the second peak or during the plateau is strongly attenuated by photon-photon absorption.
An interesting effect of pair-formation is that, if the ambient medium is homogeneous, then there is an upper limit to the epoch of the light-curve peak that an adiabatic (no energy injection) forward shock can yield (eq 23), that upper limit having a moderate dependence on the afterglow energy-to-ambient density ratio. Later occurring peaks could be produced by a wind-like medium. None of the LAT afterglows with light-curve peaks violate the upper limit for a homogeneous medium, nevertheless that does not identify the type of external medium because it may just be a selection effect: later occurring peaks are intrinsically dimmer and harder to detect. Instead the identification of the ambient medium stratification can be done reliably from the evolution of the afterglow spectrum (a softening of the afterglow spectrum is obtained only for a homogeneous medium).
In conclusion, there is tentative evidence that LAT may have observed the effects of photon-photon attenuation in two afterglows: 090926A (peaked ligh-curve and spectral hardening) and 100620 (convex light-curve and spectral softening), and maybe also in 110625 (steep decay and spectral softening). Aside from the difficulty of measuring with LAT the spectral evolution that should accompany the above-listed light-curve features arising from photon-photon attenuation, the paucity of afterglows displaying the expected pair-formation features may be due to the narrow range of ejecta Lorentz factors required for those features to occur () and for the emergent attenuated emission not to be too dim (). Conversely, the general lack of ”self-absorption” features in LAT afterglow light-curves implies that , which is consistent with the lower limits on the Lorentz factor inferred for GBM bursts (Ackermann et al 2013a).
This work was supported by an award from the Laboratory Directed Research and Development program at the Los Alamos National Laboratory
REFERENCES
Abdo A. et al, 2009a, ApJ, 706, L138
Abdo A. et al, 2009b, Science, 323, 1688
Ackermann M. et al, 2010a, ApJ, 716, 1178
Ackermann M. et al, 2010b, ApJ, 717, L127
Ackermann M. et al, 2011, ApJ, 729, 114
Ackermann M. et al, 2013a, ApJS, 209, 11
Ackermann M. et al, 2013b, ApJ, 763, 71
Fenimore E., Epstein R., Ho C., 1993, A&AS, 97, 59
Ghirlanda G., Ghisellini G., Nava L., 2010, A&A, 510, L7
Ghisellini G., Ghirlanda G., Nava L., Celotti A., 2010, MNRAS, 403, 926
Granot J., Cohen-Tanugi J., Couto e Silva E., 2008, ApJ, 677, 92
Hascoet R., Daigne F., Mochkovitch R., Vennin V., 2012,
MNRAS, 421, 525
Kumar P., Barniol Duran R., 2009, MNRAS, 400, L75
Kumar P., Barniol Duran R., 2010, MNRAS, 409, 226
Tam P., Kong A., Fan T., 2012, ApJ, 754, 117
Zou Y., Fan Y., Piran T., 2011, ApJ, 726, L2