Communication Network Design:
Balancing Modularity and Mixing via
Optimal Graph Spectra
By leveraging information technologies, organizations now have the ability to design their communication networks and crowdsourcing platforms to pursue various performance goals, but existing research on network design does not account for the specific features of social networks, such as the notion of teams. We fill this gap by demonstrating how desirable aspects of organizational structure can be mapped parsimoniously onto the spectrum of the graph Laplacian allowing the specification of structural objectives and build on recent advances in non-convex programming to optimize them. This design framework is general, but we focus here on the problem of creating graphs that balance high modularity and low mixing time, and show how “liaisons” rather than brokers maximize this objective.
Keywords: Optimal Networks, Network Design, Social Networks, Organization Design, Spectral Graph Theory, Modularity, Semi-Definite Programming, Human Computation, Crowdsourcing
1 Introduction
As organizations move rapidly into the world of crowdsourcing, external innovation and human computation (Aral et al. 2013, Boudreau 2010, Boudreau et al. 2011, Di Gangi et al. 2010, Guinan et al. 2013, Ipeirotis et al. 2010, Kearns 2012, Kohler et al. 2011, Lakhani and Jeppesen 2007, Lakhani and Panetta 2007, Von Ahn 2009, Zeng and Wei 2013, Zheng et al. 2011), they are creating platforms that govern the relationships among their problem solvers. When individuals are connected on such platforms, they gain the ability to observe, communicate, and collaborate with each other, forming communication networks. The structure of these networks is very important, being well known to influence knowledge management (Alavi and Leidner 2001), knowledge sharing (Aral and Van Alstyne 2011, Borgatti and Cross 2003, McEvily and Marcus 2005), cooperation and coordination (Huang and Cummings 2011, McCubbins et al. 2009, Suri and Watts 2011), innovation (Bae et al. 2011, Capaldo 2007, Reagans and Zuckerman 2001), the balance between exploration and exploitation (Lazer and Friedman 2007, Mason et al. 2008, Mason and Watts 2012, Shore et al. 2013a), and overall problem-solving performance (Bavelas 1950, Cummings and Cross 2003, Sparrowe et al. 2001). By leveraging modern information and communications technology, there is now the opportunity for organizations to go beyond understanding their networks to actually designing their networks.
There are undoubtedly roles for both emergent and designed networks, but there are reasons to doubt whether emergent networks, created as individuals pursue their own goals, are optimal in the aggregate for the whole organization or collective. For example, if all actors seek novel information by forming bridging ties, this could quickly drive out diversity of information at the collective level as macroscopic structural divisions in a network disappear (Gulati et al. 2012). Additionally, in resource networks, if individuals keep only their strongest ties, it can paradoxically make the whole system very weak (Shore et al. 2013b). In other words, networks can be subject to social dilemmas in which individual and collective interests are at odds. In these cases, design of network structure is an attractive option for the organizations that control them via digital platforms.
Unfortunately, however, there is little research specifically addressing the design of networks of communicating human beings that might guide the way. Rather, the design literature has focused on problems of minimal cost or optimally “efficient” networks, with applications in non-human infrastructure settings (Balakrishnan et al. 1989, Dionne and Florian 1979, Donetti et al. 2005, Estrada 2007, Guimerà et al. 2002, Kershenbaum et al. 1991, Lubotzky et al. 1988, Magnanti and Wong 1984, Minoux 1989, Winter 1987). The work of Lovejoy and Sinha (2010) is a notable exception in that it is concerned with social networks within organizations, but it is similar in its orientation toward efficiency and short paths between any given pair of individuals in a network. There is indeed substantial theoretical justification for targeting short paths as a design criterion in human as well as infrastructural networks that is generally understood in terms of two related ideas: that weak-ties enable rapid diffusion of information (Watts and Strogatz 1998) and that bridging structural holes can be associated with innovation (Burt 2004).
Although these are important issues, there are also advantages to modularity – having teams or groups in organizations that are relatively separate but internally cohesive – but this has to our knowledge been omitted as a network design criterion. Within organizations, internally cohesive groups tend to use similar language constructs, which enables high-bandwidth communication (Aral and Van Alstyne 2011) and increases their effectiveness (Hansen 1999, Reagans and Zuckerman 2001), especially for problems that require extensive information-space searching or coordination (Shore et al. 2013a). Additionally, certain types of information and behaviors spread more easily within rather than between clusters of connected individuals (Centola 2010). Finally, real organizations are usually structured in divisions, work groups, or teams — lending an added importance to incorporating some notion of modularity into network design work. Despite all of this, the design literature has yet to address network contexts in which modularity is desirable, keeping design off of the table for most applications to human organizations.
Two major issues may have stood in the way of incorporating modularity into design work. First, obtaining modularity and short path lengths imply quite different network structures, making theoretical analysis that encompasses both properties difficult. Second, the space of all possible networks is combinatorially large, making the design problem formidably complex (for example, the number of possible undirected graphs with 16 nodes is , or approximately — far too many to evaluate individually by any known means).
Here, we propose a design framework that addresses both issues simultaneously: we frame the network design problem in a way that lets the designer trade off between modularity and mixing time, and we propose an algorithm that can find optimal or near-optimal graphs under these criteria. Specifically, for the design framework, we take advantage of prior literature in the area of spectral graph theory and demonstrate how desirable aspects of organizational structure can be mapped parsimoniously onto the spectrum of the graph Laplacian (Chung 1997) derived from a matrix representation of that communication structure. Recent advances in convex and non-convex optimization allow us to capture these spectral elements in an objective function to be optimized. We go on to present examples of the communications structures produced under this method that balance modularity and mixing time and discuss the implications of their properties. Specifically, rather than structural “brokerage,” we find that networks with a “liaison” structure offer more modularity for a given mixing velocity. Beyond our specific results, however, our more general contribution is to provide a framework for both specifying and solving principled problems in network design.
2 Spectral Theory Informs Design
Spectral graph theory (Chung 1997, Cvetkovic et al. 1980) is concerned with the relationships between the structure of a network and the eigenvalues, also called the “spectrum,” of the matrix representation of that network. One major advantage of thinking of networks in terms of their spectra is that spectra are insensitive to permutations and labeling. All networks with the same structure have the same spectrum. This property lets us avoid having to deal with the so-called “graph isomorphism problem,” where many equivalent representations for structurally isomorphic graphs exist, making search and classification in graph space difficult. In essence, working with spectra lets us focus on more tractable and compact objects, which correspond to unique graphs with high probability (see section 2.3). Moreover, the values of the spectrum provide enormously useful information about graph structure in a compact and accessible way. These properties make spectra ideal mathematical objects to use in formalizing desiderata and constraints in network design problems.
In this paper, we adopt a particular design objective: we aim to design networks that both manifest distinct subgroups and yet are still “sufficiently connected.” As we have seen in the previous section, these are well motivated goals. However, it is not obvious how to formalize them. Spectral theory gives us a means to frame this precisely. Existing work has not examined such an objective; we provide:
2.1 Preliminaries
The standard matrix representation of a graph, where each entry represents the strength of the connection between the node indexed by the matrix row and column, is called the adjacency matrix. In this paper, we assume that each individual in the organization has equal capacity to communicate that they use fully. This implies that our matrix representations of the network must have rows and columns that can be normalized so that they all sum to 1; such matrices are called “doubly stochastic.” Further, we assume that a given communication tie takes the same proportion of each connected individual’s communication capacity.111Formally, this property holds that the rows are scalar multiples of the columns. Together, these properties imply that the matrix representation of the network must be symmetric about its diagonal.
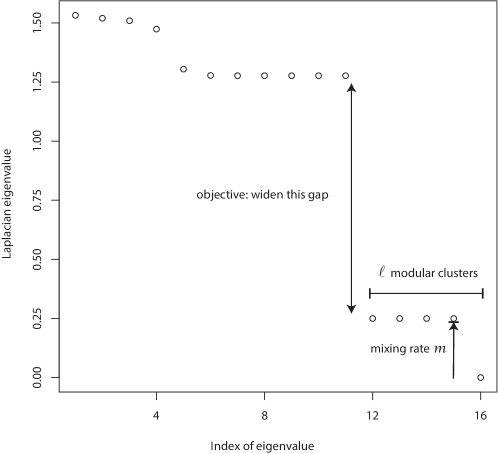
Instead of working with the adjacency matrix, it can be useful to work with the graph Laplacian matrix given, for stochastic graphs, by , where is the identity matrix and the adjacency matrix.222In general the Laplacian is given by , where is the degree matrix, constructed by putting the row sums of on the diagonal, with zeros elsewhere. The spectrum of the adjacency and Laplacian matrices are related but have distinct properties; those of the Laplacian match our needs, and consequently we adopt it here. The matrix spectrum is simply the multiset of eigenvalues, sorted in decreasing order of magnitude.333 The eigenvalues of a matrix are given by . The are called the eigenvectors of the matrix: those vectors that when multiplied by the matrix yield a scaled copy of themselves. Each scale factor is a corresponding eigenvalue, . Such a spectrum can be plotted as a set of points, as illustrated in Figure 1 and elaborated upon below.
2.2 The Laplacian Spectrum and Network Structure
The relative magnitude of the various spectral values correspond to specific structural properties of the corresponding network. We describe those necessary for capturing our design objective below.
2.2.1 Bounding Mixing Time with
The magnitude of the smallest Laplacian eigenvalue (hereafter, just “eigenvalue” for brevity) is always zero, and therefore of little immediate interest. However, the magnitude of the second smallest eigenvalue is also the graph’s “algebraic connectivity” (Fiedler 1973) and is inversely related to the mixing time for Markov chains (Mohar 1997). In short, the larger the second smallest eigenvalue, the faster we expect information to diffuse through the network (Donetti et al. 2006). Because of its known connection to mixing time, we refer to the magnitude of the second smallest eigenvalue as (see Figure 1). By tuning , a network designer has a spectral method for formalizing the idea of “sufficiently connected:” the larger the , the more rapidly that communication structure is expected to diffuse information. However, raising may come at the cost of other desirable features, such as the amount of modularity that is manifest in the network, as we shall see shortly.
2.2.2 Setting the Number of Modular Clusters with
It is well known that the number of connected components of an undirected graph is equal to the number eigenvalues of the Laplacian that are equal to zero (Brouwer and Haemers 2011). For example, if there were four totally disconnected components, there would be four eigenvalues equal to zero. If, however, there existed weak connections among those distinct communities such that they are no longer disconnected components but rather modular clusters, then rather than having one zero for each cluster, we would have one small eigenvalue for each module (Donetti et al. 2006). Consequently, for a graph consisting of four modular clusters that are weakly connected to each other, the spectrum of the Laplacian (hereafter “spectrum”) would contain four small eigenvalues, one of which would be zero (as there would be one component, and thus one eigenvalue equal to zero).
From the design point of view, then, we observe that if one desires a communication network with some number, , distinct modular clusters, then one should construct a graph with a spectrum containing small eigenvalues, one of which is zero (see Figure 1).
2.2.3 Maximizing Modularity with the Rest of the Spectrum
We have just argued that to generate modular clusters we want small eigenvalues because a structurally separate portion of the graph will be established for each small eigenvalue present in the spectrum. By the same logic, if we want the next most significant structural division to be minimized, we should seek to make the eigenvalue as large as possible.
We then consider the effect of raising the eigenvalue on the balance of the spectrum. We note that the sum of all of the eigenvalues is constrained to equal to (Chung 1997, p. 6)444As long as there are no isolated vertices, which will be the case for us and consequently:
| (1) |
Further, suppose we hold the smallest eigenvalues constant, as will happen when they are against their lower bound. Then the right side of equation 1 will be a known constant. In general, driving up the smallest of a set of numbers whose sum is constrained at some number , will push these numbers to each take the value (see Theorem 1 below for more detail). Such constant spectra correspond to homogeneously connected networks (Chung 1997, p. 6). Thus, because our maximization will tend to equalize the large eigenvalues, we are minimizing any additional remaining structural divisions.
A theorem provided by Newman and Kel’mans enables us to add an additional intuition as to why this is true (Newman 2000):
| (2) |
where is a graph and is its complement.555Informally, the complement has weight wherever the primary graph does not and vice versa. This theorem provides that the largest eigenvalue is equivalent to the smallest eigenvalue of the complementary graph. So, by driving down the largest eigenvalue in the primary graph, , we are driving up the smallest non-zero eigenvalue, , of the complementary graph, increasing its mixing rate. This then, in the primary graph is equivalent to increasing modularity by reducing the between-module weight as much as possible.
Thus in sum, the larger the eigenvalue, the more modular the resulting graph, holding the first eigenvalues constant.
2.3 Co-Spectral Graphs
It is one thing to calculate the spectrum of a known graph and quite another to construct a graph with a given spectrum. We are more concerned with the latter problem. The next section details our method for constructing matrices with desirable spectral properties. Before we do so, however, we must take note of the issue of co-spectral graphs, or non-isomorphic graphs with the same spectrum (Godsil and McKay 1982, Harary et al. 1971).
Although at present relatively little is known about which graphs have co-spectral partners (Van Dam and Haemers 2003), we do not believe this presents an impediment to the present undertaking. Most fundamentally, we are presenting a framework for designing communication networks with properties that have spectral correlates. If by chance we construct a graph for which there exists a co-spectral partner that we do not find, we will have still achieved our design goal, because co-spectral graphs have similar structure with respect to the features captured by that spectrum.
Additionally, but less essentially, enumerations of unweighted graphs that are co-spectral with respect to their Laplacian (Brouwer and Spence 2009, Cvetković 2012, Haemers and Spence 2004) show that the proportion of graphs with co-spectral partners is highest at and decreases as and the number of edges increase. Halbeisen and Hungerbühler (2000) show that for weighted graphs — which we employ here — there are almost surely no co-spectral partners. Therefore, we assert that by constructing weighted networks according to spectral parameters, we are not leaving anything important to our aims on the table.
3 Methods
Spectral theory has given us the means to formalize both of our design objectives:
-
•
Sufficient connectivity, by imposing a lower bound, , on the second smallest eigenvalue , which ensures a fast enough mixing time.
-
•
Modularity with clusters, by having small eigenvalues and large eigenvalues.
Our network design problem can then be cast as the following non-linear optimization problem:
| (3) | ||||
| (4) | ||||
| (5) | ||||
| (6) |
where is the eigenvalue of the matrix . The objective, equation 3, maximizes the difference between the and Laplacian eigenvalue. Constraint 4 ensures that the mixing rate is at least . Constraints 5 and 6 ensure stochasticity and symmetry respectively. Note that the variables in this formulation are the weights of matrix .
3.1 Optimization Algorithm
The “eigenvalue problem,” that of computing the eigenvalues of a known matrix, can be calculated in closed form for small matrices, and for large matrices by numerical algorithms, for example QR, that have been known since the early sixties (Francis 1961, 1962). However, the “inverse eigenvalue problem,” that of finding the graph that corresponds to a specific spectrum or to specific spectral characteristics has proven vastly harder to solve (Chu 1998). Most such problems admit no computationally tractable algorithm for obtaining a globally optimal solution.
Our formulation falls within this hard class, and thus the best we can hope for is a high-quality approximation algorithm. We are not aware of any existing work that has looked at solving our particular spectral objective and constraints. We have therefore constructed our own solution method by leveraging recent advances in Semi-Definite Programming (SDP) and Difference in Convex (DC) programming, which we describe next.
3.1.1 Semi-Definite Programming
SDP is a type of convex optimization that operates over a matrix variable, instead of the scalar variables seen in other convex optimization methods (Vandenberghe and Boyd 1996). SDP objectives are specified as the inner product of the matrix variable, with a user-specified constant matrix. Similarly, SDP constraints consist of a bound on the inner product between the matrix variable and another user-specified constant matrix. The minimal value for the objective is found, where the matrix variable is drawn from the cone of semi-definite matrices. Many problems can be cast into this structure, and because the resulting formulation is convex, it can be solved efficiently by, for example, interior point methods (Alizadeh 1995, Todd 2001, Wolkowicz et al. 2000).
For the present work, the key property of SDP is its ability to capture the sum of the smallest Laplacian eigenvalues, , as a concave function of the matrix weights, the maximization of which is a convex optimization. Boyd (2006) and colleagues use this capability to solve certain Laplacian inverse eigenvalue problems directly (Boyd et al. 2004, Boyd 2006). For example, they formulate as a concave function which they maximize via SDP to efficiently solve for the matrix corresponding to the Markov process with the fastest mixing time. We leverage their result by moving their objective formulation to a constraint, obtaining a convex form for equation 4. Further, as the remaining constraints are linear, only our objective 3 fails to be directly representable as an SDP, which we address next.
We start by noting that and . And thus our objective in equation 3 can be rewritten as:
| (7) |
This objective captures our intent, and can be formulated by known SDP-style expressions. However, it can not be directly solved because, when treated as a maximization and not a minimization, the third term is non-convex.
3.1.2 Difference in Convex Programming
As we have seen, the formulation of equation 3 given in equation 7, is almost convex and solvable as an SDP, but not quite. Consequently, we are not going to be able to directly use convex optimization, and the best we can hope for is an approximately optimal algorithm. However, equation 7 is a difference of convex functions and, as such, is amenable to an algorithm known as the Concave-Convex Procedure (Yuille et al. 2002, Yuille and Rangarajan 2003). This is an iterative method for obtaining approximate solutions to problems with convex and concave components in the objective that has good convergence properties (Sriperumbudur and Lanckriet 2009). Our approach is to implement the Concave-Convex Procedure over our SDP formulation.666The Concave-Convex Procedure has generally been used for simpler optimization formalisms in the literature, here we adapt it to the more expressive SDP context. Our approach is as follows:
We start with a random initial graph . We then form a first-order Taylor expansion of the concave portion of the objective around . Using this linear form, we can then approximate the objective as:
| (8) |
This then, is directly representable as an SDP, which we solve using the CVX package (Grant and Boyd 2012, 2008). We then set and repeat until convergence.
3.2 Bounding the Objective Value
Because the solution found by our optimization algorithm may be only locally optimal, it is useful to have a theoretical upper bound on the objective value in equation 3. When the objective value of the solution found by our numerical calculations approaches the bound, we have found an approximately optimal graph.777However, the converse does not necessarily follow: solutions far from the bound may still be near-optimal when the bound is loose. Accordingly, we can take advantage of the following:
Theorem 1.
gives an upper bound on the non-convex objective in equation 3.
Proof.
always and for by constraint 4, a lower bound on each of these eigenvalues. This implies . There is a known result that (Chung 1997). Subtracting the first from the second yields , an upper bound on the large eigenvalues. The smallest of these, , is made maximal at this bound and when these eigenvalues are of equal size, giving it a value of . Subtracting our upper bound on from our lower bound on gives an overall objective upper bound of: .∎
4 Results
We next describe several experiments we have conducted to find approximately optimal graphs according to our spectral design framework.
4.1 Properties of Spectrally Designed Communication Networks
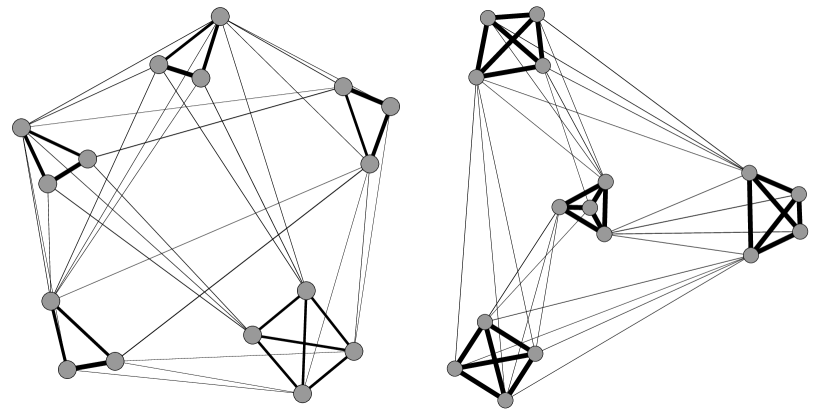
Figure 2 shows two examples of networks produced by our framework, with the weakest ties omitted for visual clarity. Several features are immediately apparent. As expected, these networks have a modular structure, with strong intra-team connections. Additionally, there are weak ties connecting the teams in patterns that appear in the visualization as “fans.” Intuitively, one could think of these fans as ties from one representative of a team to (usually) all the members of another team — more of a “liaison” than a broker (e.g. Burt 2001). We are not aware of graphs similar to our results appearing previously in the literature on network structure.
The global disposition of the inter-team liaisons has a definite structure, suggestive of a hierarchical “spiral” in the visualizations. In the right hand side of Figure 2, the central team has three “outgoing” liaisons; the team to the right has two; the team at the top has one; and the team at the bottom has none.
Interestingly, although our design criteria do not include hierarchy or centralization, our results nonetheless show these features. With three out-going liaisons, the central team is at one end of the hierarchy, perhaps at the top. In this team, there is a leader-like individual who is not a liaison to any other team. However, this individual has two singleton weak ties to individuals in other teams, shortening the “leader’s” paths to much of the rest of the network.
4.2 Optimality of Results
| optimality | |||
|---|---|---|---|
| 16 | 6 | 0.15 | 0.938 |
| 16 | 6 | 0.20 | 0.938 |
| 16 | 6 | 0.25 | 0.938 |
| 16 | 5 | 0.15 | 0.917 |
| 16 | 5 | 0.20 | 0.919 |
| 16 | 5 | 0.25 | 0.922 |
| 16 | 4 | 0.15 | 1.000 |
| 16 | 4 | 0.20 | 1.000 |
| 16 | 4 | 0.25 | 0.999 |
| 32 | 8 | 0.15 | 0.937 |
| 32 | 8 | 0.20 | 0.939 |
| 32 | 6 | 0.20 | 0.975 |
| 32 | 4 | 0.15 | 0.984 |
| 32 | 4 | 0.20 | 0.978 |
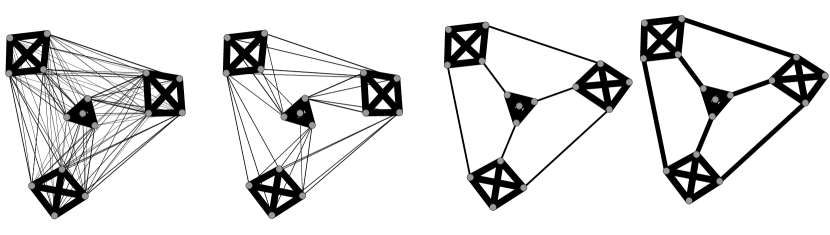
Table 1 gives the best objective values we achieved, divided by the theoretical upper bound calculated for each set of parameter values, as described in section 3.2. Each data point represents the best of 2000 independent random starting points of our algorithm, obtained by running each in parallel on a 100 node computational cluster. Each such pass through the algorithm generally completes in less than 2 hours of CPU time on modern Xeon-class hardware. From the table we see that our algorithm is finding answers that are very near our bound in most of the cases. Where some gap remains, it is unknown if this is due to the bound being loose for these combinations of parameters, or the algorithm failing to find a sufficiently global optimum.
4.3 Spectral Impact of Inter-Team Connection Types
In this section we compare our results with similar and simpler networks. Before doing so, however, we address the following methodological detail: our algorithm’s output is doubly stochastic, but other networks are not necessarily so, preventing direct comparison of their spectra. In order to address this, we re-normalize by iteratively row-normalizing then averaging the resulting matrix with its transpose until we have achieved double-stochasticity.
4.3.1 Full versus Truncated Result
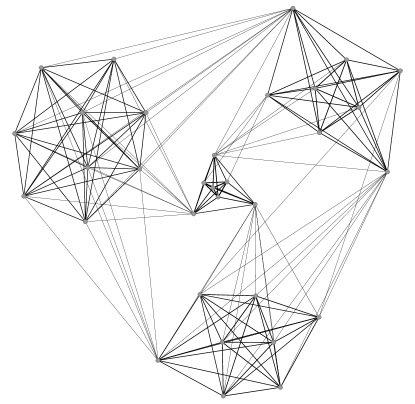
As noted above, the visualizations in Figure 2 truncate the algorithm output such that the very weakest links are not drawn. In addition to making the structure of the networks more apparent to the eye, simplified versions of the full result would certainly be easier to implement in practice. The two left-hand networks in Figure 4 visualize the difference between the full and truncated results.

Figure 5 shows the effect of such truncation on the spectrum. The full solution is essentially optimal; truncation produces a slightly sub-optimal spectrum, but the deviation is relatively minor. The right-hand side of the truncated spectrum shows that the mixing rate is lower than the full result, and the left hand side shows slight deviation from maximum modularity. In sum, although truncation moves us a step from the theoretical optimum, it is a small step and a more pragmatic alternative where implementation is important.
4.3.2 Liaisons versus Brokers
Literature on social networks has tended to focus on the role of brokers in organizations (Burt 2001), rather than the liaisons we describe here. In order to compare the spectra of networks connected by brokers, rather than liaisons, we hand-constructed two such networks. In both cases, we replaced inter-team liaisons with brokers. In the first (third from the left in Figure 4 and the open triangles in Figure 5), we set the weight of the inter-team ties to be equal to the sum of the weights in a liaison’s weak ties. In the second (right-hand side of Figure 4 and the filled triangles in Figure 5), we set all ties to equal weight before normalizing for double-stochasticity, resulting in stronger brokerage ties.
We find that the network with stronger brokers has a similar mixing time to the full result of our algorithm, but it is much further from optimum modularity than our result. The network with weaker brokers (equal to the weight of the liaison’s ties) has slower mixing time than our result, but it is closer to maximum modularity than the network with strong brokers.
Overall, we observe that for a given rate of mixing, brokers produce a less modular network than liaisons. Alternatively, for a certain amount of weight on inter-team ties, liaisons achieve a faster mixing rate than brokers.
5 Discussion
5.1 Spectrally Specified Structures
Through the spectral optimization technique we developed, we have created networks with novel structural features. In particular, what we call “liaisons” — individuals with strong connections in one team and weaker connections to multiple (usually all) members of another team — maximize modularity, while maintaining a high degree of inter-team connectivity.
We can elucidate the global structure of these networks, by constructing simplified representational graphs. To do this, we collapse each connected clique to a single node and replace each “fan” of liaison edges by a single directed link. Figure 6 shows the result of this process on the original graph on the right side of Figure 2, revealing that the resulting structure is a directed acyclic graph, that is, a strict hierarchy. Accordingly, the networks admit interpretation such as the following. The top of the hierarchy could be the leadership team. At the other end of the hierarchy, at the bottom of the figure, is a team that receives representatives from all the other divisions, suggesting a function depended on by all: perhaps an infrastructure or operations team.
These communication structures are finely articulated, but this need not present a barrier to implementation on a computer mediated communication platform. One plausible implementation of tie strength would be as a fraction of the problem solving time spent “together,” with the opportunity to exchange ideas or observe the progress of others. On such a platform it would also be easy to tune the importance of the weaker ties to increase either the speed of information diffusion (with stronger ties), or the importance of separate teams (with weaker ties), even over time to respond to the collective progress within the network.
Thus, in platforms with a high degree of control over participant ties, the network structures proposed here can be directly imposed on them. Alternatively, rather than implement the network directly, we could follow a path inspired by mechanism design (e.g. Myerson 1988), and create rules or technologies by which self-interested individuals would choose to construct spectrally optimal networks themselves. We leave it to future work to determine which rules would achieve these structures, and to analyze their dynamics, equilibria, and properties.
5.2 Spectral framework
Beyond our argument for network design in general, we have identified a framework for performing such design. By building our framework around the graph Laplacian spectrum, we have enabled the targeting of many key network properties. These include not only the modularity and mixing time we have focused on here, but also degree distribution, hierarchical structure, and many other graph properties. Thus, by defining objectives and constraints spectrally, and by providing a non-convex optimization method for realizing graphs with such spectra, a whole family of design problems become solvable. Accordingly, there are several further computational experiments that future research may wish to investigate, and we highlight a few here.
In this paper, we assume that all individuals have equal communications capacities, but in the real world, some people are more capable than others. To capture this variation, future experiments could drop the requirement that networks be representable by doubly-stochastic graphs, allowing some people to carry more communicative weight. Further, with suitable additions to the optimization formulation, the matrix symmetry constraint could be relaxed in order to investigate directed graphs in similar settings.
In this paper, we have looked at graphs with a single large step in their spectra. However, by including more than one step, graphs with more than one level of hierarchical structure would be created. Future work could investigate such graphs by including additional spectral objective terms in the formulation presented here.
Of course, design work is only as good as the theory that supports it. Design results should be tested experimentally using real human problem solvers to assess their performance in crowdsourcing tasks and knowledge management settings, relative to alternatives from the literature. Field work could also seek out empirical evidence that deepens our understanding of how organizations that are similar to networks proposed by our design framework operate in practice. Relevant to the specific results we present here, for example, would be study of organizations such as university administrations or the United States government that utilize “liaison officers” to link multiple divisions or teams together. All of this further evidence would be invaluable in informing future improvements to design methodology.
5.3 Conclusion
Beyond describing networks, many practical settings call for designing them. For networks of humans, the benefits of network modularity have been been well documented in research on networked problem solving, above and beyond the well-explored benefits of short average path lengths between all members of an organization. However, prior work on network design has not incorporated these insights. Our contribution has been to fill this gap, drawing connections between research on networked problem solving, spectral graph theory, and non-convex optimization to both construct a design methodology and use that methodology to generate novel structures for communication networks.
References
- Alavi and Leidner [2001] Maryam Alavi and Dorothy E Leidner. Review: Knowledge management and knowledge management systems: Conceptual foundations and research issues. MIS Quarterly, 25(1):107–136, 2001.
- Alizadeh [1995] Farid Alizadeh. Interior point methods in semidefinite programming with applications to combinatorial optimization. SIAM Journal on Optimization, 5(1):13–51, 1995.
- Aral and Van Alstyne [2011] Sinan Aral and Marshall Van Alstyne. The diversity-bandwidth trade-off. American Journal of Sociology, 117(1):90–171, 2011.
- Aral et al. [2013] Sinan Aral, Chrysanthos Dellarocas, and David Godes. Introduction to the special issue–social media and business transformation: A framework for research. Information Systems Research, 24(1):3–13, 2013.
- Bae et al. [2011] Jonghoon Bae, Filippo Carlo Wezel, and Jun Koo. Cross-cutting ties, organizational density, and new firm formation in the US biotech industry, 1994–98. Academy of Management Journal, 54(2):295–311, 2011.
- Balakrishnan et al. [1989] Anantaram Balakrishnan, Thomas L Magnanti, and Richard T Wong. A dual-ascent procedure for large-scale uncapacitated network design. Operations Research, 37(5):716–740, 1989.
- Bavelas [1950] Alex Bavelas. Communication patterns in task-oriented groups. The Journal of the Acoustical Society of America, 22(6):725–730, 1950.
- Borgatti and Cross [2003] Stephen P Borgatti and Rob Cross. A relational view of information seeking and learning in social networks. Management Science, 49(4):432–445, 2003.
- Boudreau [2010] Kevin Boudreau. Open platform strategies and innovation: Granting access vs. devolving control. Management Science, 56(10):1849–1872, 2010.
- Boudreau et al. [2011] Kevin J Boudreau, Nicola Lacetera, and Karim R Lakhani. Incentives and problem uncertainty in innovation contests: An empirical analysis. Management Science, 57(5):843–863, 2011.
- Boyd [2006] Stephen Boyd. Convex optimization of graph laplacian eigenvalues. In Proceedings of the International Congress of Mathematicians: Madrid, August 22-30, 2006: invited lectures, pages 1311–1320, 2006.
- Boyd et al. [2004] Stephen Boyd, Persi Diaconis, and Lin Xiao. Fastest mixing markov chain on a graph. SIAM review, 46(4):667–689, 2004.
- Brouwer and Haemers [2011] Andries E Brouwer and Willem H Haemers. Spectra of graphs. Springer, 2011.
- Brouwer and Spence [2009] Andries E Brouwer and Edward Spence. Cospectral graphs on 12 vertices. The Electronic Journal of Combinatorics, 16(20):1, 2009.
- Burt [2001] Ronald S Burt. Structural holes versus network closure as social capital. In Nan Lin, Karen S. Cook, and Ronald S. Burt, editors, Social Capital: Theory and Research. Transaction Publishers, New Brunswick, 2001.
- Burt [2004] Ronald S Burt. Structural holes and good ideas. American Journal of Sociology, 110(2):349–399, 2004.
- Capaldo [2007] Antonio Capaldo. Network structure and innovation: The leveraging of a dual network as a distinctive relational capability. Strategic Management Journal, 28(6):585–608, 2007.
- Centola [2010] Damon Centola. The spread of behavior in an online social network experiment. Science, 329(5996):1194–1197, 2010.
- Chu [1998] Moody T Chu. Inverse eigenvalue problems. SIAM Review, 40(1):1–39, 1998.
- Chung [1997] Fan RK Chung. Spectral graph theory, volume 92. AMS Bookstore, 1997.
- Cummings and Cross [2003] Jonathon N Cummings and Rob Cross. Structural properties of work groups and their consequences for performance. Social Networks, 25(3):197–210, 2003.
- Cvetković [2012] Dragoš Cvetković. Spectral recognition of graphs. The Yugoslav Journal of Operations Research, 22(2), 2012.
- Cvetkovic et al. [1980] Dragos M Cvetkovic, Michael Doob, and Horst Sachs. Spectra of graphs: Theory and application, volume 413. Academic press New York, 1980.
- Di Gangi et al. [2010] Paul Michael Di Gangi, Molly Wasko, and Robert Hooker. Getting customers’ ideas to work for you: Learning from Dell how to succeed with online user innovation communities. MIS Quarterly Executive, 9(4):213–228, 2010.
- Dionne and Florian [1979] René Dionne and Michael Florian. Exact and approximate algorithms for optimal network design. Networks, 9(1):37–59, 1979.
- Donetti et al. [2005] Luca Donetti, Pablo I Hurtado, and Miguel A Munoz. Entangled networks, synchronization, and optimal network topology. Physical Review Letters, 95(18):188701, 2005.
- Donetti et al. [2006] Luca Donetti, Franco Neri, and Miguel A Muñoz. Optimal network topologies: Expanders, cages, Ramanujan graphs, entangled networks and all that. Journal of Statistical Mechanics: Theory and Experiment, 2006(08):P08007, 2006.
- Estrada [2007] Ernesto Estrada. Graphs (networks) with golden spectral ratio. Chaos, Solitons & Fractals, 33(4):1168–1182, 2007.
- Fiedler [1973] Miroslav Fiedler. Algebraic connectivity of graphs. Czechoslovak Mathematical Journal, 23(2):298–305, 1973.
- Francis [1961] John GF Francis. The QR transformation a unitary analogue to the LR transformation–part 1. The Computer Journal, 4(3):265–271, 1961.
- Francis [1962] John GF Francis. The QR transformation–part 2. The Computer Journal, 4(4):332–345, 1962.
- Godsil and McKay [1982] Chris D Godsil and BD McKay. Constructing cospectral graphs. Aequationes Mathematicae, 25(1):257–268, 1982.
- Grant and Boyd [2008] Michael Grant and Stephen Boyd. Graph implementations for nonsmooth convex programs. In V. Blondel, S. Boyd, and H. Kimura, editors, Recent Advances in Learning and Control, Lecture Notes in Control and Information Sciences, pages 95–110. Springer-Verlag Limited, 2008. http://stanford.edu/~boyd/graph_dcp.html.
- Grant and Boyd [2012] Michael Grant and Stephen Boyd. CVX: Matlab software for disciplined convex programming, version 2.0 beta. http://cvxr.com/cvx, September 2012.
- Guimerà et al. [2002] Roger Guimerà, Albert Díaz-Guilera, Fernando Vega-Redondo, Antonio Cabrales, and Alex Arenas. Optimal network topologies for local search with congestion. Physical Review Letters, 89(24):248701, 2002.
- Guinan et al. [2013] Eva C. Guinan, Kevin J. Boudreau, and Karim R. Lakhani. Experiments in open innovation at Harvard Medical School. MIT Sloan Management Review, 54(3):45–52, 2013.
- Gulati et al. [2012] Ranjay Gulati, Maxim Sytch, and Adam Tatarynowicz. The rise and fall of small worlds: Exploring the dynamics of social structure. Organization Science, 23(2):449–471, 2012.
- Haemers and Spence [2004] Willem H Haemers and Edward Spence. Enumeration of cospectral graphs. European Journal of Combinatorics, 25(2):199–211, 2004.
- Halbeisen and Hungerbühler [2000] Lorenz Halbeisen and Norbert Hungerbühler. Reconstruction of weighted graphs by their spectrum. European Journal of Combinatorics, 21(5):641–650, 2000.
- Hansen [1999] Morten T Hansen. The search-transfer problem: The role of weak ties in sharing knowledge across organization subunits. Administrative Science Quarterly, 44(1):82–111, 1999.
- Harary et al. [1971] Frank Harary, Clarence King, Abbe Mowshowitz, and Ronald C Read. Cospectral graphs and digraphs. Bulletin of the London Mathematical Society, 3(3):321–328, 1971.
- Huang and Cummings [2011] Siyuan Huang and Jonathon N Cummings. When critical knowledge is most critical centralization in knowledge-intensive teams. Small Group Research, 42(6):669–699, 2011.
- Ipeirotis et al. [2010] Panagiotis G Ipeirotis, Foster Provost, and Jing Wang. Quality management on Amazon Mechanical Turk. In Proceedings of the ACM SIGKDD workshop on human computation, pages 64–67. ACM, 2010.
- Kearns [2012] Michael Kearns. Experiments in social computation. Communications of the ACM, 55(10):56–67, 2012.
- Kershenbaum et al. [1991] Aaron Kershenbaum, Parviz Kermani, and George A Grover. MENTOR: an algorithm for mesh network topological optimization and routing. Communications, IEEE Transactions on, 39(4):503–513, 1991.
- Kohler et al. [2011] Thomas Kohler, Johann Fueller, Kurt Matzler, and Daniel Stieger. Co-creation in virtual worlds: The design of the user experience. MIS Quarterly, 35(3):773–788, 2011.
- Lakhani and Jeppesen [2007] Karim R Lakhani and Lars Bo Jeppesen. R&D: Getting unusual suspects to solve R&D puzzles. Harvard Business Review, 85(5):30–32, 2007.
- Lakhani and Panetta [2007] Karim R Lakhani and Jill A Panetta. The principles of distributed innovation. innovations, 2(3):97–112, 2007.
- Lazer and Friedman [2007] David Lazer and Allan Friedman. The network structure of exploration and exploitation. Administrative Science Quarterly, 52(4):667–694, 2007.
- Lovejoy and Sinha [2010] William S Lovejoy and Amitabh Sinha. Efficient structures for innovative social networks. Management Science, 56(7):1127–1145, 2010.
- Lubotzky et al. [1988] Alexander Lubotzky, Ralph Phillips, and Peter Sarnak. Ramanujan graphs. Combinatorica, 8(3):261–277, 1988.
- Magnanti and Wong [1984] Thomas L Magnanti and Richard T Wong. Network design and transportation planning: Models and algorithms. Transportation Science, 18(1):1–55, 1984.
- Mason and Watts [2012] Winter Mason and Duncan J Watts. Collaborative learning in networks. Proceedings of the National Academy of Sciences, 109(3):764–769, 2012.
- Mason et al. [2008] Winter A Mason, Andy Jones, and Robert L Goldstone. Propagation of innovations in networked groups. Journal of Experimental Psychology: General, 137(3):422, 2008.
- McCubbins et al. [2009] Mathew D McCubbins, Ramamohan Paturi, and Nicholas Weller. Connected coordination network structure and group coordination. American Politics Research, 37(5):899–920, 2009.
- McEvily and Marcus [2005] Bill McEvily and Alfred Marcus. Embedded ties and the acquisition of competitive capabilities. Strategic Management Journal, 26(11):1033–1055, 2005.
- Minoux [1989] Michel Minoux. Networks synthesis and optimum network design problems: Models, solution methods and applications. Networks, 19(3):313–360, 1989.
- Mohar [1997] Bojan Mohar. Some applications of Laplace eigenvalues of graphs. Springer, 1997.
- Myerson [1988] Roger B Myerson. Mechanism design. Center for Mathematical Studies in Economics and Management Science, Northwestern University, 1988.
- Newman [2000] Michael William Newman. The Laplacian Spectrum of Graphs. PhD thesis, University of Manitoba, 2000.
- Reagans and Zuckerman [2001] Ray Reagans and Ezra W Zuckerman. Networks, diversity, and productivity: The social capital of corporate r&d teams. Organization Science, 12(4):502–517, 2001.
- Shore et al. [2013a] Jesse Shore, Ethan Bernstein, and David Lazer. Exploration, exploitation and explication in networked learning. In Presented at Organization Science Winter Conference. INFORMS, 2013a.
- Shore et al. [2013b] Jesse Shore, Catherine J Chu, and Matt T Bianchi. Power laws and fragility in flow networks. Social Networks, 2013b.
- Sparrowe et al. [2001] Raymond T Sparrowe, Robert C Liden, Sandy J Wayne, and Maria L Kraimer. Social networks and the performance of individuals and groups. Academy of Management Journal, 44(2):316–325, 2001.
- Sriperumbudur and Lanckriet [2009] Bharath Sriperumbudur and Gert Lanckriet. On the convergence of the concave-convex procedure. Advances in neural information processing systems, 22:1759–1767, 2009.
- Suri and Watts [2011] Siddharth Suri and Duncan J Watts. Cooperation and contagion in web-based, networked public goods experiments. PLoS One, 6(3):e16836, 2011.
- Todd [2001] Michael J Todd. Semidefinite optimization. Acta Numerica, 10(515-560):126, 2001.
- Van Dam and Haemers [2003] Edwin R Van Dam and Willem H Haemers. Which graphs are determined by their spectrum? Linear Algebra and its Applications, 373:241–272, 2003.
- Vandenberghe and Boyd [1996] Lieven Vandenberghe and Stephen Boyd. Semidefinite programming. SIAM review, 38(1):49–95, 1996.
- Von Ahn [2009] Luis Von Ahn. Human computation. In Design Automation Conference, 2009. DAC’09. 46th ACM/IEEE, pages 418–419. IEEE, 2009.
- Watts and Strogatz [1998] Duncan Watts and S Strogatz. Collective dynamics of small-world networks. Nature, 393:440–442, 1998.
- Winter [1987] Pawel Winter. Steiner problem in networks: a survey. Networks, 17(2):129–167, 1987.
- Wolkowicz et al. [2000] Henry Wolkowicz, Romesh Saigal, and Lieven Vandenberghe. Handbook of semidefinite programming: theory, algorithms, and applications, volume 27. Kluwer Academic Pub, 2000.
- Yuille and Rangarajan [2003] Alan L Yuille and Anand Rangarajan. The concave-convex procedure. Neural Computation, 15(4):915–936, 2003.
- Yuille et al. [2002] Alan L Yuille, Anand Rangarajan, and AL Yuille. The concave-convex procedure (CCCP). Advances in Neural Information Processing Systems, 2:1033–1040, 2002.
- Zeng and Wei [2013] Xiaohua Zeng and Liyuan Wei. Social ties and user content generation: Evidence from Flickr. Information Systems Research, 24(1):71–87, 2013.
- Zheng et al. [2011] Haichao Zheng, Dahui Li, and Wenhua Hou. Task design, motivation, and participation in crowdsourcing contests. International Journal of Electronic Commerce, 15(4):57–88, 2011.