Doping influence of spin dynamics and magnetoelectric effect in hexagonal Y0.7Lu0.3MnO3
Abstract
We use inelastic neutron scattering to study spin waves and their correlation with the magnetoelectric effect in Y0.7Lu0.3MnO3. In the undoped YMnO3 and LuMnO3, the Mn trimerization distortion has been suggested to play a key role in determining the magnetic structure and the magnetoelectric effect. In Y0.7Lu0.3MnO3, we find a much smaller in-plane (hexagonal -plane) single ion anisotropy gap that coincides with a weaker in-plane dielectric anomaly at . Since both the smaller in-plane anisotropy gap and the weaker in-plane dielectric anomaly are coupled to a weaker Mn trimerization distortion in Y0.7Lu0.3MnO3 comparing to YMnO3 and LuMnO3, we conclude that the Mn trimerization is responsible for the magnetoelectric effect and multiferroic phenomenon in Y1-yLuyMnO3.
pacs:
75.30.Ds, 75.40.Gb, 75.50.Ee, 75.85.+tDriven by modern technology towards device miniaturization, there is considerable interest in multiferroic materials which exhibit both magnetic order and electrical polarization Fiebig-JPD-2005 ; Fiebig-science-2005 ; Tokura-science-2006 ; Eerenstein-nature-2006 ; Kimura-nature-2003 ; Hur-nature-2004 ; cheong-nature-mater-2007 . The hexagonal manganite MnO3Fiebig-natute-2002 ; Lottermoser-nature-2004 (where is a rare-earth element with relatively small ionic radius) is a prototypical example of the so-called type-I multiferroics Harris-book with ferroelectric order at 900 K Choi-Nature-mater-2010 and an antiferromagnetic (AFM) order at much lower temperature, 100 K Tomuta-2001 . A large dielectric anomaly occurs at TN Iwata-1998 ; Huang-1997 ; Katsufuji-2001 indicating strong magnetoelectric (ME) coupling in these materials. There has been a large amount of experimental work in recent years, with the aim to understand the microscopic mechanism for the coupling between magnetic and electric degrees of freedom in these materials. Although it is generally believed that the spin-lattice coupling plays an important role in determining the complex properties in MnO3, much is unclear concerning the factors that influences the magnitude of the ME coupling Lee-Nature-2008 ; Aken-LuMnO3-PRB-2004 . In this Letter, we use inelastic neutron scattering (INS) and dielectric constant measurements to show that the magnitude of the ME coupling in multiferroic Y0.7Lu0.3MnO3 is directly coupled to the strength of the Mn trimerization distortion in these materials in the AFM phase. Our results thus provide direct evidence that the Mn trimerization is responsible for the ME effect and multiferroic phenomenon in Y1-yLuyMnO3.
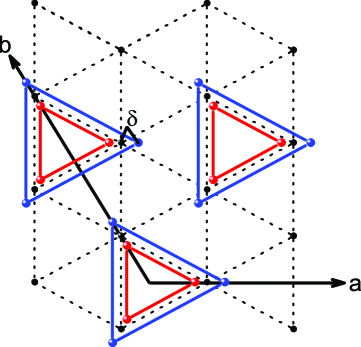
The undoped compounds YMnO3 and LuMnO3 are characteristic hexagonal manganites where the Mn3+ ions (Mn position at 1/3) form a nearly ideal triangular lattice in the -plane above . YMnO3 and LuMnO3 undergo AFM transitions (to two different magnetic structures) at 75 K and 88 K respectively, accompanied by an isostructural transition with large atomic displacement for all atoms in the unit cell. In particular, a distinct change of the Mn atomic position, namely the Mn trimerization distortion, occurs in the basal plane at Lee-Nature-2008 . As illustrated in Fig. 1, the Mn trimers distort in opposite directions in YMnO3 and LuMnO3, expanding for YMnO3 and contracting for LuMnO3. A recent theoretical study finds that the different magnetic structures of YMnO3 and LuMnO3 are determined by the different trimerization directions in these compounds Solovyev-PRB-2012-theory . Moreover, the dielectric anomaly at is observed only in but not in for both YMnO3 and LuMnO3 Katsufuji-2001 . Although these studies suggest that the Mn trimerization may play a key role in determining the magnetic structure and the ME effects in Y1-yLuyMnO3, there are no experimental studies to determine the connection between the Mn trimerization and ME coupling. Y1-yLuyMnO3 is an ideal system for such a study due to the following reasons: (1) since both Y and Lu are nonmagnetic, Y1-yLuyMnO3 is a clean system to study the magnetism of the Mn triangular lattice and its correlation with the ME effects; (2) the strength of the Mn trimerization distortion can be tuned in Y1-yLuyMnO3. With increasing Lu concentration, the Mn atomic position changes from 0.340 for YMnO3, larger than =1/3 for an ideal triangular lattice, to 0.331 for LuMnO3, smaller than 1/3. At 0.3 Lu doping, the Mn atomic position crosses the critical value =1/3 with a perfect triangular lattice without trimerization distortion Park-PRB-2010 .
All measurements reported here were performed on single crystal samples. Large Y1-yLuyMnO3 single crystals with nominal value of =0.3 were grown by the floating zone method under 4 atmospheres of oxygen flow. The crystals cut from the long rods were then annealed at 1350∘C for 24 hours in a flowing argon atmosphere. For the magnetic susceptibility and dielectric constant measurements, the single crystal was cut into thin plates with -axes lying in the plane and -axis pointing out of the plane. The magnetic susceptibility was measured using a Quantum Design Magnetic Properties Measurement System with magnetic field applied along the -axis. The dielectric constant was measured using a LRC meter with electric field applied perpendicular and parallel to the -axis and data were taken at 3.5 V ac driving voltage and 100 kHz frequency.
A single crystal with a mass of 4 gram was used for the neutron scattering experiments. The crystal was mounted on a aluminum plate and oriented in the ( 0 ) scattering plane. The sample was then sealed in aluminum sample can under helium atmosphere and cooled using a closed-cycle He refrigerator. The neutron experiments were carried out using the HB-1A and CTAX triple-axis spectrometers (TAS) located at the High Flux Isotope Reactor (HFIR), and the Hybrid Spectrometer (HYSPEC) located at the Spallation Neutron Source (SNS) at Oak Ridge National Laboratory. HB-1A is a fixed incident energy TAS (Ei=14.64 meV), and CTAX is a cold neutron TAS. Collimations of --sample-- downstream from the reactor to the detector was used for the HB-1A experiment with two pyrolitic graphite (PG) filters placed before the sample to eliminate higher-order contaminations in the beam. The CTAX experiment was performed with a fixed final energy of Ef=3 meV (energy resolution is 0.1 meV FWHM at elastic condition) and collimations of guide-open-sample--open. Higher-order contaminations were removed by a cooled Be filter placed between the sample and the analyzer. The HYSPEC experiment was carried out using an incident energy of Ei=25 meV with a Fermi chopper spinning at 420 Hz.
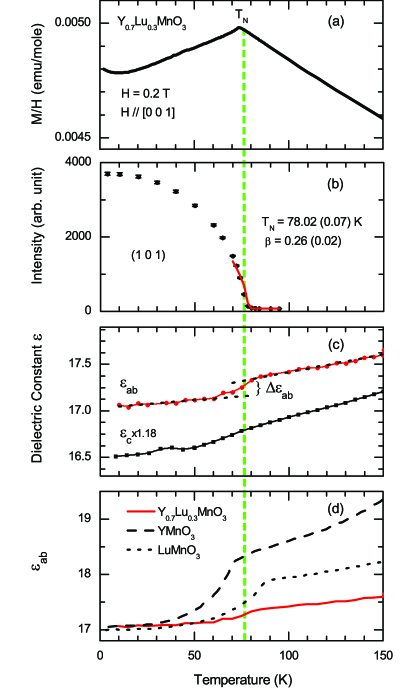
The Y0.7Lu0.3MnO3 sample was characterized by the magnetic susceptibility and neutron scattering magnetic order parameter measurements. Fig. 2 (a) shows the magnetic susceptibility measured with exhibiting a kink at K indicating the AFM transition. The order parameter plotted in Fig. 2 (b) was measured by monitoring the strong magnetic Bragg peak (1 0 1) as a function of temperature. The integrated intensity was obtained by fitting the (1 0 1) rocking curve measured at each temperature to a Gaussian function with a constant background. As illustrated by the dashed green line, the AFM transition at K was observed in both measurements consistent with previous reports Park-PRB-2010 . The solid red line in Fig. 2 (b) is a fit to a power-law I(T)=I0[(TN-T)/TN)]2β that yields 78.020.07 K and 0.260.02, where is the critical exponent. The yielded value 0.26 is between the theoretical values of a 2D (=0.125) and a 3D (=0.326) Ising system in good agreement with a prior study YMnO3-INS1-cryst .
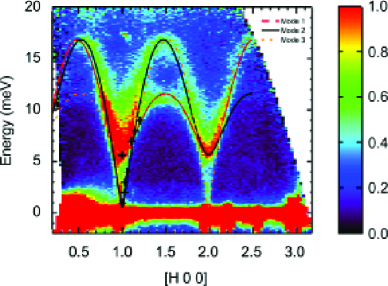
The spin dynamics of the Mn3+ ions has been investigated in detail in YMnO3, LuMnO3, and HoMnO3 YMnO3-INS1-cryst ; Vajk-PRL-2005 ; Lewtas-PRB-2010 ; YMnO3-INS1-powder ; YMnO3-INS2-powder . Fig. 3 shows the INS spectra of Y0.7Lu0.3MnO3 at 4K projected along the ( 0 0) direction. The measured spectra is very similar to that reported for YMnO3 and LuMnO3. At (1 0 0), two anisotropy gaps and were observed for both YMnO3 and LuMnO3, 2.4 meV and 5.4 meV for YMnO3 YMnO3-INS1-cryst , and 2.5 meV and 6.5 meV for LuMnO3 Lewtas-PRB-2010 , respectively. Compared to the parent compounds, our measurements show a much smaller gap in Y0.7Lu0.3MnO3. The same sample was then measured using both cold and thermal TAS at HFIR to better characterize the two gaps in Y0.7Lu0.3MnO3.
| Lattice (Å) | TN (K) | J (meV) | Dy (meV) | Dz (meV) | Refs. | |||
|---|---|---|---|---|---|---|---|---|
| YMnO3 | =6.132, =11.452 | 75 | 0.007 | 2.4 | 0.033 | 0.32 | 1.02 | Ref.YMnO3-INS1-cryst, |
| Y0.7Lu0.3MnO3 | =6.103(2), =11.403(1) | 78 | 0.001 | 2.57(5) | 0.0017(2) | 0.35(1) | 0.17 | This Work |
| LuMnO3 | =6.05, =11.4 | 88 | 0.003 | 2.9 | 0.035 | 0.4 | 0.77 | Ref.Lewtas-PRB-2010, |
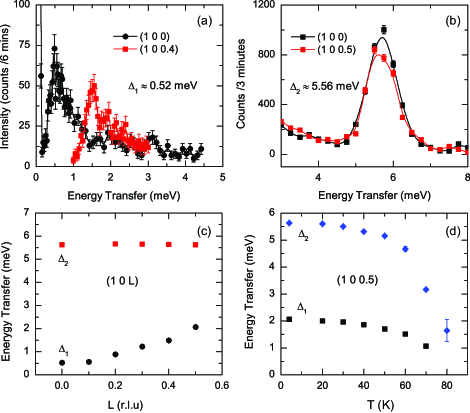
A summary of the TAS data along the -axis is shown in Fig. 4. As illustrated in Fig. 4 (a), 0.52 meV at (1 0 0) and the excitation shifts to 1.5 meV at (1 0 0.4). On the other hand, the 5.56 meV excitation shows no dependence as depicted in Fig. 4 (b). Fig. 4 (c) plots the dispersion curves along the direction for both excitations constructed from a series of energy scans at constant wave-vector. The data points were determined by fitting the energy scans at constant wave-vector assuming Gaussian peak-shapes. The 0.52 meV gap shows modest dispersion along the -direction with a maximum energy shift of 1.5 meV and the 5.56 meV gap is dispersionless along within the instrumental resolution. The TAS data points along are plotted in Fig. 3 to show a good agreement with the HYSPEC data. Weak dispersions were observed along out of the hexagonal plane and strong dispersions were observed along in the hexagonal plane consistent with the layered magnetic structure of Y1-yLuyMnO3. Fig. 4 (d) shows the temperature evolution of the excitations measured at (1 0 0.5). The energy of both excitations decrease with increasing temperature and vanish at confirming their magnetic origin. In summary, the q and temperature dependence of the magnetic spectra of Y0.7Lu0.3MnO3 show very similar behavior comparing to YMnO3 and LuMnO3 except for the significantly smaller 0.52 meV.
In order to make a quantitative comparison between YMnO3, Y0.7Lu0.3MnO3, and LuMnO3, we model the dispersion of the magnetic excitations in Fig. 3 using the same linear spin wave analysis that has been applied to analyze the HoMnO3 and YMnO3 INS data Vajk-PRL-2005 ; YMnO3-INS1-cryst . The model, defined by the Hamiltonian = J + , takes into account the nearest-neighbor exchange interaction , and two single ion anisotropy terms and representing the in-plane and out-of-plane anisotropy constants, respectively. Three modes are obtained with the following dispersion equation:
| (1) |
where ( = 1, 2 or 3) is defined by lattice Fourier sums identical to Ref. Vajk-PRL-2005, , and = 2 for Mn3+ ions. A fit to the data using Eq. 1 yields = 2.57 (0.05) meV, = 0.0017 (0.0002) meV, and = 0.35 (0.01) meV. Our INS data can be well described by the model as depicted in Fig. 3 comparing the three spin wave modes calculated using the fitting parameters to the measured magnetic spectra. The obtained fitting parameters are listed in Table 1 in comparison with the results for YMnO3 and LuMnO3 note2 . The lattice constants, , and values of Y0.7Lu0.3MnO3 all fall in between the values of YMnO3 and LuMnO3. This is consistent with the lattice parameters and unit cell volume being contracted from YMnO3 to LuMnO3. However, a much smaller value was obtained for Y0.7Lu0.3MnO3.
At the zone center, the energy of the two magnetic excitations can be described as = and = corresponding to the in-plane and out-of-plane single ion anisotropy gaps YMnO3-INS1-cryst . Unlike YMnO3 and LuMnO3 which have almost the same value of 2.5 meV regardless the opposite trimerization distortion direction in these materials, a smaller in-plane anisotropy gap 0.52 meV was observed in Y0.7Lu0.3MnO3 that yields a significantly smaller 0.0017 meV value. Previous systematic study indicates that the Mn atomic position in Y0.7Lu0.3MnO3 is very close to the critical value ( 1/3) Park-PRB-2010 , the Mn trimerization distortion in Y0.7Lu0.3MnO3 is much weaker comparing to YMnO3 and LuMnO3. The in-plane single ion anisotropy is coupled to the Mn trimerization in the hexagonal plane thus is very sensitive to the strength of trimerization distortion Solovyev-PRB-2012-theory . We attribute the observed small in-plane anisotropy gap to the weaker Mn trimerization distortion in Y0.7Lu0.3MnO3. It is thus of great interest to see how the weaker Mn trimerization distortion affects the magnitude of the ME coupling. If the ME effect is directly linked to the Mn trimerization distortion, we would expect a much weaker in-plane dielectric anomaly in Y0.7Lu0.3MnO3 which is indeed what we observed in the dielectric constant measurements. As illustrated in Fig. 2 (c), at , no anomaly was observed in consistent with previous reports, whereas a weaker dielectric anomaly was observed in . Fig. 2 (d) compares the in-plane dielectric constant between YMnO3, LuMnO3 and Y0.7Lu0.3MnO3 ( values for YMnO3 and LuMnO3 are taken from Ref. Katsufuji-2001, and plotted in Fig. 2 (d) with a -2.1 and 0.3 offset, respectively) and it clearly shows that the dielectric anomaly observed in Y0.7Lu0.3MnO3 is much weaker comparing to YMnO3 and LuMnO3.
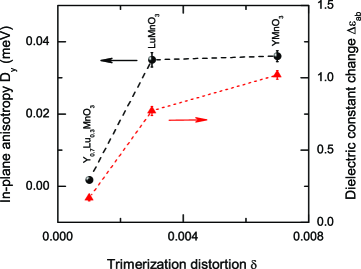
Table 1 compares our Y0.7Lu0.3MnO3 results to the ones reported for YMnO3 and LuMnO3 from the previous study. We define a trimerization distortion parameter to reflect the strength of the trimerization distortion, = as depicted in Fig. 1. The values listed in Table 1 are based on the data reported in Ref. Park-PRB-2010, . We also define a critical dielectric constant change parameter to represent the magnitude of the ME coupling at . As shown in Fig. 2 (c), the and data are fit to a linear function respectively, and is the difference between these two fittings at . The vs. and vs. for YMnO3, Y0.7Lu0.3MnO3, and LuMnO3 are plotted in Fig. 5. It shows that both and decrease with decreasing indicating strong correlations between the strength of trimerization distortion and the magnitude of ME coupling.
In summary, our INS study of Y0.7Lu0.3MnO3 reveals a small in-plane single ion anisotropy gap that coincides with a weaker dielectric anomaly in . This is attributed to a much weaker Mn trimerization distortion in Y0.7Lu0.7MnO3 due to the doping influence of the Mn atomic position 1/3. These results provide strong evidence that the Mn trimerization is responsible for the ME effect in Y1-yLuyMnO3 and the magnitude of ME coupling is coupled to the strength of the trimerization distortion. High resolution neutron diffraction study have shown that the Mn trimerization is a systematic feature in RMnO3 Fabreges-PRL-2009 , this finding may shed light on a deeper understanding of the multiferroic phenomenon in this series of materials inviting further theoretical investigations.
We acknowledge valuable discussions with Randy Fishman. Work at the High Flux Isotope Reactor and Spallation Neutron Source, Oak Ridge National Laboratory, was sponsored by the Scientific User Facilities Division, Office of Basic Energy Sciences, U.S. Department of Energy. The single crystal growth and neutron scattering work at UTK/Rice is supported by the U.S. DOE BES under Grant No. DE-FG02-05ER46202.
References
- (1) M. Fiebig, J. Phys. D: Appl. Phys. 38, R123 (2005).
- (2) N. A. Spaldin and M. Fiebig, Science 309, 391 (2005).
- (3) Y. Tokura, Science 312, 1481 (2006).
- (4) W. Eerenstein, N. D. Mathur, and J. F. Scott, Nature 442, 759 (2006).
- (5) T. Kimura, T. Goto, H. Shintani, K. Ishizaka, T. Arima, and Y. Tokura, Nature 426, 55 (2003).
- (6) N. Hur, S. Park, P. A. Sharma, J. S. Ahn, S. Guha, and S. W. Cheong, Nature 429, 392 (2004).
- (7) S.-W. Cheong and M. Mostovoy, Nat. Mater. 6, 13 (2007).
- (8) M. Fiebig, Th. Lottermoser, D. Frhlich, A. V. Goltsev, and R. V. Pisarev, Nature 419, 818 (2002).
- (9) T. Lottermoser, T. Lonkai, U. Amann, D. Hohlwein, J. Ihringer, and M. Fiebig, Nature 430, 541 (2004).
- (10) A.B. Harris, and G. Lawes, Ferroelectricity in incommensurate magnets, in The handbook of Magnetism and Advanced Magnetic Materials, Wiley, London, 2006. (e-print cond-mat/0508617)
- (11) T. Choi, Y. Horibe, H. T. Yi, Y. J. Choi, W. Wu, and S.-W. Cheong, Nat. Mater. 9, 253 (2010).
- (12) D. G. Tomuta, S. Ramakrishnan, G. J. Nieuwenhuys, and J. A. Mydosh, J. Phys.: Condens. Matter 13, 4543-4552 (2001).
- (13) Nobuyuki Iwata and Kay Kohn, J. Phys. Soc. Jpn. 67, 3318-3319 (1998).
- (14) Z. J. Huang, Y. Cao, Y. Y. Sun, Y. Y. Xue, and C. W. Chu, Phys. Rev. B 56, 2623 (1997).
- (15) T. Katsufuji, S. Mori, M. Masaki, Y. Moritomo, N. Yamamoto, and H. Takagi, Phys. Rev. B 64, 104419 (2001).
- (16) Bas B. Van Aken, and Thomas T. M. Palstra, Phys. Rev. B 69, 134113 (2004).
- (17) S. Lee, A. Pirogov, M. Kang, K.-H. Jang, M. Yonemura, T. Kamiyama, S.-W. Cheong, F. Gozzo, N. Shin, H. Kimura, Y. Noda, and J.-G. Park, Nature (London) 451, 805 (2008).
- (18) I. V. Solovyev, M. V. Valentyuk, and V. V. Mazurenko, Phys. Rev. B 86, 054407 (2012).
- (19) J. Park, S. Lee, M. Kang, K.-H. Jang, C. Lee, S. V. Streltsov, V. V. Mazurenko, M. V. Valentyuk, J. E. Medvedeva, T. Kamiyama, and J.-G. Park, Phys. Rev. B 82, 054428 (2010).
- (20) Tapan Chatterji, S. Ghosh, A. Singh, L. P. Regnault, and M. Rheinstdter, Phys. Rev. B 76, 144406 (2007).
- (21) O. P. Vajk, M. Kenzelmann, J.W. Lynn, S. B. Kim, and S.-W. Cheong, Phys. Rev. Lett 94, 087601 (2005).
- (22) Junghwan Park, J.-G. Park, Gun Sang Jeon, Han-Yong Choi, Changhee Lee, W. Jo, R. Bewley, K. A. McEwen, and T. G. Perring, Phys. Rev. B 68, 104426 (2003).
- (23) T. J. Sato, S. -H. Lee, T. Katsufuji, M. Masaki, S. Park, J. R. D. Copley, and H. Takagi, Phys. Rev. B 68, 014432 (2003).
- (24) H. J. Lewtas, A. T. Boothroyd, M. Rotter, D. Prabhakaran, H. Mller, M. D. Le, B. Roessli, J. Gavilano, and P. Bourges, Phys. Rev. B 82, 184420 (2010).
- (25) The listed , , and values for LuMnO3 in Table 1 were obtained by refitting the data in Ref. Lewtas-PRB-2010, using the same model.
- (26) X. Fabrges, S. Petit, I. Mirebeau, S. Pailhs, L. Pinsard, A. Forget, M. T. Fernandez-Diaz, and F. Porcher, Phys. Rev. Lett 103, 067204 (2009).